The recent Italian elections yielded a hung parliament. Votes were shared almost equally between the centre-left coalition of Bersani, the centre-right coalition of Berlusconi, and the new Five Star Movement of Grillo. Monti's Civic Choice party appealed to only one in ten voters.
The election results show that Grillo and Berlusconi have been quite successful in depicting Mario Monti as Angela Merkel's ‘longa manus’ in Italy, and in blaming her austerity measures for the current recession. Unlike financial markets, which hailed Monti for restoring Italy's ‘credibility’ by fixing the budget, starting an ambitious reform agenda, and for steering the country off the cliff of default, Monti's opponents claimed that Monti’s supporters (the ‘Mario Italians’) had Draghi, not Monti, to thank for reducing the ‘spread’. After all, it was Draghi's speech of 26 July 2012 –"We will do whatever it takes ... and, believe me, it will be enough" – and the subsequent Outright Monetary Transaction programme in early September 2012 that reassured investors over the impossibility of a Eurozone breakup.
For economists, unlike for politicians, this is clearly an empirical question. We argue that what has happened to interest rates and credit default swap spreads in Italy since July 2011 looks like a short-lived confidence crisis. The evidence suggests that Monti did indeed ‘punch the bubble’ by restoring ‘credibility’.
A short tale of the recent Italian ‘bubble’
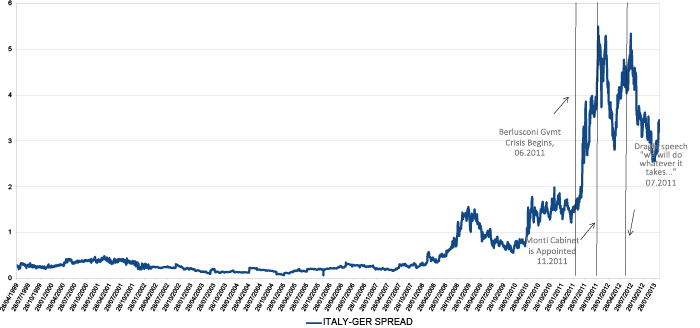
Amid tensions due to the Greek crisis, the Berlusconi government was weakened by unfavourable local elections in May 2012; sex scandals; an internal scission in April 2012; and the ECB letter from Trichet and Draghi in early August 2012. The spread between the ten years Italian Treasury Bonds (BTP) and the Bund rose sharply from 1.6% in June to 5.5% in November 2012 (see Figure 1), forcing Berlusconi 's resignation and Monti's appointment. The interest differential has since fallen – albeit not immediately – but started to climb up again, from March until July 2012 when Draghi made his speech.
Figure 1. Spread Italy-Germany (10yr Benchmark Bond yields)
CDS spread: Italy vs. Spain
In order to isolate the possible impacts Monti and Draghi have had on asset prices, it is useful to compare Italian and Spanish sovereign credit default swap spreads, the premium for insuring against sovereign default. One common indicator of the perceived sovereign-default risk is based on the default probabilities that are implicit in credit default swap contracts of different maturities. From contracts stipulated today for insuring against, say, an Italian default over one to five year periods, it is possible to recover the probability that, today, the market assigns to an Italian default five years from now, conditional on not defaulting for the preceding four years1.
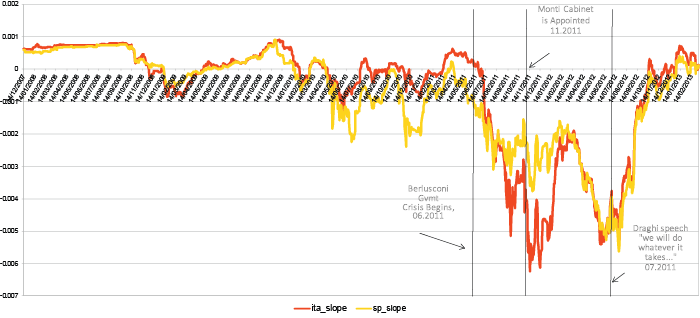
In particular, we calculate the ‘slope’ of the term structure of default probabilities on each day since January 2007. This slope is a positive (or negative) number if the conditional default probability of default rises (or falls) on average when more distant maturities are considered2. When this slope turns negative, market participants perceive that the short-term risks of default exceed the long-term risks, a scenario which is considered extremely dangerous. Figure 2 shows this indicator for Italy (in red) and Spain (in yellow).
Figure 2. Slope of the term structure of default probabilities, Italy and Spain
Note: CDS spreads; maturities 1-10. Source: Thomson Reuters
From Figure 2 we clearly see that the two curves move together until mid-June 2011, the beginning of the Berlusconi crisis. At that point, the Italian slope plunges well below the Spanish one, as the Italian short-term default risk sky-rockets relative to longer-term risk. On 18 November 2011, the Monti cabinet takes office and the Italian term structure recovers rapidly. As of January 2012, the Italian and Spanish curves are back together.
In March 2012 both curves plunge again, as the Italian and the Spanish short-term default risks start rising again. This goes on until July 2012, the time of Draghi’s speech. A ‘Draghi effect’ is possibly the common driver of the slope's recovery in both countries. The result is to take the pressure off the short-term maturities, and to decrease the cost of refinancing both the Italian (see Figure 1) and Spanish debts.
Interest-rate spreads: Italy vs. Spain
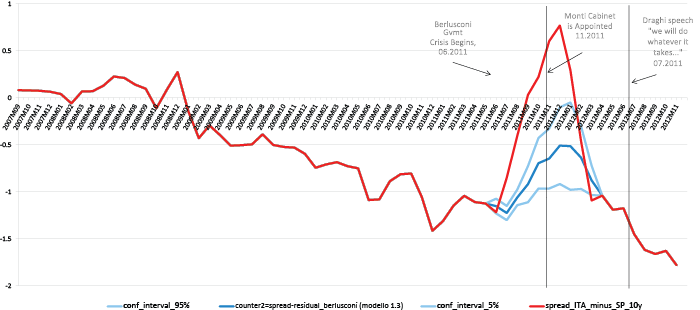
Looking directly at interest-rate spreads gives a similar picture. Figure 3 shows the difference between the Italian and Spanish ten-year bond rates (in red). The pattern is quite clear: there is a long-lasting downward trend since 2007 towards a minimum in December 2010 when Italian yields fall below Spanish yields by 1.4 percentage points; in June 2011, however, the crisis of the Berlusconi government pushes up the spread until, in December 2012, it reaches a maximum of +0.77, just one month after Monti is voted in. Next, the spread falls as sharply as it rose, and in July it is back to trend. As for the credit default swap term structure, the Draghi effect does not seem to matter for the difference in interest yields (as we would expect).
Counterfactuals
How much of the swings of relative yields can be attributed to economic ‘fundamentals’ and how much to expectations (what economists call ‘credibility’)3? What we do next is to construct a counterfactual Italian-Spanish spread in order to see how important the ‘credibility effect’ is, and to what extent it can be reasonably attributed to Monti or Draghi (or both). We control for the effect on the Italian-Spanish spread of (lagged) economic fundamentals (the two countries' consumer price index rates of inflation, the rates of growth of industrial production, the debt-to-GDP ratios, the general government deficit-to-GDP ratio, the current-account-to-GDP ratio, a credit default swap spread on the main Spanish banks, the ‘VIX’ volatility index)4 and ask the following question: what values would the Italian-Spanish spread had taken if only fundamentals had mattered?
This counterfactual Italian-Spanish spread is the dark blue line in Figure 3 (the lighter lines show the confidence intervals). The distance between the actual (red) and the counterfactual (blue) spread is the systematic ‘unexplained’ component, that we label ‘credibility’. When the red line rises above the blue line, it means that the Italian credibility worsens compared with the Spanish one, because financial markets price a higher probability of default/euro exit for Italy than Spain, over and above the level warranted by the two countries' fundamentals. The figure shows a familiar pattern. Italian credibility worsens dramatically in June 2011 – the crisis of the Berlusconi government – but it starts to improve from December 2012, one month after the start of the Monti government. In three months the yield differential is back to trend. To us, this looks like a (short-lived) confidence crisis that starts with Berlusconi and ends with Monti. The rise and fall of the bubble cannot be attributed to Draghi or to the Outright Monetary Transactions.
Figure 3. Actual and counterfactual spreads, Italy-Spain, 10 year yields
Conclusions
Our analysis of interest yields and CDS spread is consistent with the view that an important confidence crisis occurred in the final months of the Berlusconi government, and that Monti essentially punched the bubble. The specific run on the Italian debt was largely over at the time of Draghi declarations, although the intervention of the ECB dampened the 2012 common shock which affected both Italy and Spain.
A few clear implications emerge from the analysis.
- ‘Credibility’ of policymakers is very easy to lose, as the recent run on Italian debt suggests, but very painful to earn, as the unprecedented recession following the Monti austerity measures clearly shows;
- So far, the ECB has committed to the strategy of complementing, rather than substituting, national adjustment policies so that governments should not rely upon unconditional bailouts with Outright Monetary Transactions, neither de facto nor de jure;
- The ‘new’ (and ‘old’) Italian political leaders should not underestimate the formidable challenge facing the country: to get Italy out of depression without jeopardising the country’s barely earned credibility.
References
Hull, J C, and A White (2000), "Valuing credit default swaps I: No counterparty default risk”, Journal of Derivatives, 8(1), 29-40.
Manasse, Paolo and Luca Zavalloni (2013), “Sovereign Contagion in Europe: Evidence from the CDS Market”, Quaderni DSE Working Paper N° 863, 18 January.
1 These conditional probabilities are calculated assuming a recovery rate of 40% in case of default, using the zero coupon bond curve as risk-free rate and following the methodology of Hull and White (2000).
2 Each point in the graph is calculated as follows: for each day, the default probabilities for different maturities, from 1 to 10 years, are regressed upon the corresponding maturity 1-10 .The coefficient of this regression is the ‘slope’ on that day, reported on the graph.
3 For an empirical investigation of the role of fundamentals and credibility in the recent European experience of contagion among sovereign CDS spreads, see Manasse and Zavalloni (2013).
4 All explanatory variables are converted to monthly data, if available at lower frequencies, and are lagged one month; we also control for financial volatility by including the VIX index, and for the possible effects of a bailout of Spanish banks through EFSF, by using a CDS spread index of the largest Spanish Banks. Finally, we include time dummies from June 2011, when the spread shot up, to March 2012. The estimated values of these time dummies measure the systematic component of the spread that is unrelated to Italian and Spanish economic fundamentals, and that appears as the difference between the two curves in the graph. A technical appendix is available from the authors upon request.


