The Global Financial Crisis of 2008-09 and the evolving crisis in Europe raise many intriguing questions regarding the long-term response to crises. Households that lost access to credit, were forced to adjust and increase saving. It is not clear, however, whether that forced transition will last; will households remain bigger savers than they would have been had the global financial meltdown not occurred? For how long will this increased saving last? Will it have a perceptible impact in the decades to come? In contrast, the public sector typically does not need to adjust its saving behaviour immediately in the face of a crisis, and may find delayed adjustment preferable and attainable. Does exposure to crises, however, change the public sector’s saving policy in the long term? Do political actors persist in a new behaviour or alternatively if and when do they revert back to a previous one?
Several recent papers have shown that personal experiences matter for individuals when making financial decisions: Malmendier and Nagel (2011) examined the impact of exposure to stock-market return history on household investment risk-taking in the US, Malmendier et al. (2011) investigated the impact of the Great Depression on the behaviour of company CEOs who grew up during that period. In Aizenman and Noy (2013) we ask related questions in the macro context – we study the degree to which past catastrophic income shocks increase the saving rates of affected households, and impact the saving behaviour of the public sector. Our results are consistent with these history-dependent dynamics, where past crises tend to increase savings among households, but lead to decreased public-sector saving.
Methodology and data
We hypothesise that past large and adverse income shocks are empirically important in determining current saving behaviour, in both the private and the public sector. We construct an ‘exposure to income catastrophes’ index for every country and time observation in our dataset. The index is constructed from country-wide demographic data on the size of each cohort and the history of each cohort’s exposure to catastrophic recessions since birth. Since the exposure to income catastrophes index does not change much every year, we construct our dataset in five-year gaps: since saving data is typically available reliably only from the 1980s, we calculate the index for five observations per country.1
Following Barro and Ursua (2012), we define a catastrophic shock as a time period in which the cumulative decline in per capita income was larger than ten percentage points. For our sample of high-income countries, the peak occurrences of these catastrophic shocks are both world wars, with some countries experiencing very dramatic declines in per capita incomes.2
We next examine the exposure of a typical person from each age group for each country (for all age groups between 25 and 80 in five-year gaps). A typical 30-year-old in 1985, for example, was exposed to all crises occurring in her country starting in 1955. We calculate a weighted average of her exposure; with linearly declining weights.
In the regressions, we estimate the determinants of measures of saving rates (household saving, private and public saving) across countries, controlling for the an ‘exposure to income catastrophes’ index, and controlled used in previous papers: average GDP growth in previous five-yearperiod; the real interest rate (average for previous five years); labour participation rate (average for previous five years); and a proxy for institutional strength.3
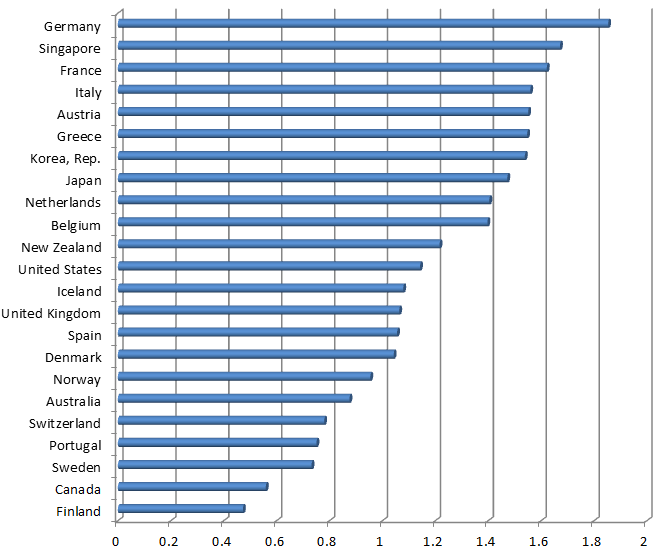
Figure 1 includes a detailed comparison of the index, calculated for the year 2005, for all the countries in our sample. Germany has the highest index, given its exposure to very catastrophic declines in income in the interwar period and most notably after 1945. Singapore also has a high index, as it experienced large income shocks later than most high-income countries for which most of the post-WWII period has been benign.
Figure 1. Recession history index – 2005
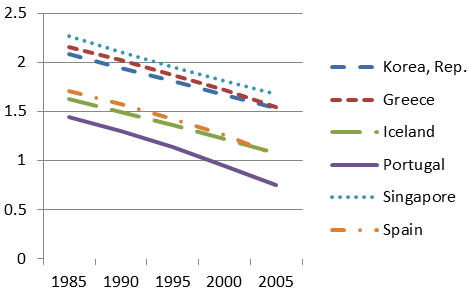
In Figures 2a-2c, we document the evolution, over our sample period, of the index for the countries in our dataset.4 The most noticeable observation is the consistent decline in the measured index over this time period. The obvious reason for this decline is that all these countries have not experienced any dramatic negative shocks to per capita income (more than 10%) since the beginning of the sample in 1980, and as the memory of the earlier shocks receded, so did the measured index.
Figure 2a. The index over time: Emerging high-income
Figure 2b. The index over time: Continental Europe
Figure 2c. The index over time: Other
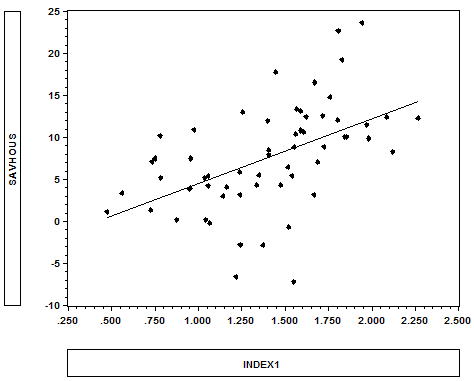
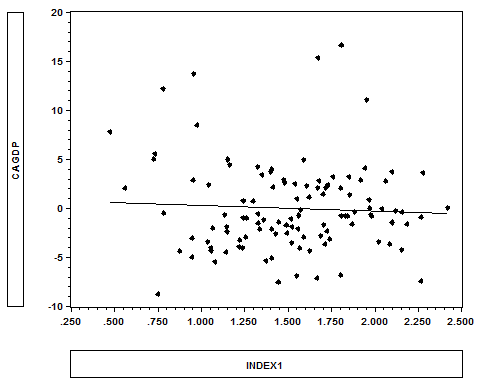
Figures 3a-3c contain plots of all the observations in our data, and the bi-variate relationship between the exposure to income catastrophes index and our measures for household saving, government saving, and the current account. Higher exposure to past crises (measured by the exposure to income catastrophes index) are correlated with higher household saving and lower government saving. We detect a much weaker negative correlation between the current-account surplus and the index.
Figure 3a. Bi-variate: Household saving and the index
Figure 3b. Bi-variate: Government saving and the index
Figure 3c. Bi-variate: Current-account surplus and the index
In the private-saving regressions we ran, the exposure to income catastrophes index is always statistically significant, usually at the 1% level. A one standard deviation increase in the index associated with an increase of about three to four percentage points in household saving (as a percentage of GDP). The impact of the exposure to income catastrophes on household saving is quite significant, with an increase of three to four GDP percentage points for a one standard deviation increase in the index, while the impact on public saving is smaller, and has the opposite sign (about 1.5% GDP percentage point decrease in public saving for every one standard deviation change in the index).
Saving after the Global Financial Crisis of 2008 and beyond
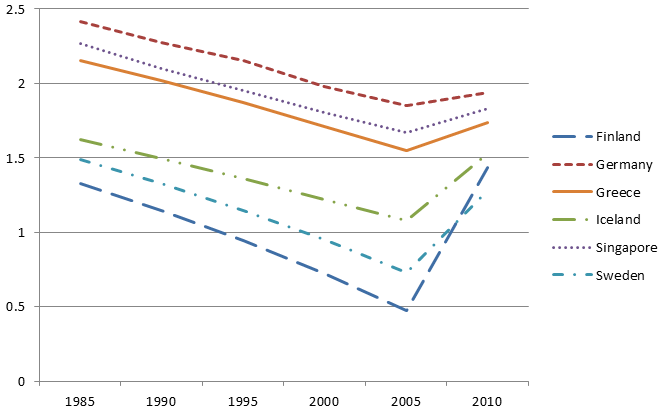
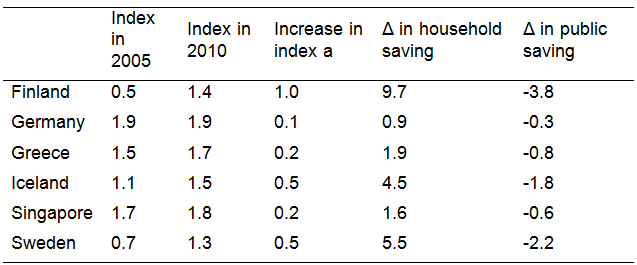
The dynamic impacts we document are bound to play important roles in the coming decades given the unprecedented nature of the 2008-2010 global financial crisis. Given the global nature of this event, all countries experienced some loss with the highest loss recorded for Finland (13.9%).5 Figure 4 describes the calculation of the exposure to income catastrophes index for the six countries that have experienced a cumulative decline of at least 8% in per capita income.6 Table 1 records the impact of the increase in the exposure index on public and household saving that we project given our empirical results. Not surprisingly, Finland is projected to experience the largest increase in household saving and the largest decrease in public saving, but the average increase in the household saving rate for this group of countries that have experienced catastrophic income shocks during the Global Financial Crisis is about four percentage points (of GDP). The corresponding figure for public saving is -1.6 (as a percentage of GDP). These are substantial impacts. None of the three largest economies – the US, Japan, and China – have experienced as large a catastrophic shock as the ones we have focused on in this paper. It is possible, however, that at least in the case of the US – the centre of the Global Financial Crisis – the shock was drastic enough to engender long-term changes in households’ saving rates.
Figure 4. Countries with GFC income loss higher than 8%
Table 1. The Impact of the GFC on saving rates (in percentage points of GDP)
Notes: The table describes the impact on the saving rate/GDP ratio of the increase in projected saving rates (household and public) for the countries in our sample whose per capita output loss during the global financial crises exceeded 8%. Finland, Greece and Iceland also exceeded 10% (as in the Ursua-Barro dataset). a Rounded numbers.
References
Aizenman, Joshua and Ilan Noy (2013), “Public and Private Saving and the Long Shadow of Macroeconomic Shocks”, NBER working paper 19067.
Barro, Robert J, José F Ursua (2012), “Rare Macroeconomic Disasters”, Annual Review of Economics 4, 83-109.
Malmendier, Ulrike, and S Nagel (2011), “Depression Babies: Do Macroeconomic Experiences Affect Risk-Taking?”, Quarterly Journal of Economics 126(1), 373-416.
Malmendier, Ulrike, G Tate and J Yan (2011), “Overconfidence and Early-life Experiences: The Effect of Managerial Traits on Corporate Financial Policies”, Journal of Finance 66(5).
Mason, Andrew, And Tomoko Kinugasa (2007), “Why Countries Become Wealthy: The Effects of Adult Longevity on Saving”, World Development 35(1), 1–23.
1 The index was constructed for 1985, 1990, 1995, 2000, 2005, thereby covering 1980-2005. For demographic cohort-size data we use the World Bank’s World Development Indicators while for data on catastrophic income shocks since 1900 we use the data from Barro and Ursua (2012).
2 Belgium, for example, experiences a 47% decline associated with WWI, while Germany experienced a 73% at the end of WWII. The last catastrophic shock (until the recent Global Financial Crisis) was experienced by Singapore in the late 1950s (11.3% decline in per capita income).
3 These controls follow Kinugasa and Mason (2007), who have also estimated the determinants of saving rates across countries.
4 We distinguish between emerging high-income countries over this period (South Korea, Greece, Iceland, Portugal, Singapore and Spain), continental western Europe, a group of English-speaking countries (and Japan).
5 Greece’s loss is ongoing and is likely to surpass Finland. We use WDI data which only has the information until the end of 2011 – at that time the cumulative Greek loss was 10.1%.
6 Clearly, all experienced an increase in their exposure index, with the most notable increase for Finland, given its low previous index level and the very large drop of incomes that they experienced. In contrast, Germany experienced the mildest increase, given both its very high level before the crisis and its relatively milder drop in incomes during the Global Financial Crisis.
