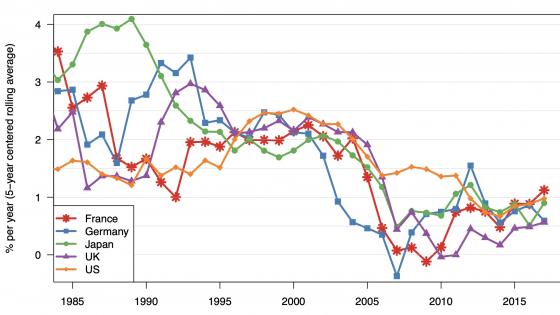
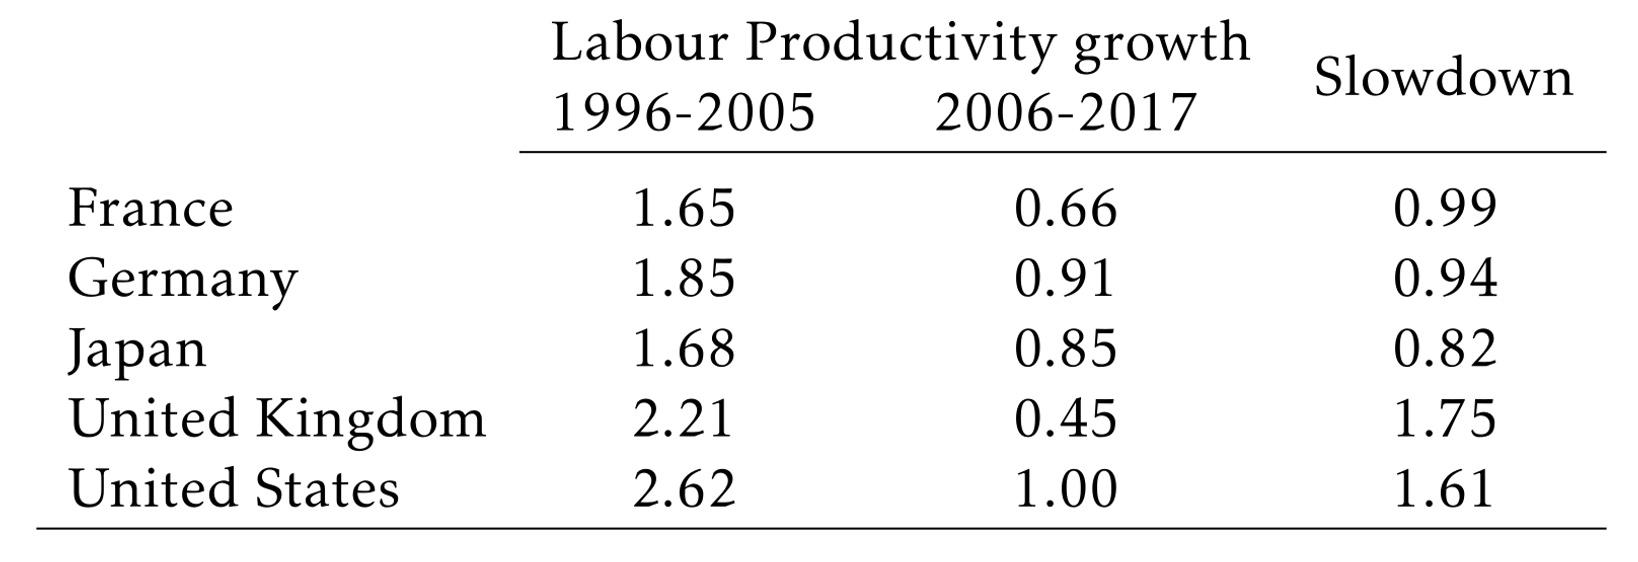
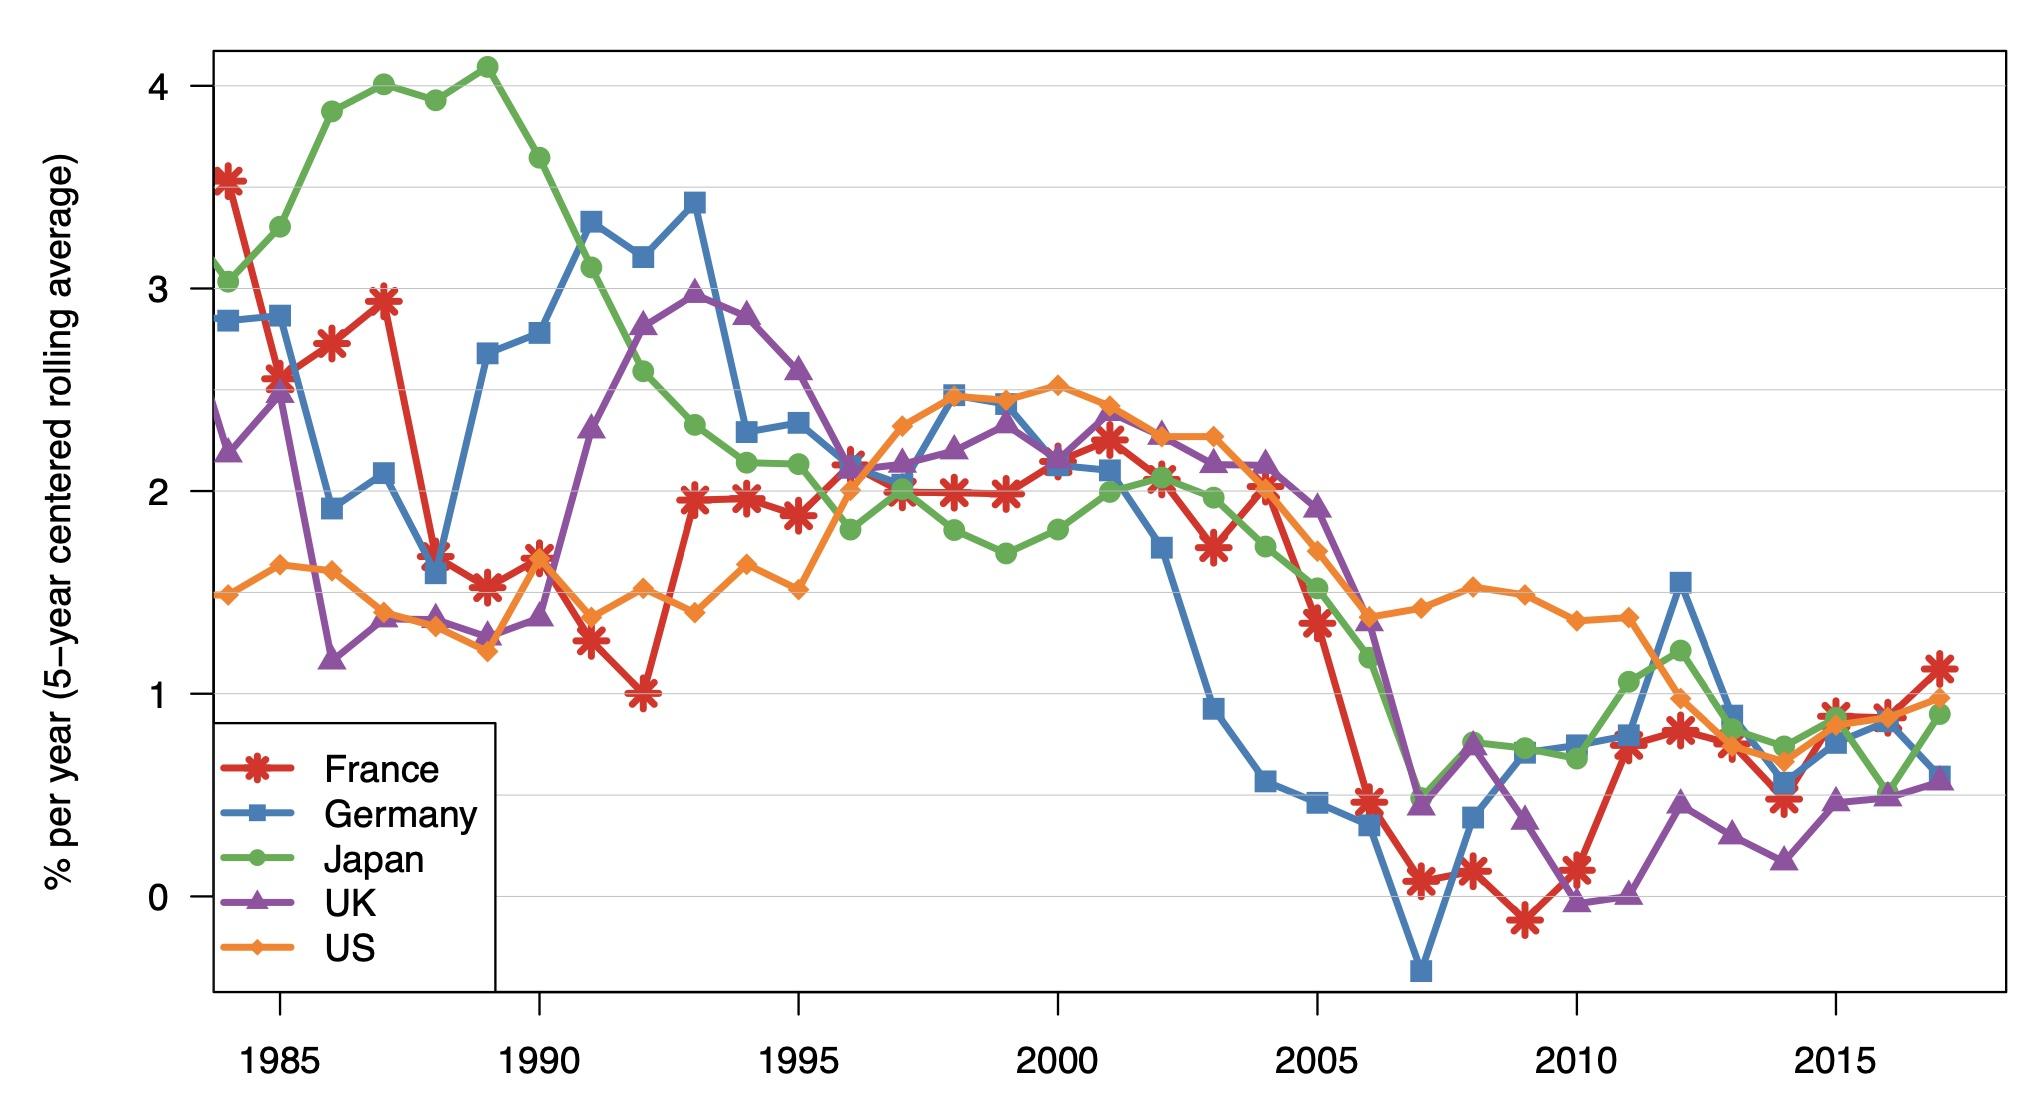
Labour productivity growth is the main long-run determinant of improved living standards. Its recent decline is a matter of concern, but there is no consensus on causes and solutions (Ilzetzki 2020). Considering five advanced economies, the data show that labour productivity growth rates have at least halved between 1995-2005 and 2006-2017 (see Table 1 and Figure 1). GDP per capita in 2017 is therefore several thousand dollars lower than it would have been based on the previous trend (Syverson 2017).
Table 1 Labour productivity growth in five advanced economies
Source: Data from EU-KLEMS 2019 (Stehrer et al. 2019).
Note: The periods for Japan (1995-2015) and the US (1998-2017) are slightly different due to data coverage.
Why is productivity slowing down? This question is the subject of many studies, which offer a wide range of explanations. We found that none of these alone can explain the productivity slowdown, but a small number of causes in combination can explain most of the slowdown (Goldin et al. 2021).
Figure 1 Labour productivity growth in five advanced economies
Note: Five-year centred rolling averages, based on data from the Long-Term Productivity Database (Bergeaud et al. 2016).
We use three criteria to evaluate each explanation. First, scale – the cause needs to be commensurate to the extent of the slowdown. Second, scope – the slowdown needs to have affected most OECD countries, as well as other economies (an explanation that only applies in one country is unlikely to qualify). Third, sequencing – to account for the slowdown the change needs to precede its onset. This is why the global crisis is ruled out as the unique cause, as are slow secular movements such as ageing.
By definition, a slowdown is a period of slower growth by comparison to a previous period of faster growth. So, one hypothesis is simply that previous rates of growth were exceptional. It could be, for example, that the US had high growth because of the large one-off gains from the deployment of ICT technologies in the 1995-2005 period (visible in Figure 1). But current rates of productivity growth in the US are low, even by fairly long-run historical standards (Bergeaud et al. 2016). Similarly, it can be argued that Europe had a high growth because it was converging to the US. And yet, Europe–US convergence was already low in 1995-2005.
To organise other explanations, and to provide some context, we draw on a classical decomposition of the sources of labour productivity growth into the contributions of the growth of human capital, the growth of capital per worker (‘capital deepening’), and the growth of total factor productivity (TFP), using data from EU KLEMS 2019 (Stehrer et al. 2019). In spite of the country-level heterogeneity, the slowdown of labour productivity is of the order of one to two percentage points per year, and originates predominantly from lower contributions of total factor productivity and capital deepening. A decomposition of the contributions by industry reveals three facts: the slowdown affects most industries; manufacturing has been a large contributor to the slowdown in all countries; and the recent slowdown is not due to slower reallocation from low to high productivity industries.
With this in mind, which productivity slowdown explanations look most plausible? First, we evaluate the view that output is increasingly mismeasured. This appears compelling as an explanation of the productivity ‘paradox’, since it reconciles the slowdown with perceived rapid technological change. We compile a number of biases that have been reported within existing research. These are essentially biases in deflators and issues with the GDP asset and production boundaries – intangible investment in particular. Taken together, these explain roughly 15% of the US slowdown. It is plausible that a similar estimate would apply for other leading economies.
Second, we review key explanations for the lower rate of growth of capital per worker. From an accounting point of view, the slowdown is mostly due to ‘traditional’ capital (non-ICT physical capital), while ICT capital and ‘intangibles’ have also contributed to the productivity slowdown. We review two sets of explanations: ‘cyclical’ effects linked to the 2008 global crisis (such as credit constraints and weak demand); and more ‘secular’ factors (that are independent of the business cycle). These include the changing nature of investment towards intangibles, which are riskier and harder to finance (Haskel and Westlake 2018); globalisation, which in some sectors implies a shift from domestic to foreign investment; and changes to corporate governance, which may have lowered incentives to invest. We do not evaluate all these explanations independently but attribute the contribution of capital deepening equally to cyclical and secular factors. In the US, about 44% of the labour productivity slowdown is due to capital deepening. We find similar contributions for Germany and the UK, and much larger effects for Japan. In addition to this, it has been argued that investment in intangible assets, which lead to large spillovers, also affect total factor productivity (Corrado et al. 2020). We find that the slowdown in intangible investment contributes almost 17% of the slowdown in the US, although we generally find much smaller effects in other countries.
Third, changes to human capital – as measured in growth accounting – have not been significant contributors to the productivity slowdown as the composition of the labour force changes slowly, at least in most countries. That said, when we consider education, skills, migration, ageing, and labour market institutions, we find that many recent or secular changes may also contribute to the total factor productivity slowdown. While slow changes cannot completely explain the sharp drop in productivity since the 2000s, they may have compounded the slowdown.
Fourth, the slowdown in global trade has contributed to the productivity slowdown. International trade increased strongly after China’s entry to the WTO, triggering a reorganisation of global value chains. But these productivity-enhancing trends clearly slowed down after the global crisis. Using published estimates of the impact of global value chain integration on labour productivity growth (Constantinescu et al. 2016, 2019), we estimate that the slowdown in trade has contributed about 15% to the productivity slowdown in the US. For the rest of the countries (other than Germany), trade effects are less identifiable.
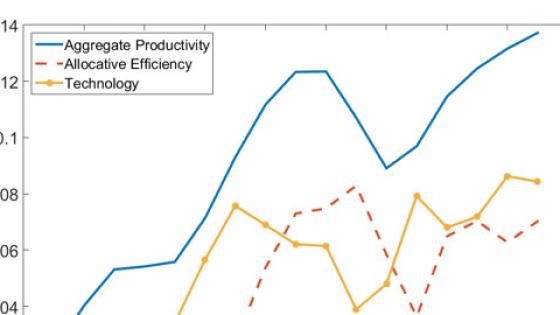
Fifth, we attempt to take stock of the vast body of research on business dynamism, competition, and misallocation. The evidence is not clear-cut for all indicators, all countries, and all periods. But, overall, the trend appears to be that entry and exit rates have declined, and pure profits and concentration have gone up. There is no consensus on the implications for productivity. For some, superstar firms can charge high markups and capture higher market shares because they have low marginal costs and are highly productive – this may be good for aggregate productivity (Autor et al. 2020). For others, these profits are rents driven by barriers to entry, leading to lower investment and lower productivity (Gutiérrez and Philippon 2017). To provide an estimate, we use the data and results from Baqaee and Farhi (2020), who decompose total factor productivity into an allocative efficiency and a technology component (where allocative efficiency is driven by the magnitude and heterogeneity of markups). They find that allocative efficiency contributed around half of total factor productivity growth between 1997 and 2014 in the US. We compute that it also contributed to roughly half of its slowdown.
Sixth (and finally), we discuss explanations related to technology. For Gordon (2016), new technologies are not as impressive as technologies from the second industrial revolution, which affected all aspects of human life. For others, such as Brynjolfsson et al. (2021), even if technologies were as transformative as those of the past, substantial complementary investments are necessary before we can reap similar efficiency gains. There are, however, no obvious ways to evaluate the intrinsic value of new technologies compared to those of the past, and we will have to wait for future data to know whether productivity gains will be realised with a lag. It is nevertheless clear that technological change remains a key factor behind current macroeconomic trends and underpins the observed slowdown through various dimensions including measurement, changes in labour markets, a shift toward intangible investment, the integration of global value chains, and changes to allocative efficiency.
In sum, while our summary is subject to caveats discussed in Goldin et al. (2021), we are able to explain the labour productivity slowdown as primarily attributable to a combination of mismeasurement, slowdowns in capital deepening (for cyclical and structural reasons), spillovers from intangibles, trade integration, and the contribution of allocative efficiency. This suggests a number of future research avenues, in particular for exploring the policy implications of our results. While ongoing technological change creates a need for renewed regulatory frameworks, further research is required to allow for the design of specific industrial, competition, trade, and labour market policies to trigger a productivity renewal.
References
Autor, D, D Dorn, L Katz, C Patterson and J Van Reenen (2020), “The fall of the labor share and the rise of superstar firms”, Quarterly Journal of Economics 135(2): 645–709.
Baqaee, D R and E Fahri (2017), “Aggregate productivity and the rise of mark-ups”, VoxEU.org, 04 December.
Baqaee, D R and E Farhi (2020), “Productivity and misallocation in general equilibrium”, Quarterly Journal of Economics 135(1): 105–163.
Bergeaud, A, G Cette and R Lecat (2016), “Productivity trends in advanced countries between 1890 and 2012”, Review of Income and Wealth 62(3): 420–444.
Brynjolfsson, E, D Rock and C Syverson (2021), “The productivity J-curve: How intangibles complement general purpose technologies”, American Economic Journal: Macroeconomics 13(1): 333–372.
Constantinescu, C, A Mattoo and M Ruta (2016), “Why the global trade slowdown may matter”, VoxEU.org, 25 May.
Constantinescu, C, A Mattoo and M Ruta (2019), “Does vertical specialisation increase productivity?”, The World Economy 42(8): 2385–2402.
Corrado, C, J Haskel, M Iommi and C Jona-Lasinio (2020), “Intangible capital, innovation, and productivity à la Jorgenson: Evidence from Europe and the United States”, in B M Fraumeni (ed.) Measuring Economic Growth and Productivity, Amsterdam, NL: Elsevier.
Goldin, I, P Koutroumpis, F Lafond and J Winkler (2020), “Why is productivity slowing down?”, OMPTEC Working paper.
Gordon, R J (2016), The Rise and Fall of American Growth: The U.S. Standard of Living since the Civil War, Princeton, NJ: Princeton University Press.
Gutiérrez, G and T Philippon (2017), “Investmentless growth: An empirical investigation”, Brookings Papers on Economic Activity.
Haskel, J and S Westlake (2018), “Productivity and secular stagnation in the intangible economy”, VoxEU.org, 31 May.
Ilzetzki, E (2020), “Explaining the UK’s productivity slowdown: Views of leading economists”, VoxEU.org, 11 May.
Stehrer, R, A Bykova, K Jäger, O Reiter and M Schwarzhappel (2019), “Industry Level Growth and Productivity. Data with Special Focus on Intangible Assets”, The Vienna Institute for International Economic Studies.
Syverson, C (2017), “Challenges to mismeasurement explanations for the US productivity slowdown”, Journal of Economic Perspectives 31(2): 165–186.


