Editors’ note: The full list of members of the Helsinki Graduate School of Economics Situation Room can be found here.
As never before, the COVID-19 crisis has laid bare the need to have real-time analysis to support policy decisions. While governments do produce, and utilise, such real-time information (e.g. on layoffs, bankruptcies, and tax revenues), the lessons drawn from the data can lead to a scattered picture of the impacts. What seems to be largely missing is the ability to combine different data sources to provide a more accurate and consolidated depiction of the crisis. Micro-level analyses enabled by combining data from multiple sources would offer a much-needed complement to more macro-oriented analyses, such as the ones provided by McKibbin and Fernando (2020) and Gopinath (2020). In a similar vein, micro-data centred information would greatly help in formulating policy responses, whether at micro- or macro-level, by helping to quantify policy prescriptions (e.g. Bofinger et al. 2020).
The lack of rich micro-level data for policy purposes was the case in Finland, despite the country being on par with its Nordic neighbours in terms of having a well-developed system of public registries, an efficient central government, and a long tradition of utilising data matched across multiple registries for academic research. This column reports how Helsinki Graduate School of Economics, through a grass-roots academic effort, in collaboration with the VATT Institute of Economic Research (and the strong support of various government bodies), put together the Helsinki GSE Situation Room. This combined body now provides real-time analysis of the Finnish economy both to the government and to the wider public, as well as aggregate, real-time data for the world to use and analyse. Our reports and data are available online and the data are regularly updated (several times a week). Finland is not alone in possessing such data. Indeed, Norwegian data has already been put to similar use by Alstadsaeter et al. (2020).
The going mode of research relying on registry data across the Nordics is that researchers apply for the right to use the various data, have them pseudonymised by the Statistical Authority, and then use them through a remote-access facility provided by the Statistical Authority. It is no exaggeration to say that the great bulk of empirical research in the social sciences in the Nordics is produced using such data and these facilities.
When the COVID-19 crisis hit Finland in mid-March, we at the Helsinki Graduate School of Economics approached the Finnish Ministry of Finance and offered our help in whatever form they felt might be useful. In particular, we offered our knowledge of various Finnish micro-level data and the experience of using such matched data for purposes of academic research and policy analysis. It quickly turned out that the government, though producing and providing most of the data, did not possess an established capability of collecting data from different sources and putting it to use.
After a quick perusal of possible organisational alternatives, we set up a remote-access research project at Statistics Finland. What makes the Helsinki GSE Situation Room different is that we negotiated access to not just the ‘base registries’ researchers usually have access to, but also to real-time information relating to how the COVID-19 crisis was affecting the Finnish economy. Here are prominent examples of the information we have been able to access at least once a week:
1. Individuals that are furloughed (temporarily laid off) in a given day
2. Individuals that are laid off in a given day
3. Government support decision to firms (which firm, for which purpose, and how much), by day
4. Bankruptcies, by day
5. Various firm-level tax data (delays, tax debts, applications to delay payments), by day
6. Applications by individuals for income support, housing support, and other government social support schemes, by day
7. Wage payments (to whom, by whom, how much, for what task) – the so-called ‘Income Register’, by day
The list of data the Situation Room has access to is still growing. These data have never before been made available at such speed, nor have they been combined in this manner. The Income Register in particular is brand new and has hitherto not been actively used at all.
We are fully aware of the potential privacy issues related to such a data collection exercise (we are granted access to both individual and firm level data which we can then combine). We therefore follow guidelines agreed with Statistics Finland. These are stricter than their usual guidelines. All data are pseudonymised before we get access, and each data provider sends the data directly Statistics Finland. For further guarantee, all members of the Situation Room have either signed very strict Non-Disclosure Agreements or, in the case of VATT Institute of Economic Research researchers, are civil servants. The Ministry of Finance has provided some funding, and we are prepared to look for further funding, were that to become necessary. Until now, given the Finnish COVID-19 regulations, the entire operation has been managed remotely. Besides our internal meetings, we meet with civil servants from several ministries at least once a week and publish our report both on the website and in a webinar the following day (8am on Thursdays, Finnish time).
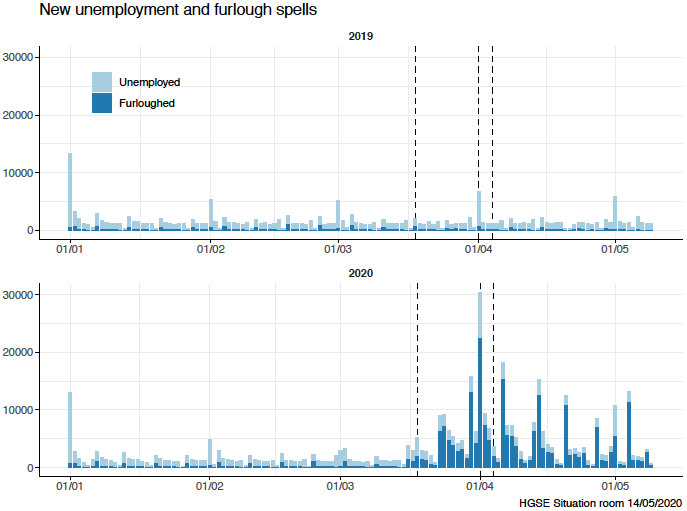
Using the data that we have assembled we found that the Finnish social safety net and government decisions to relax the conditions for furloughing individuals worked well. We see only a modest rise in (permanent) lay-offs across age groups but a steep rise in the number of furloughed workers. Figure 1 illustrates the comparison of workers that have been laid off or furloughed during the period from 01 January to 05 May 2020, against those experiencing a similar fate a year earlier.
Figure 1 New unemployment and furlough spells
Source: HGSE Situation room 14/05/2020
There has been essentially no change in the age composition of laid off workers. The left-hand side of Figure 2 displays the age distribution of laid off men (upper graph) and women (lower graph) in the period 15 March to 05 May 2020, with the red curve depicting the age distribution in 2019, and the blue curve for 2020. The right-hand side of the graph shows the age distribution of furloughed men (upper graph) and women (lower graph). Here we see a clear change. Relatively speaking, more young men (and in particular young women) were furloughed more often in 2020, compared to in 2019.
Figure 2 Age distribution of the unemployed and furloughed (density function).
Note: Spells started between 15 March and 9 May, 2020
Source: HGSE Situation room 14/05/2020
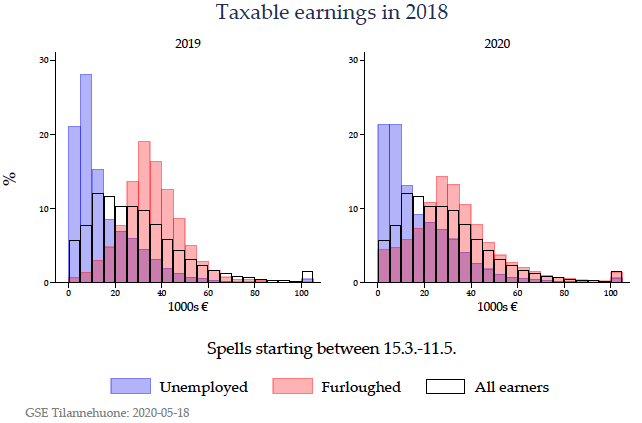
The COVID-19 crisis seems quite ‘democratic’ in how it affects individuals in different income groups. In Figure 3 we compare furloughs and lay-offs across income groups in the period of 15 March to 05 May 2019 and 2020. Income is measured in 2018 terms: median income in Finland in 2018 was €25,000 for those with taxable income. The left-hand graph reveals that in 2019 layoffs and furloughs disproportionately affected individuals in the lower-income groups. The picture that emerges from the right-hand graph for 2020 is very different. It is apparent that low-income groups are less affected, but those earning an annual income of €20,000 or more (including those earning in excess of €100,000 annually) are much more likely to have been furloughed (but not laid off), compared to in 2020.
Figure 3 Taxable earnings in 2018
Source: GSE Tilannehuone 14/05/2020
We can match 98% of the newly furloughed and unemployed individuals to their taxable earnings from 2018 (in the near future, we will be able to do this with more current data). We do this same matching for the newly furloughed and unemployed in the same time period in 2019 and 2020. In this way we provide a ‘back-of-the-envelope’ estimate, suggesting that the combined earnings lost for the newly unemployed and furloughed during April 2020 is about €400 million more than in April 2019. This calculation assumes simply that the total earnings loss of each newly unemployed or furloughed person amounts to 1/12th of their 2018 annual taxable earnings. This amounts to about 5% of the monthly total earnings of Finnish workers.
What makes these data particularly useful is that we can match them to other information on individuals and firms, and across both. For example, this means that we can study what fraction of employees have been furloughed or laid off in a given industry. We depict these results in Figure 4 where we compare ‘March to May’ 2020 to the same period in 2019. The Figure demonstrates that besides “Unknown” (consisting mostly of new firms for which we don’t have yet an industrial classification), it is “Hotels and Restaurants” and “Recreation and Support” services that have furloughed and laid off the largest fraction of their employees. Using these data, we have helped the Finnish government calculate the costs and the expected impacts of different government subsidy schemes for firms.
Figure 4 Newly unemployed or furloughed between 15 March and 11 May
Source: GSE Tilannehuone 14/05/2020
As our research progresses, we are proceeding on three empirical fronts. First, we are standardising the figures and tables we produce with the aim of updating them on a regular basis. Second, we are delving deeper into understanding the impact of government policies. We are about to receive information on all firm subsidies by the government. Lags in the application and granting process may open up possibilities for an analysis of the impact of these subsidies. Third, our medium-term plan is to explore using the data as a basis for studying interactions between the economy and the epidemic. A register of infections will be linked to the main data allowing us, for example, to scrutinise the impact of the occupation closures (and re-openings) on the epidemic. Also, the socio-economic and spatial structure of the data can be an important input to detailed epidemiological models used to simulate the epidemic outbreaks as well as the impact of policy measures during the outbreak.
The Helsinki Graduate School of Economics Situation Room
Jarkko Harju, VATT
Kari Hämäläinen, VATT
Tomi Kyyrä, VATT and Helsinki GSE
Matti Liski, Aalto University and Helsinki GSE
Tuomas Matikka, VATT
Niku Määttänen, Etla and Helsinki GSE
Oskari Nokso-Koivisto, Aalto University and Helsinki GSE
Eero Nurmi, Aalto-University and Helsinki GSE
Satu Nurmi, Statistics Finland
Hanna Pesola, VATT and Helsinki GSE
Jukka Pirttilä, Helsingin University and Helsinki GSE
Marko Terviö, Aalto University and Helsinki GSE
Juha Tuomala, VATT
Jouko Verho, VATT and Helsinki GSE
Juuso Välimäki, Aalto University and Helsinki GSE
Otto Toivanen, Aalto University and Helsinki GSE
References
Alstadsaeter, A, B Bratsberg, G Eielsen, W Kopczuk, S Markussen, O Raaum and K Roed (2020), “The first weeks of the coronavirus crisis: Who got hit, when and why? Evidence from Norway”, NBER working paper 27131.
Bofinger, P, S Dullien, G Felbermayr, C Fuest, M Hüther, J Südekum and B Weder di Mauro (2020), “Economic implications of the COVID-19 crisis for Germany and economic policy measures”, in Baldwin, R and B Weder di Mauro (eds.) Mitigating the COVID Economic Crisis: Act Fast and Do Whatever it Takes, VoxEU.org eBook, CEPR.
McKibbin, W and R Fernando (2020), “The economic effects of COVID-19”, in Baldwin, R and B Weder di Mauro (eds.) Economics in the Time of COVID-19, VoxEU.org eBook, CEPR.
Wren-Lewis, S (2020), “The economic effects of a pandemic”, in Baldwin, R and B Weder di Mauro (eds.) Economics in the Time of COVID-19, VoxEU.org eBook, CEPR.


