According to the NBER business cycle dating committee, the last recession in the US ended in June 2009 (NBER 2013). Three years later US unemployment remains high and most estimates suggest that output remains below potential; a pattern also present in other advanced economies. As a result, central banks have made explicit commitments to keep interest rates at low levels until the recovery is firmly established, referring to a future date when the economy is close enough to ‘normal’.
Despite the interest and policy relevance of measuring and understanding the years that follow a recession, we tend to describe business cycles as the succession of recessions and expansions, without separating the earlier years of an expansion – what we refer to as the recovery – and the later years.
In a newly released CEPR discussion paper (DP 9551) we have produced an explicit analysis of the recovery phase for the US business cycles since 1950. Our approach is based on the original work of Burns and Mitchell that described a multi-phase business cycle that included a revival phase in between the recession and the expansion. We explicitly identify and date this third phase, what we will call the recovery.
Identifying the recovery
We work with a framework that borrows from the academic literature to combine the following elements:
- The growth path of an economy can be described by a long-term trend.
Business cycles are seen as cyclical (transitory) deviations from this trend.
- We think of the trend as the maximum level of output.
This is different from the interpretation of potential output as a ‘sustainable’ level of output in the tradition of measures such as the output gap or the non-accelerating inflation rate of unemployment (the NAIRU). Our notion of trend is similar to that of the Friedman’s plucking model (Friedman 1964).
- Business cycles are asymmetric and driven by negative shocks.
This asymmetry is implicit in the Burns and Mitchell or the National Bureau of Economic Research methodology because of their focus on recessions.1
- After a trough, there is a distinct phase where the economy returns towards normal levels (trend).
This phase is called ‘recovery’.
Defining and dating a recovery phase is a challenge because it requires a definition of what it means to return to ‘normal’ (defined as full employment or trend output).2 The natural choices to measure how close the economy is to potential are variables such as the output gap or the unemployment gap (measured as the deviation of unemployment relative to its natural rate). But the way these variables are typically calculated do not exactly fit a framework of asymmetric cycles. Most estimates of these variables allow for the economy to produce beyond potential or for the unemployment rate to be below its natural rate. And this behavior varies enormously across time, which does not allow for a consistent definition of potential or full employment across different cycles.
Measuring the recovery phase
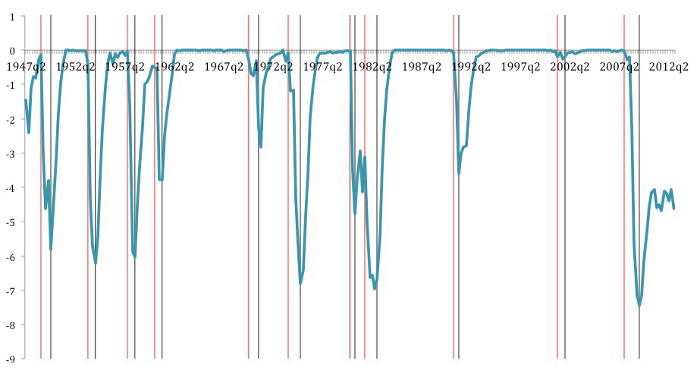
A three-phase description of the business cycle is well captured by models based in the regime-switching models of Hamilton (1989) that include a bounce-back effect such as Kim, Morley, and Piger (2005). This literature also has a very natural connection to both the National Bureau of Economic Research methodology and the plucking model of Friedman. We make use of one of the models developed by Morley and Piger (2012) and estimate it with US data to produce a measure of the cyclical component of GDP (Figure 1).
This simple econometric model fits well our theoretical framework. The estimation assumes that the cyclical component during expansions is zero, matching our idea that at after the bounce back from the recession is over, the economy is close to full employment and growing at a normal rate. This allows for a very clean and consistent interpretation of the cyclical component in Figure 1 as the gap between actual output and a measure of trend output that can be seen as a maximum, a ceiling.
In our analysis we take as given the recession dates as provided by the NBER (identified by the vertical red and grey lines).3 We then define recoveries as the phase in between the end of the recession (grey line) and the moment when the cyclical component of Figure 1 is close enough to zero.
Figure 1. GDP cyclical component
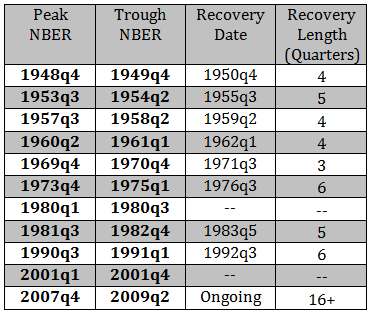
While in our paper we explore several alternative ways to produce these dates, we simply present our preferred ones in Table 1 where we include the peak and trough date from the NBER-identified cycles as well as dates for the end of the recovery phase as produced by our model. We also provide the implied length of the recovery in quarters.
Table 1. Business cycle dates
Notice that the recovery date is blank for the 1980 cycle because there was never a full recovery. For the 2001 recession, we do not include dates for the end of the recovery because our method cannot identify a clear recession-recovery cycle. For the 2007 cycle the recovery is not over. Up to the second quarter of 2013 the recovery is already 16 quarters long.
We find many similarities across all recoveries, which is a welcome feature of our methodology. Early recoveries are all in the range three to six quarters. The 1973 recovery is long, possibly because of the depth of the recession; returning to trend takes longer when activity is further away from its normal state. The 1990 recovery is also special because despite being a shallow and short recession, by historical standards, the recovery is as long or longer than in most of the previous cycles.
The recovery associated to the 2007 recession is a clear outlier. As in 1973, we might expect a longer recovery because of its depth, but we are already 15 quarters into the recovery and it is likely to take still several quarters for it to end. So we are witnessing a cycle where the speed of recovery is significantly slower than any of the previous cycles.
Why recoveries matter? The costs of recessions and recoveries
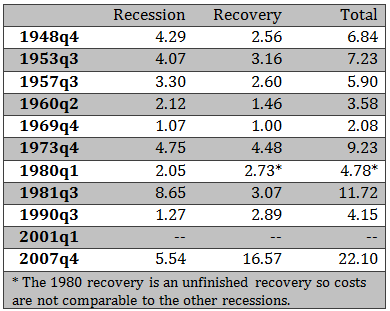
The cyclical phase where output is below potential can be associated with a loss of output and welfare. One interesting application of our recovery dates is to use them to calculate and compare the cost of recessions and recoveries. We measure the cost as the accumulated loss of GDP during the quarters where we are below potential (and it is expressed as measured as a percentage of the annual GDP at the peak). We decompose in Table 2 the costs of all US crises for the two phases: recessions and recoveries.
Table 2. Cost of recessions and recoveries (% previous peak annual GDP)
Business cycles are costly. Total output loss can be as high as 22% of annual GDP (and this is for a recovery that is not over yet, the cost above uses data up to the last quarter of 2012). Two recessions stand out as very costly: the 1981 and 2007 recessions. The 1981 cost is mostly due to its depth, not so much its length. In the 2007 case it is a combination of depth but also of length.
The second interesting fact that we learn from this table is that a large portion of the costs of business cycles can be attributed to the recovery phase. Furthermore, in the last few cycles the recovery phase bears an increasing portion of these costs. In the earlier recessions, the cost of recoveries is similar or lower than that of the recession. This is coming from the fact that, as we have shown earlier, the recovery phase was quick (as quick or quicker than the recession).
The 1973 cycle stands out as a costly one but the losses are evenly distributed between the recession and recovery phase. The 1981 cycle is associated with a very costly recession but with a very quick and ‘low-cost’ recovery. In more recent cycles, 1990 and 2007, the cost of the recovery is significantly larger than the cost of the recession phase. In 2007 the costs of the slow recovery are already more than three times the costs of output lost during the recession phase.
Conclusions
Business cycles are clearly richer phenomena than a set of dates that define the turning points of an economy. But if we are going to use those dates as a reference to characterise the recession and expansion phase of a cycle, we believe that there is the need to analyse separately the earlier years of the expansion. This is when the economy regains what was lost during the recession. If recoveries where simply a mirror image of the recession phase, understanding the recession might give us enough information about the full consequences of a crisis. But our analysis of US cycles indicates that this is not the case and that the pattern of recession/recovery has changed over time with recent longer recoveries relative to the length of recessions.
References
Friedman, Milton (1964), "Monetary studies of the national bureau", The National Bureau Enters Its 45th Year 44, 7–25.
Hamilton, James D (1989), "A new approach to the economic analysis of nonstationary time series and the business cycle", Econometrica: Journal of the Econometric Society 57, 357–384.
Kannan, Prakash, Alasdair Scott, and M Terrones (2009), "From recession to recovery: How soon and how strong?", World Economic Outlook, 103–138.
Kim, CJ, and C Nelson (1999), "Friedman’s plucking model of business fluctuations: tests and estimates of permanent and transitory components", Journal of Money, Credit and Banking 31, 317–334.
Kim, Chang-Jin, James Morley, and Jeremy Piger (2005), "Nonlinearity and the permanent effects of recessions", Journal of Applied Econometrics 20, 291–309.
Morley, J, and J Piger (2012), "The asymmetric business cycle", Review of Economics and Statistics 94, 208–221.
NBER (2013), "US Business Cycle Expansions and Contractions", website.
Neftci, Salih N (1984), "Are economic time series asymmetric over the business cycle?", The Journal of Political Economy, 307–328.
Sichel, Daniel E (1993), "Business cycle asymmetry: a deeper look", Economic Inquiry 31, 224–236.
1 There are many papers in the academic literature that have studied asymmetric business cycles. For example, Neftci (1984) or Sichel (1993).
2 Some have defined a recovery phase as the period of time it takes for GDP to reach its previous peak (see Kannan, Scott, and Terrones (2009)). But peak GDP is not a good measure of returning to normal because it ignores the growth of the trend, which occurs even when the economy is in a recession.
3 Interestingly, there is a nice match between the cyclical GDP component of Figure 1 and the way business cycles are described in the NBER methodology.


