The media is full of stories of how red tape stifles innovation. However, there is not really a coherent economic framework for thinking rigorously about this issue, let alone quantifying the magnitude of regulatory effects on the aggregate economy.
There is suggestive evidence to think that regulations matter. For example in France, before 2018, when a firm reached 50 employees, it faced a veritable tsunami of labour laws including, among other things, establishing a works council, devoting a minimum fraction of revenue to training, forming a social plan with the labour ministry if it wanted to collectively dismiss workers, and instituting a profit-sharing plan with workers. All these may be desirable benefits, but they are also likely to have some costs.
Firms’ size and their innovation
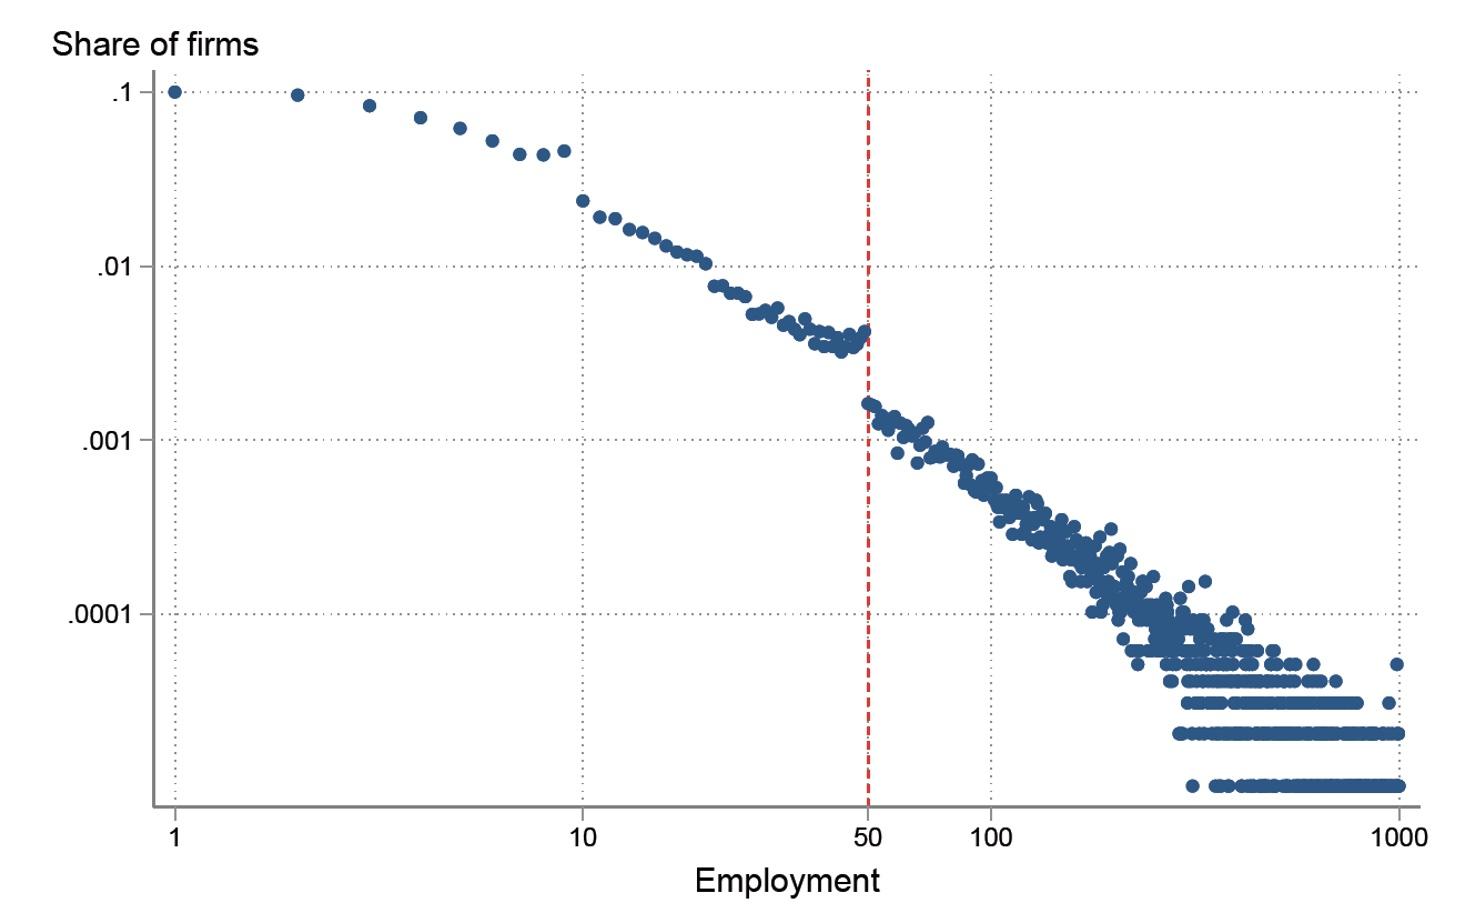
It is well documented that, unsurprisingly, there is a bulge in the number of firms with between 45 and 49 employees who appear reluctant to grow to 50 or beyond (e.g. Ceci-Renaud and Chevalier 2011). Figure 1 shows the power law which describes the relationship between the size of firms and the number of firms which is usually linear in the logarithmic scale. In France, this firm size power law breaks down precisely around this regulatory threshold with a bulge in the number of firms before 50 employees and a shift down in the line afterwards.
Figure 1 The French firm size distribution breaks at 50 employees
Notes: The share of all firms in the economy by firm size (as measured by numbers of employment) in 2000. Note that there are also some regulations that kick in when firms reach 10 employees.
Source: FICUS (see Garicano et al. 2016 for a discussion on size distribution across different data sources).
Discouraging productive firms from becoming larger is one ‘static’ effect of regulation. However, a deeper more dynamic problem might be that firms may be reluctant to invest in growth enhancing innovations when they face these higher regulatory taxes. Furthermore, even larger firms face this tax on growth, causing them to potentially invest less in R&D.
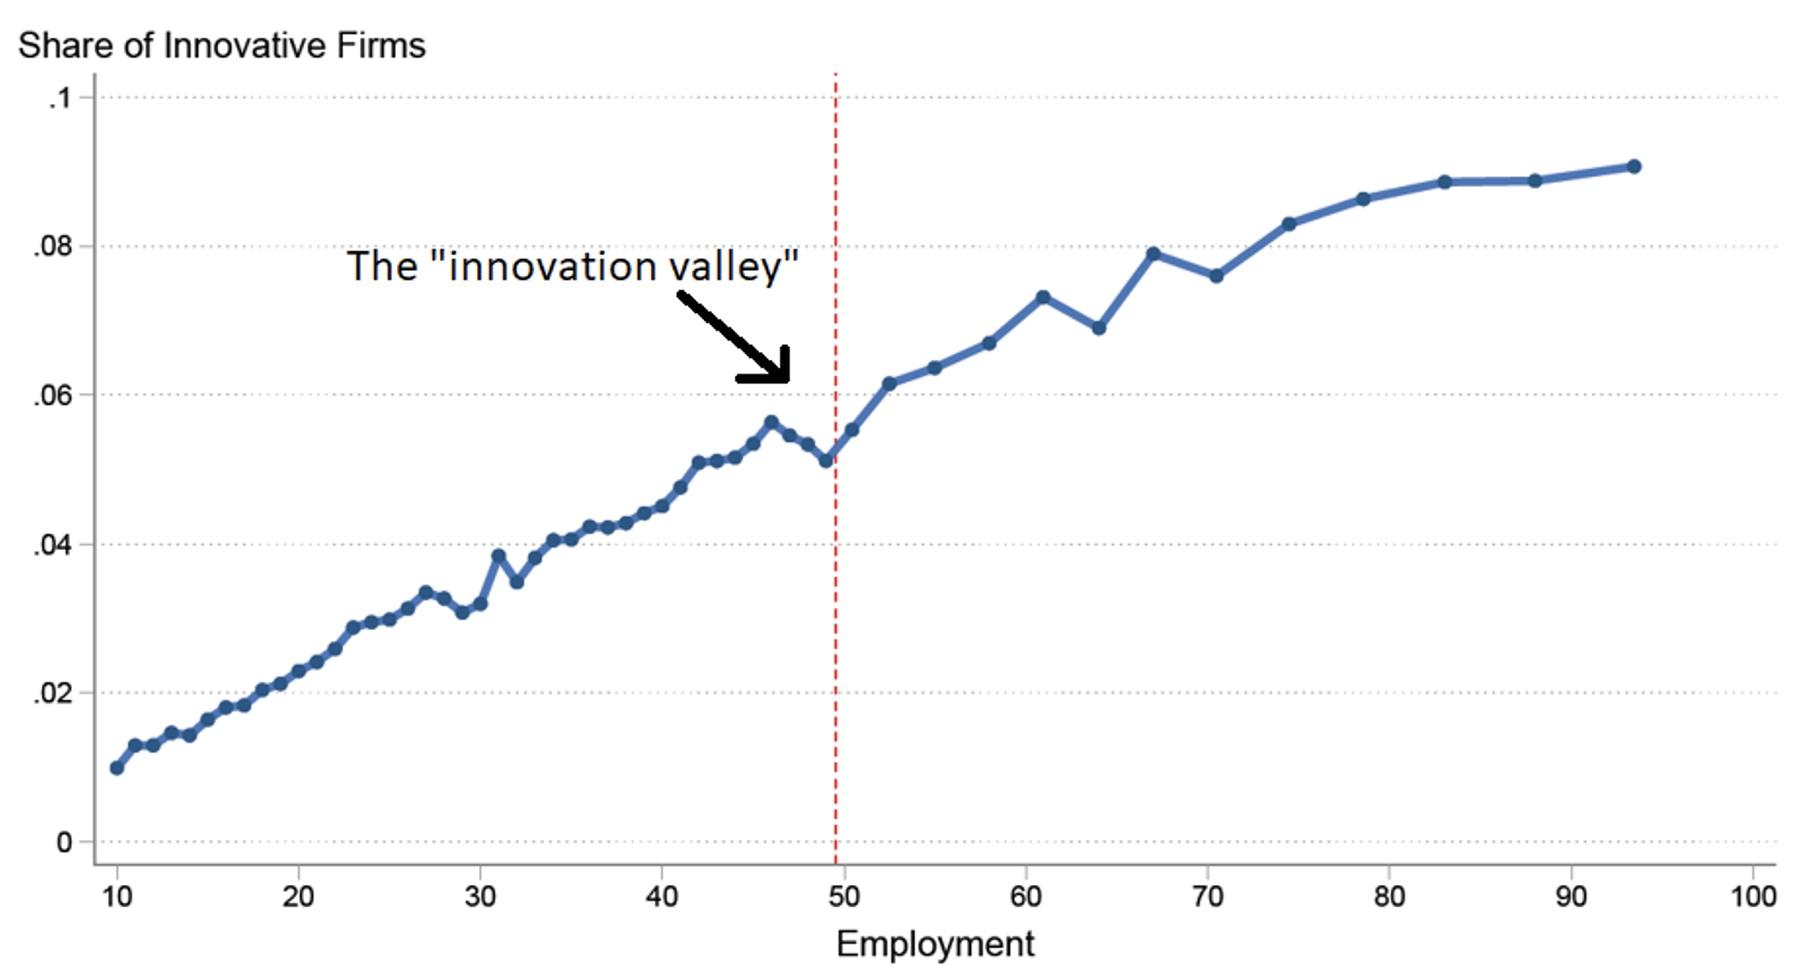
Figure 2 shows that these innovation effects might be happening in the data. The probability of innovating increases with firm size, but there is an ‘innovation valley’ just before 50 employee firms consistent with a discouraging effect. Moreover, the gradient of the innovation-size relationship flattens after 50 employees, also suggesting a regulatory tax.
Figure 2 The innovation-firm size relationship has a ‘valley’ around the regulatory threshold
Notes: An innovative firm is defined as a firm with at least one patent.
Source: Aghion et al. (2021) for this and other definitions of innovation.
Dynamics
We formalize this notion in a Schumpeterian growth model with heterogeneous firm size (Klette and Kortum 2004, Aghion et al. 2014). Firms grow by improving upon existing product lines, thereby evicting the incumbent producers and replacing them on those lines. Hence, firms are in constant danger of being creatively destroyed by a new entrant or an existing rival on any product line they currently control, in which case they shrink by losing the product line. We then look at the effects of introducing a size-contingent regulation on firms’ R&D investments and on the firm size distribution in steady-state equilibrium. The model delivers exactly the kind of relationships we observe in Figures 1 and 2.
Our model also predicts that firms will respond very differently to demand shocks. Exogenous increases in demand (coming say, from an expansion in firms’ export markets, for example) will tend to raise R&D investments as firms’ rents from innovating increase accordingly. However, firms to the left of the regulatory threshold will respond much less, as they will gain less from innovation due to the regulation. This impact will be particularly strong for incremental innovations rather than radical innovations. The intuition is that if a company wants to innovate and pay the regulatory cost of moving beyond the 50 employee threshold, it may as well ‘go large’ and swing for the fence. Moving slightly, say from 49 to 51 employees, is unlikely to make the R&D cost worthwhile.
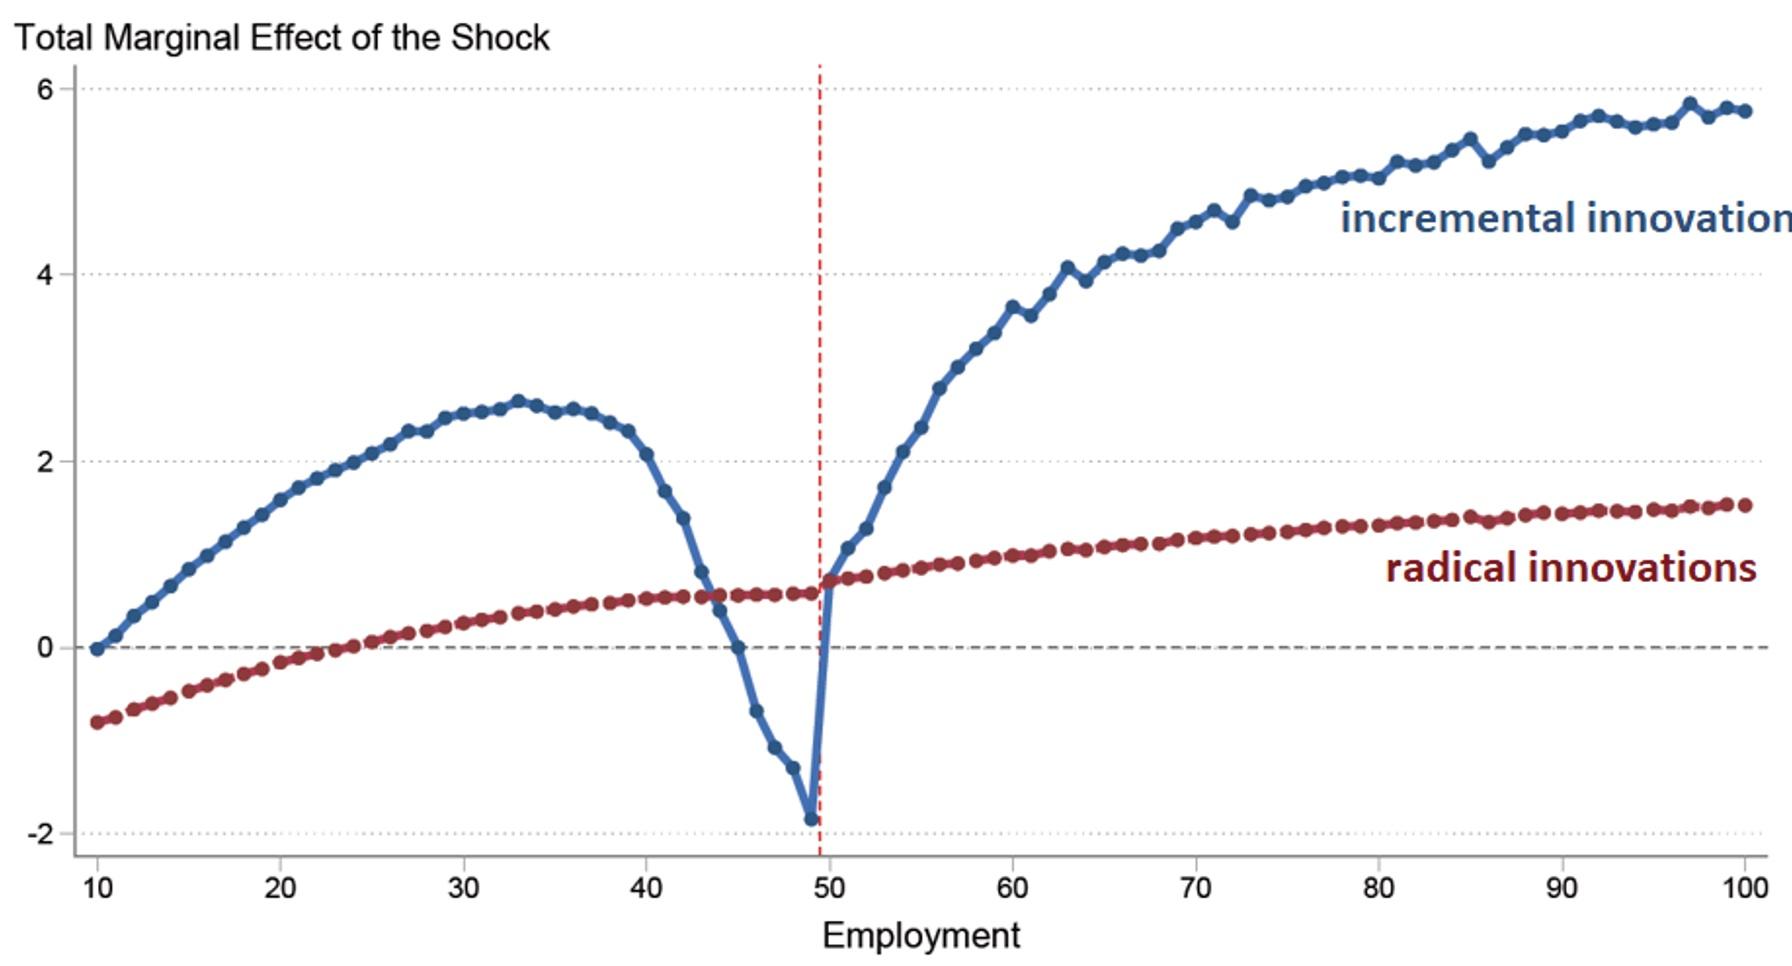
We find exactly this pattern in the data. Figure 3 shows the impact of a market size shocks on the incentive to innovate. For incremental innovation, as measured by low future citations, there is a large discouragement effect near the threshold. For radical, highly cited patents there is no effect. We show that the same is true if we use a measure of novelty of the patent based on a machine-learning algorithm as applied to the text of the patent (based on Kelly et al. 2018). Moreover, the cross-sectional patterns in Figure 2 are all driven by incremental rather than radical innovation.
Figure 3 The impact of a demand shock on innovation as a function of firm size
Note: These are the estimated marginal effect of a demand shock (as measured by growth in a firm’s export market at the HS6 product by country level) on innovation by the size of the firm (as measured by employment). Radical Innovations are defined as patents who are in the top decile of future citations in the technology class-year cohort. Incremental innovations are all other (the bottom 90% of the citation distribution.
Source: Aghion et al. (2021)
Macro innovation and growth
Having shown that the qualitative implications of the model hold up, we then use the structure of the model to quantify the aggregate effect of regulation on innovation. This requires more assumptions, but the framework enables us to quantify the entire equilibrium impact through the innovation intensity and the firm size distribution. Compared to an unregulated benchmark, our baseline model estimates that regulations reduce innovation and growth by 5% (e.g. from 2% to 1.9% per annum) and welfare by about 2%. These numbers need to be added to the standard static misallocation losses other work has focused on (e.g. Garicano et al. 2016).
Policy conclusions
Our analysis should not be taken to mean that regulations are all bad. We have ‘priced out’ the costs, but there could still be net benefits if society values job security extremely highly, for example. However, our findings do suggest the usual estimates of regulatory costs are understated when we ignore innovation. They also suggest that reforms to current regulations may have greater benefits than was previously thought.
References
Aghion, P, U Akcigit and P Howitt (2014), “What do we learn from Schumpeterian growth theory?”, Handbook of Economic Growth 2: 515-563.
Aghion, P, A Bergeaud and J Van Reenen (2021), “The Impact of Regulation on Innovation”, CEPR Discussion Paper 15743.
Ceci-Renaud, N and P A Chevalier (2011), “L’impact des seuils de 10, 20 et 50 salariés sur la taille des entreprises Françaises", Economie et Statistique 437 : 29–45.
Garicano, L, C Lelarge and J Van Reenen (2016), “Firm size distortions and the productivity distribution: Evidence from France”, American Economic Review 106(11): 3439-79.
Kelly, B, D Papanikolaou, A Seru and M Taddy (2018), “Measuring technological innovation over the long run”, NBER working paper w25266.
Klette, T J and S Kortum (2004), “Innovating firms and aggregate innovation”, Journal of Political Economy 112(5): 986-1018.


