Governments use tax incentives to encourage firms to invest in R&D (OECD 2017), but policymakers fret that firms may respond to fiscal incentives for R&D by relabelling non-R&D expenses as R&D. This concern is present in developed countries (GAO 2009), but is likely to be more severe in developing economies (Bachas and Soto 2015, Best et al. 2015).
In a recent paper, we measure real and relabelling responses to tax incentives for R&D in China (Chen et al. 2018) and create a model of the extent to which relabelling behaviour affects the fiscal cost to the government of increasing real R&D. By accounting for the effects of fiscal incentives for R&D on real and relabelling activity, we are able to estimate more precisely how real R&D influences the productivity of Chinese firms. We also measure the government’s trade-off between lower tax revenues and encouraging real investment in R&D.
Notches for R&D in China
Transitioning the source of economic growth from production to innovation is a central goal of the Chinese government (Wei et al. 2017). To achieve this, the government’s InnoCom programme provides large corporate income tax cuts to firms that invest in R&D. For instance, before 2008, a firm with R&D greater than 5% of sales would qualify for a reduction in the corporate income tax rate from 33% to 15%. This means that the value of the firm has a 'notch' – a discontinuous jump – when R&D reaches 5% of sales. Firms therefore have an incentive to report R&D above the threshold prescribed by the policy. They can achieve this either by increasing real R&D or by relabelling other expenses as R&D.
We use changes in the programme’s eligibility requirements and corporate tax returns of Chinese firms to measure how firms respond to this programme. After 2008, the programme’s required level of R&D became size-dependent. Large firms need an R&D intensity of 3%, medium firms 4%, and small firms 6%.
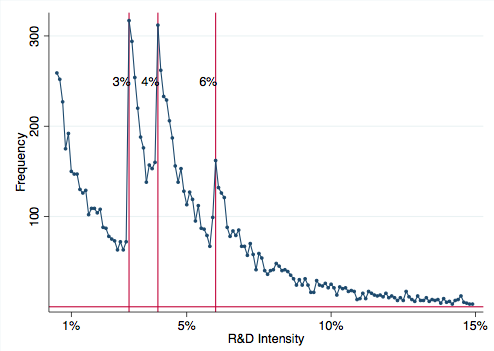
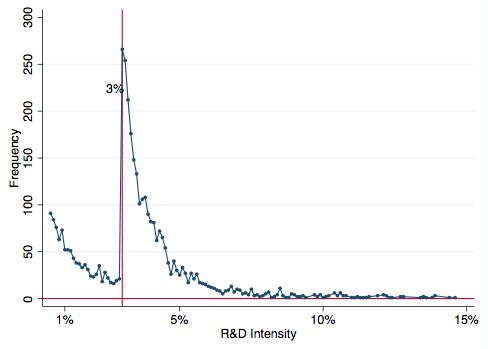
Panel A of Figure 1 shows that firms bunching at the R&D intensity values corresponding to InnoCom thresholds. Panel B shows that when we restrict the sample to only include firms in the large sales category, we only see bunching at 3% of R&D intensity.
Figure 1 Bunching at thresholds of R&D intensity in 2012
Panel A
Panel B
Source: Chen et al. (2018).
Quantifying firm responses to R&D notches
We use a bunching estimator (Kleven 2016) that is new in the R&D literature to quantify the increase in R&D investment, and find that the tax cut led large firms to increase their reported R&D investment by 31% in 2012. However, this increase may be due to real investment, or just to relabelling of non-R&D expense.
Measuring hidden behaviour, such as misreporting of expenses, is always difficult. Nonetheless, the institutional setting and the high quality of the tax data allow us to measure the most likely avenues for relabelling. Institutional data, such as third-party reports from the value-added-tax (VAT) system and pre-audits from the InnoCom programme, mean we could rule out forms of misreporting such as complete evasion and phantom expenses. In Chinese accounting standards, R&D is reported as a subcategory of administrative expenses, and so the most likely form of misreporting would be the relabelling of expenses in this category. This was also confirmed in interviews with the financial controllers of large Chinese firms.
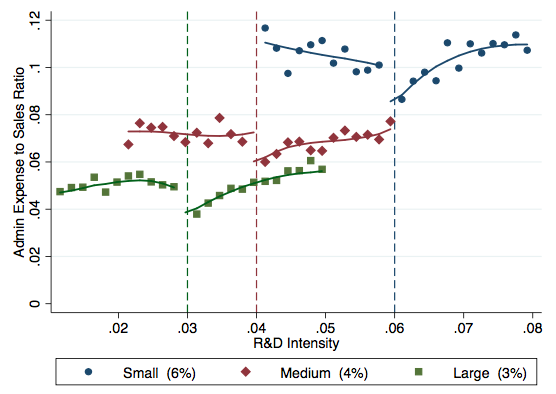
Figure 2 shows empirical evidence of this form of misreporting. It plots the average value of the administrative-expense-to-sales ratio as a function of R&D intensity. For the three types of firms, we find that the admin-to-sales ratio drops significantly at the respective notches. This is consistent with a significant relabelling response.
Figure 2 Empirical evidence of relabelling
Source: Chen et al. (2018).
We quantify this drop using an estimator of causal effects for notches (Diamond and Persson 2016), and find that a significant fraction of the reported increase in R&D investment is due to relabelling. We also found statistically significant increases of 0.9% in profitability and 1.2% in productivity.
Modelling the real and relabelling behaviour of the firm
This implies that Chinese firms respond to the InnoCom programme by increasing reported R&D, but that some of this response may not be represent real investment. Increases in firm productivity, however, imply that the policy does lead to increases in real investment.
We estimate a structural model of R&D investment in which firms face heterogeneous adjustment costs of investment. They may respond to the tax cut by relabelling. Using this model, we can reconcile the effects on reported R&D, relabelling, and productivity, Our model estimation follows a simulated method-of-moments framework in which we simulate a large number of firms and match their predicted behaviour to reduced-form moments in the data.
Specifically, we match observed R&D intensity, the increase in reported R&D that is due to the programme, other moments that capture the extent of relabelling, and the effects of the program on firm-level productivity.
The model allows us to measure the average effect of real R&D on firm productivity. We find that the real effects on firm productivity are consistent with return to real R&D of about 9.8%.
The model also shows that about 30% of the increase in reported R&D is due to relabelling. The degree to which individual firms relabel depends on their productivity, and on their firm-specific costs of adjustment. This is because firms with lower productivity and higher adjustment costs have stronger motives for relabelling.
How does relabelling affect the fiscal cost of R&D incentives?
Policymakers want to encourage real R&D investment at the lowest fiscal cost possible. We characterise this trade-off, as well as the mechanisms that drive it, using our estimated structural model. Specifically, we are able to simulate different versions of the InnoCom program that vary the location of the notch and the size of the tax.
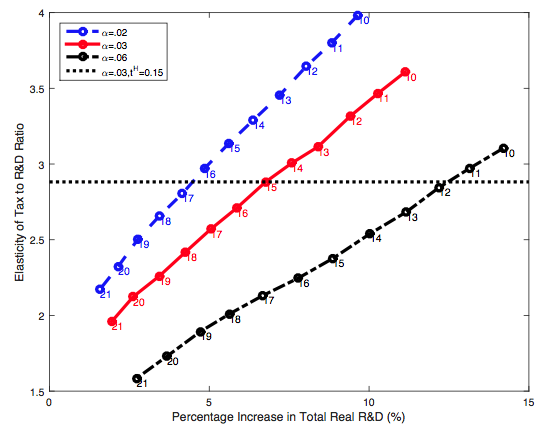
Figure 3 plots the average cost elasticity of increasing real R&D for different combinations of the tax rate, and the location of the notch. The red line holds the notch at 3% and shows that the average cost elasticity increases as the preferential tax rate goes down to 10%. In contrast, the black line shows that with a notch of 6%, and a tax rate of 12%, the government can achieve a similar average cost elasticity while doubling the increase in real R&D.
Figure 3 Fiscal cost of increasing real R&D
Source: Chen et al. (2018).
These simulations show that firm selection and relabelling play crucial roles in determining the cost-effectiveness of this type of R&D subsidy. Policies that lead to greater increases in aggregate R&D also tend to select firms with lower productivity and higher adjustment costs. Selection and relabelling also interact in important ways. Specifically, a larger tax break encourages firms with lower technological opportunities to participate, and these firms also have greater motives for relabelling. This makes the policy less effective. It also increases the cost to the government of increasing real R&D.
Our research shows that accounting for real and misreporting behaviour is crucial if we want to measure the real returns to R&D or to characterise the fiscal costs of encouraging real R&D investment. This has broader implications for economic growth, because recent research suggests that misreporting of R&D implies a declining contribution of R&D to economic growth (König et al. 2018).
References
Bachas, P and M Soto (2015), Not(ch) Your Average Tax System: Corporate Taxation Under Weak Enforcement, technical report, UC Berkeley.
Best, M C, A Brockmeyer, H J Kleven, J Spinnewijn, and M Waseem (2015), “Production versus Revenue Efficiency with Limited Tax Capacity: Theory and Evidence from Pakistan", Journal of Political Economy 123(6): 1311–1355.
Chen, Z, Z Liu, D Y Xu, and J C Suarez Serrato (2018), “Notching R&D Investment with Corporate Income Tax Cuts in China,” NBER Working Paper 24749.
Diamond, R and P Persson (2016), The Long-term Consequences of Teacher Discretion in Grading of High-Stakes Tests, technical report, Stanford University.
GAO (2009), The Research Tax Credit’s Design and Administration Can Be Improved, technical report, Government Accountability Office.
Kleven, H J (2016), “Bunching", Annual Review of Economics 8: 8435–464.
König, M, K Storesletten, Z Song, and F Zilibotti (2018), From Imitation to Innovation: Where is all that Chinese R&D Going?, technical report.
OECD (2018), Measuring Tax Support for R&D and Innovation.
Wei, S-J, Z Xie, and X Zhang (2017), “From 'Made in China' to 'Innovated in China': Necessity, Prospect, and Challenges", Journal of Economic Perspectives 31(1): 49–70.


