Interest in resilience has been rising rapidly among policymakers over the last twenty years as a response to increasing uneasiness about potential shocks that test the limits of coping capacities of both individuals and societies. In all likelihood, such shocks will keep emerging and will present continuous challenges around the world, from the digital transformation to food security.
International policy organisations have taken the lead on responding to these challenges. The EU, for example, has produced several declarations and policy documents lately identifying resilience as a primary policy objective (e.g. the Council of the EU’s Rome Declaration, the European Commission’s Reflection Paper on Harnessing Globalisation, or the April 2018 issue of the Quarterly Report on the Euro Area). Other international organisations (such as the G20, the IMF, the ECB, and the OECD) have also made a concerted effort to understand the drivers of resilience – and economic resilience in particular – and design policies promoting it. Examples include G20 (2017), IMF (2016), ECB (2016), Sondermann (2016), Sutherland and Hoeller (2014), and Caldera-Sanchez et al. (2016).
To render this concept a truly effective policy tool, the Joint Research Centre (JRC) of the European Commission has started work to broaden the traditional perspectives associated with resilience, and to provide a common definition and unified approach to its measurement. The first result of these efforts was the development of a conceptual framework that describes a resilient society as one that can respond to shocks and persistent structural changes in such a way that it does not lose its ability to deliver societal well-being in a sustainable way(Manca et al. 2017). By taking a disaggregated and systemic view of society, and identifying different resilience capacities (absorption, adaptation, and transformation) depending on the duration and intensity of distress, the JRC framework intends to break the silos of sectoral approaches, and eventually enable the monitoring of resilience.
In a recent paper, we present a next step of this agenda by studying the response of EU member states to the 2007–2012 Global Crisis (Alessi et al. 2018). In particular, we investigate which countries showed resilience during and after the crisis, and attempt to identify characteristics that are associated with resilient behaviour.
Measuring societal resilience
As far as methodology is concerned, we use the recent financial and economic crisis as a unique natural experiment to provide identification for measuring resilience. Assuming that the crisis was a single exogenous event hitting all EU member states the same way is clearly a simplification. Yet, this can be justified by arguing that it is difficult to separate shock exposure and shock absorption empirically, and that a reasonable measure of resilience should account for vulnerability and resistance alike.
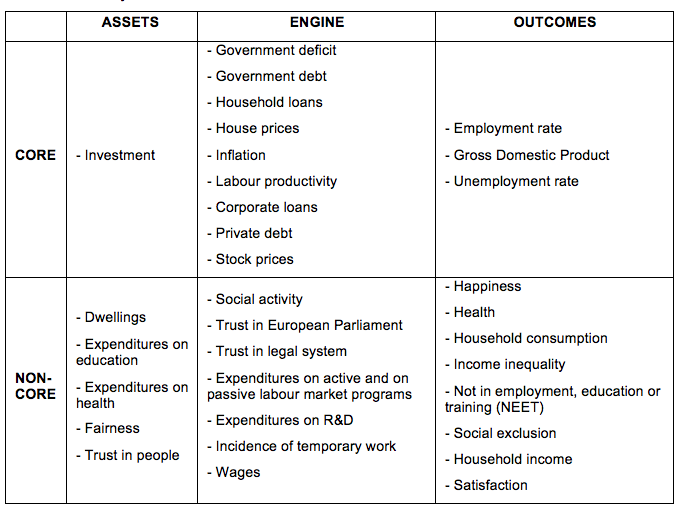
To capture all relevant aspects of societal wellbeing, we jointly consider a large set of diverse variables that are available on a cross-country basis, and have exhibited substantial variation during the post-crisis period. Drawing on a varied list of sources (e.g. from established macro-level indicator sets such as the Europe 2020 targets to micro-level population surveys such as the EU-SILC, the European Quality of Life Survey, or the European Social Survey), we ultimately selected 34 system variables. These may be differentiated according to which part of the system they represent (assets, a broadly defined production technology called the engine, or outcomes) and whether they are core economic or broader, primarily social constructs, to provide us with a more nuanced picture about resilient behaviour (see Table 1 for the full list).
Table1 List of system variables
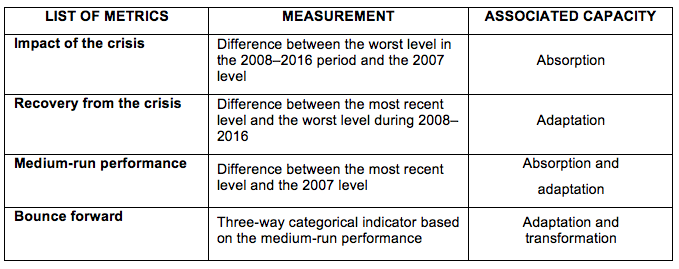
Resilience itself is measured based on the dynamic response of the system variables to the crisis at different time horizons. In particular, four different resilience metrics are defined, each corresponding to a different resilience capacity, as Table 2 shows.1
Table 2 Resilience metrics and their measurement
Our first three metrics are standardised z-scores, to ensure comparability across variables and to emphasise the relative performance of countries vis-a-vis one another.2 Conversely, the bounce forward metric is categorical and measures medium-run resilience in absolute terms. In particular, a country bounces forward if it already surpassed its pre-crisis performance, is still to recover if it distinctly underperforms, and is considered just recovering in every other case.3 When aggregated across the 34 system variables, these metrics lead to four different resilience indicators that serve as handy summary statistics to describe the overall dynamic behaviour (and thereby the resilience) of the whole socio-economic system.4
Resilience performance of European countries
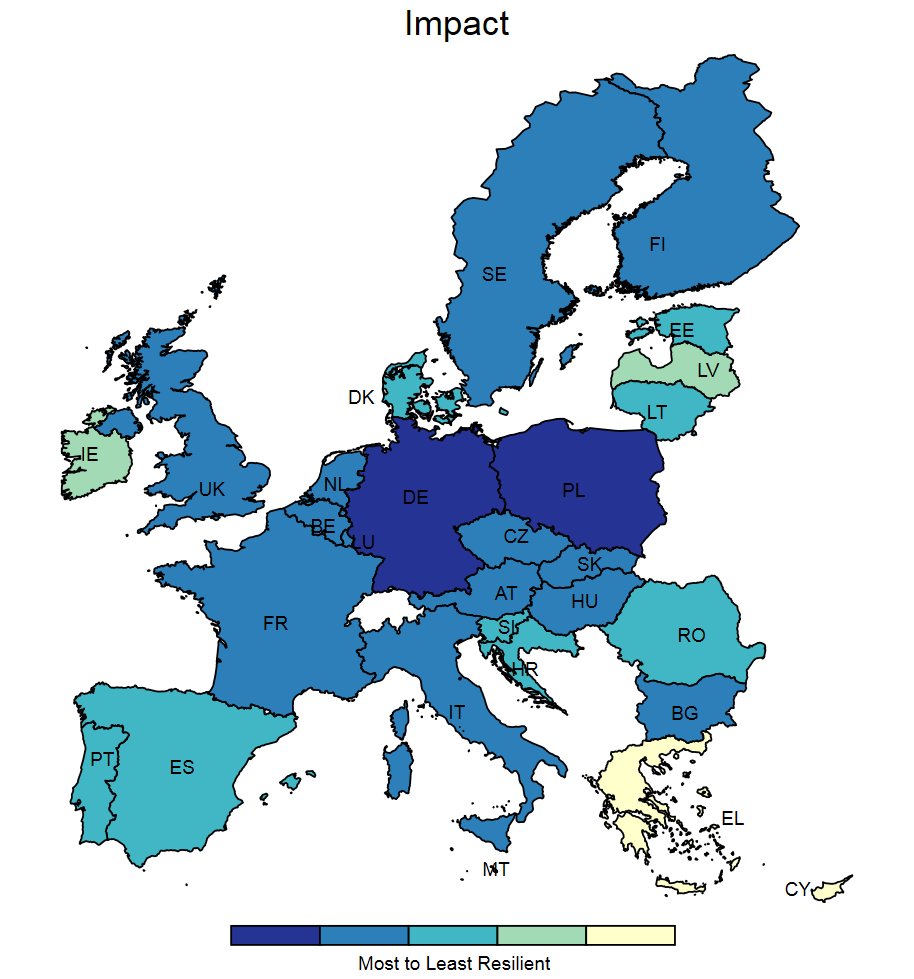
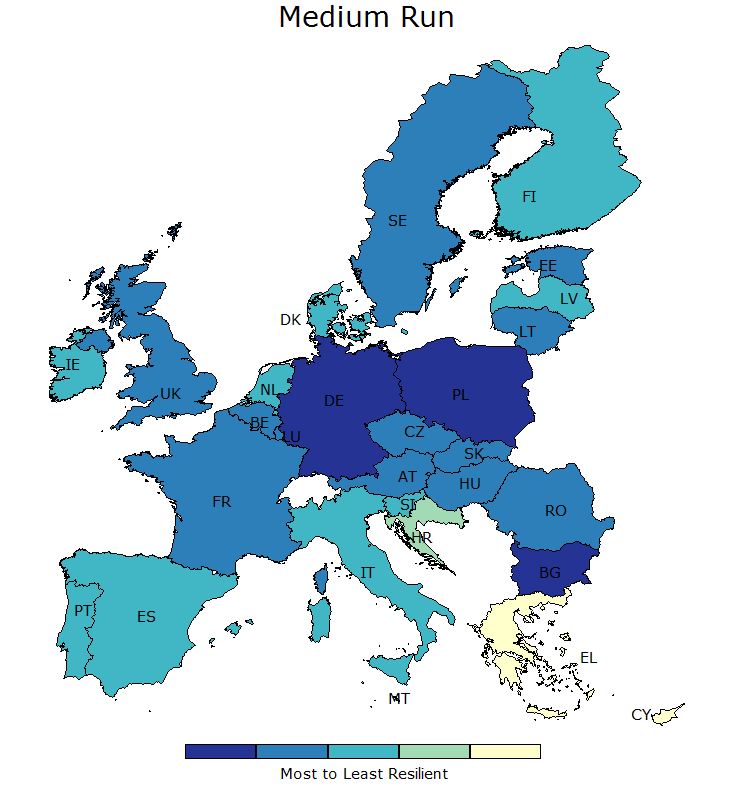
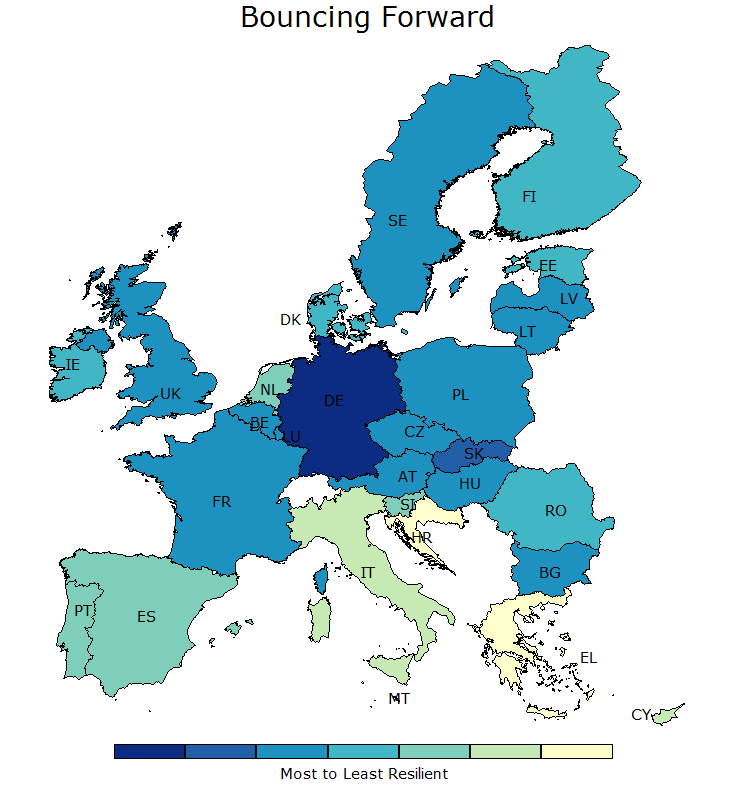
When focusing our attention on these resilience indicators, several important results emerge (see Figure 1).
- First, there is a great deal of heterogeneity in resilience across European countries. Regardless of which resilience capacity is considered, there is a substantial difference (of several standard deviations) between the more and the less resilient. Bulgaria, Germany, Malta, and Poland are among the most consistently resilient countries, while Cyprus, Greece, and Italy have found it most difficult to deal with the crisis.
- Second, the resilience performance of most countries depends crucially on the indicator of reference. Countries that are more resilient in the short-run are not necessarily the ones recovering better later on.5 This is nicely demonstrated by the examples of a stagnant (low-impact, low-recovery) Italy and a roller coaster (high-impact, high-recovery) Ireland, with comparable medium-run performance.
- Third, performing well relative to other countries does not necessarily imply being resilient in absolute terms. Despite the high statistical association between the bouncing forward and medium-run indicators, some countries clearly perform better when their own pre-crisis performance is considered the reference point. This is true for Slovakia, while Spain is a counter-example.
Our analysis also reveals a substantial cross-country divide as far as the nature of resilience is concerned. When performance is assessed for the different parts of the system (assets, engine, outcome), or distinguishing between the economic and social dimensions (not shown here), resilience turns out to be rather uneven in many cases – for medium-run resilience, Luxembourg and Finland perform relatively favourably in terms of assets, Estonia and Greece in engine, and Poland and Romania in outcomes. Moreover, the resilience performance computed only based on the core set of economic/financial variables would for example be superior in the case of Hungary and Malta, but even more modest in Portugal or Spain.
Figure 1 Resilience of EU member states to the crisis by indicator
Panel A. Impact
Panel B. Recovery
Panel C. Medium run
Panel D. Bounce forward
Notes: Shades of blue, green and yellow indicate high, medium and low resilience, respectively. Malta is light blue on impact (0.215), recovery (0.551) and bounce forward (0.333), and blue in medium-run resilience (0.699).
Resilience characteristics
Once European countries’ resilience performance is observed, it becomes an immediate policy objective to identify robust, significant, and meaningful predictors of resilient behaviour at the country level. Our exercise does not intend to analyse specific policy tools directly utilisable in a crisis. Instead, we want to capture some pre-determined features, be they policy-related or deep-seated, that signal (and enable) a resilient reaction of a country in periods of distress. In other words, we want to assess the strength of a country’s ‘ability to act’ in case of difficulties. Such characteristics could eventually form a dashboard for monitoring resilience.
As a preliminary analysis in this direction, we collected data on a large pool of potential resilience characteristics of the most diverse kind, from indicators of life quality, through macroeconomic policies, to digital transformation. The main sources were the World Economic Forum’s Global Competitiveness Index database and Eurostat. Around 200 of these were used in a simple statistical analysis consisting of univariate and bivariate regressions, whereby the resilience indicators were regressed on pre-determined, multi-year averages of these characteristics, during the pre-crisis or the early crisis periods.
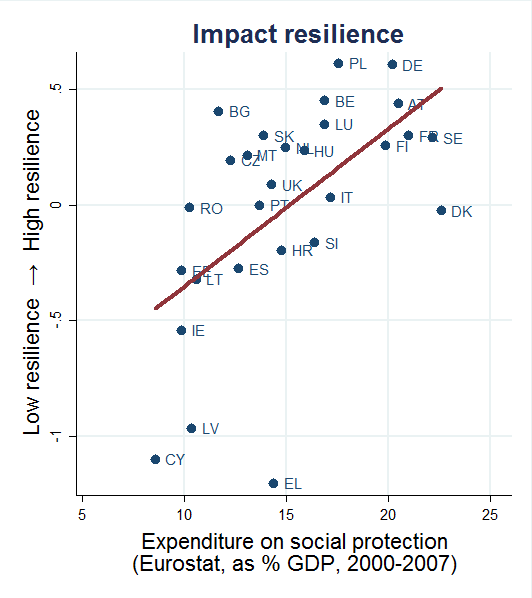
Figure 2 shows the performance of the characteristics that produced the highest univariate goodness-of-fit associated with each resilience indicator.[6]With healthy caution, these results point to the importance of social expenditures, political stability, and competitive wages for promoting good performance as far as impact, medium-run, and bounce forward resilience are concerned, respectively. To provide sufficient support for including such variables in a resilience dashboard, we have started to extend our analysis to more historical economic downturn episodes, and to the regional level.
Figure 2 Country characteristics most closely associated with resilient behaviour
Notes: The coefficient of determination in the three univariate cases presented are 0.30, 0.18 and 0.28, respectively. The coefficient estimates are statistically different from zero at the 1% significance level in all cases. The parenthesis next to the resilience characteristics denotes the relevant data source and time period. Political stability measures perceptions of the likelihood that the government will be destabilised or overthrown by unconstitutional or violent means, on a scale form -2.5 (weak) to 2.5 (strong). Perceptions of productivity-aligned wages measures the extent to which pay is perceived to be related to employee productivity, on a scale from 1 (not at all) to 7 (to a great extent).
Authors’ note: The views expressed in this column are those of the authors and should not be attributed to the European Commission.
References
Alessi L, P Benczur, F Campolongo, J Cariboni, A R Manca, B Menyhert and A Pagano (2018), “The resilience of EU Member States to the financial and economic crisis. What are the characteristics of resilient behavior?”, JRC Science for Policy Report, JRC111606.
Caldera-Sanchez, A, A de Serres, F Gori, M Hermansen and O Röhn (2016), “Strengthening economic resilience: Insights from the post-1970 record of severe recessions and financial crises,” OECD Economic Policy Papers 20.
European Central Bank (2016), “Increasing resilience and long-term growth: The importance of sound institutions and economic structures for euro area countries and EMU", Economic Bulletin, Issue 5.
European Commission (2018), Quarterly Report on the Euro Area17(1), European Economy Institutional Paper 76.
G20 (2017), “Note on Resilience Principles in G20 Economies”.
International Monetary Fund (2016), “A macroeconomic perspective on resilience,” Note to the G20.
Manca A R, P Benczur and E Giovannini (2017), “Building a scientific narrative towards a more resilient EU society,” JRC Science for Policy Report, JRC28548.
Sondermann, D (2016) “Towards more resilient economies: The role of well-functioning economic structures,” ECB Working Paper Series 1984.
Sutherland, D and P Hoeller (2014), “Growth policies and macroeconomic stability,” OECD Economic Policy Papers 8.
Endnotes
[1] The commonly used (narrow) definition of economic resilience (as advocated in G20 2017, IMF 2016, EC 2018) uses a similar though markedly different terminology. Its three main aspects are vulnerability, absorption, and recovery. In terms of our capacities, vulnerability can be viewed as part of absorption, while recovery corresponds mostly to adaptation. In terms of our measurement, vulnerability and absorption are included in the impact, while recovery corresponds to our recovery and medium-run measures.
[2] During standardisation, raw changes associated with each metric are first demeaned by the cross-country average and then divided by the cross-country standard deviation. The resulting z-scores thus signal differences (in standard deviations) in resilience performance relative to other countries.
[3] Formally, the metric takes value +1 (-1) if the 2016 level of a variable is above (below) the 2007 level by at least one standard deviation of the pre-crisis values (2000–2007) around a trend, and is equal to 0 otherwise. Therefore, the composite bouncing forward indicator measures the (relative) share of system variables characterised as ‘bouncing forward’ minus those considered as ‘still to recover’.
[4] For simplicity, resilience indicators are obtained by taking the arithmetic mean of relevant variable metrics. Note that our main results are highly invariant both to the normalisation technique used for calculating the metrics, and to the use of more elaborate weighting schemes when deriving the resilience indicators.
[5] Note that this may partly follow from the chosen measurement strategy—as long as recovery is contingent on impact, a sluggish (vigorous) recovery in several countries may be the mechanical consequence of a weak (strong) impact.
[6] The scatterplot associated with the recovery indicator is not presented as interpretation may be less straightforward due to the potential impact-recovery linkages mentioned earlier.


