We all have casual evidence of stores selling the same product at different prices, and a number of studies have shown that this is not only an impression. In the past, the scarcity of adequate microeconomic price data hindered a general evaluation of the extent of price dispersion, and studies were limited to specific markets. Indeed, the precise quantification of price dispersion requires information about the prices of the exact same products in different outlets. Therefore, assessing price distributions at the economy-wide level requires the gathering and analysis of big data, which is why we used to know very little about such a familiar phenomenon. However, a number of papers have recently tackled the overall shape and structure of price dispersion in the retail sector in countries like the US, the UK, and Canada. They show that price dispersion is a pervasive phenomenon (Kaplan and Menzio 2015) and that this is the case even for products sold online (Gorodnichenko et al. 2014, Gorodnichenko and Talavera 2017). Our ongoing work suggests that France is no exception (Berardi et al. 2017).
In order to understand how prices are set, economists need to account for the fact that the same product is sold in different places at different prices. Price dispersion may also be an issue for central banks if it reflects deviations from optimal prices (i.e. those that setters ‘should’ choose). Indeed, in this case monetary policy is not efficiently transmitted to inflation, hindering the objective of price stability. But is it a hassle for consumers, too? We suggest that consumers are in a relatively easy position to decide where to go shopping, at least in France. Indeed, expensive and cheap stores tend to be persistently so over time and consistently so across the products they most commonly sell. Moreover, the retail chain to which a store belongs turns out to be a good indicator of its level of overall expensiveness.
How far prices of the same good differs across stores
The price of a product is dispersed if, at a given time, price setters sell products at different levels. To precisely quantify the extent of price dispersion, we rely on the notion of deviation from the ‘normal’ price1 of a product2 at the national level.
Based on 40 million prices of the most widely sold 1,000 products across more than 1,500 stores in France from October 2011 to September 2012, we find that prices in the retail sector are on average 5% above or below their ‘normal’ price.3 The comparison with price dispersion measures available for the US, the UK, and Canada suggests that in France prices are less dispersed.4 In particular, price dispersion across bricks-and-mortar stores in the US measured by Kaplan and Menzio (2015) appears to be 20-50% greater than in France.
Why would prices of the same good differ across stores?
From a theoretical perspective, even with identical retailing costs, the same product may be sold at different prices for two reasons. The first is imperfect information – consumers may not know which store sells a product at the lowest price, and to find out, they would need to conduct costly checks in several stores. The second reason lies in differentiation – the same product may be perceived as not exactly identical when bought in different stores. For instance, a consumer may prefer to buy his jar of Nutella at a corner store in his posh neighbourhood even if he knows that the same item is less expensive in a less fancy, more crowded, or further away superstore.
These two cases have different empirical implications, so the analysis of price dispersion allows us to understand what is actually going on. Indeed, in the second case, different sellers would be able to let prices for the same product differ in a persistent way. However, in the first case, if price dispersion for a homogeneous product is to last, it must be the case that over time sellers increase and decrease their prices relative to other stores, so that consumers cannot easily learn which store is selling at the lowest prices.
You can guess where to go shopping (at least in France...)
In order to discriminate between different potential sources of price variability, we need to analyse prices across stores over time and empirically establish whether price dispersion is mainly temporal (a store’s price moves up and down in the price distribution over time) or spatial (some stores consistently charge more or less than others for the same good).
A visual way to do this consists of ranking stores based on the average decile to which their products' prices belong relative to normal prices. A store belonging to the first decile in a given week, for instance, is a store in which, on average, products are sold below their normal national price (i.e. a relatively cheap store). If the source of price variability is mainly temporal, the ranking of stores within the cross-sectional price distribution should randomly change over time, so that consumers have a hard time learning where to go shopping.
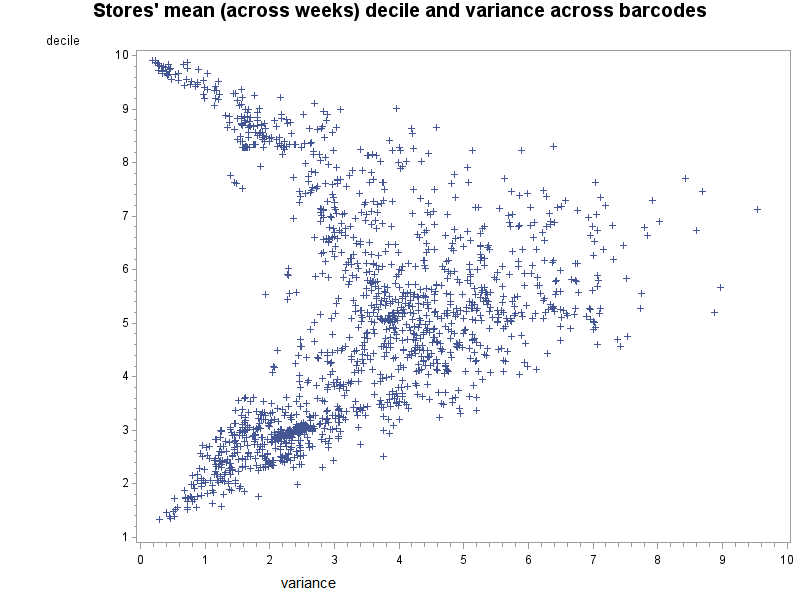
Figure 1 shows that, overall, expensive and cheap stores (corresponding to the highest and lowest deciles respectively) tend to be consistently expensive or cheap over time in France. Therefore, it is relatively easy for consumers to assess by experience whether a store is expensive or cheap. Moreover, Figure 2 suggests that expensive stores tend to exhibit high price levels in a consistent way across the most commonly sold products. Similarly, cheap stores tend to sell most products at low prices. In conclusion, price dispersion in France appears to be mainly spatial – some stores charge more or less than others for the same goods in a persistent way. However, this conclusion is nuanced in the case of middle-ranked stores. Indeed, stores in intermediate deciles are characterised by a larger variance of price dispersion over time (Figure 1) and especially across products (Figure 2). In other words, in a middle-ranked store (i) a product may be relatively expensive one week and cheap the following, and (ii) some products may be relatively expensive and others cheap.
Figure 1 Stores’ expensiveness averaged across barcodes varies little over weeks for expensive and cheap stores
Source: Berardi N., Rue de la Banque, 54, January 2018, Banque de France.
Figure 2 Stores’ expensiveness averaged across weeks varies little across barcodes for expensive and cheap stores
Source: Berardi N., Rue de la Banque, 54, January 2018, Banque de France.
A more sophisticated way to disentangle temporal and spatial price dispersion is to estimate, for each product separately, a fixed effect model disentangling the relative contribution of temporal price variations (including sales) and of permanent price differences across stores to the observed price dispersion. In Berardi et al. (2017) we show that the permanent spatial component of price dispersion largely dominates. In conclusion, both approaches suggest that French consumers are often in a good position to guess which store they should go shopping in.
The pervasive role of retail chains in price dispersion
Assessing whether a store is cheap or expensive overall would still take some effort. However, luckily for French consumers, it turns out that the retail chain to which a store belongs may be a good indicator of its expensiveness. Therefore, they can often base their shopping destination choices on a relatively simple assessment of a retail chain’s reputation.
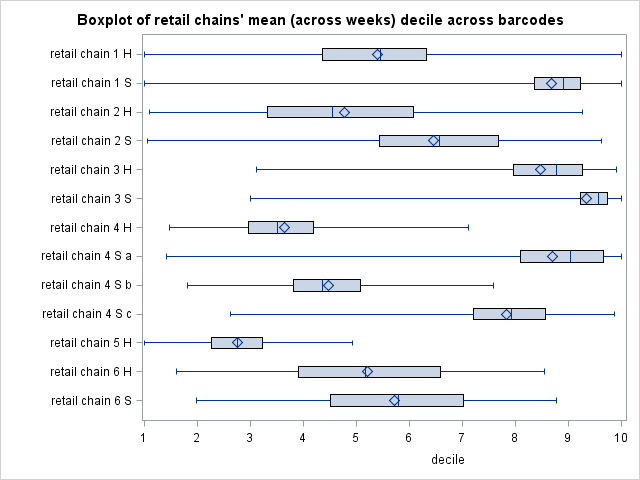
Figure 3 represents, by retail chain, the distribution of deciles of all the products they sell.5 For each retail chain, the blue diamond is the average decile and therefore represents its overall expensiveness.6 Comparing the latter across retail chains suggests that medium-sized supermarkets are typically more expensive than large supermarkets, and this is always true within the same group.7 Moreover, each boxplot provides information about the dispersion of the relative expensiveness of products sold within a retail chain.8 Retail chains that are generally neither expensive nor cheap tend to sell different products at different relative price levels. However, overall expensive and cheap retail chains set many of their products’ prices respectively high and low relative to that of the same goods sold elsewhere.
Figure 3 Distribution of expensiveness ranking across barcodes by retail chain
Source: Authors’ calculations.
The pervasive role of French retail chains in price dispersion9 also shows up in the econometric investigation of the determinants of the permanent spatial component of price dispersion (Berardi et al. 2017). Indeed, local conditions regarding demand or local competition between supermarkets play a significant role, but what turns out to be crucial is the persistent heterogeneity in French retail chains’ pricing.
References
Berardi, N, P Sevestre, and J Thébault (2017), “The determinants of price dispersion: Evidence from French supermarkets”, Banque de France Working Paper 632.
Kaplan, G, and G Menzio (2015), “The morphology of price dispersion”, International Economic Review 56(4): 1165-1206.
Gorodnichenko, Y, V Sheremirov, and O Talavera (2018), “Price setting in online markets: Does it click?”, Journal of the European Economic Association, jvx050.
Gorodnichenko, Y, and O Talavera (2017), “Price setting in online markets: Basic facts, international comparisons, and cross-border integration”, American Economic Review 107(1): 249-282.
Endnotes
[1] The ‘normal’ price level is represented by some measure of central tendency of the weekly prices for that item across stores.
[2] A product is defined as the barcode level, e.g. the 33cl standard Coca-Cola can.
[3] The mean absolute deviation of weekly prices is computed with respect to the quarterly average log price of each barcode as a measure of central tendency. For alternative measures of price dispersion, see Berardi et al. (2017). Our ongoing work adopts the quarterly modal price of a product over stores as a measure of central tendency.
[4] In Berardi et al. (2017) we report several measures of price dispersion computed for the US, the UK, and Canada (Kaplan and Menzio 2015, Gorodnichenko et al. 2014, and Gorodnichenko and Talavera 2017) and compute them for France.
[5] Price data come from stores (none of which is a discount store) of 13 retail chains and 6 groups.
[6] Furthermore, we find that the overall ranking of retail chains is rather stable over the period.
[7] We anonymised the names of retail chains. However, they still convey information about whether the typical size of supermarkets belonging to a retail chain is medium (labelled with S, standing for ‘supermarché’ in French) or large (labelled with H, for ‘hypermarché’), as well as which ones belong to the same group (retail chains belonging to the same group are labelled with the same number).
[8] Each box corresponds to the interquartile range and the vertical line within the box to the median decile for a retail chain.
[9] Our ongoing work further investigates the pervasive role of retail chains in price dispersion and focuses on its between- and within-components.


