With alarming frequency, policy reports, the financial press, and high-ranking officials from multilateral organisations warn us of a perfect storm that could hit emerging markets. This perfect storm might include various political and institutional debacles, external economic shocks (e.g. falling commodity prices, growing cost of foreign debt, and slowing external demand from major trading partners), and an ever-increasing occurrence of natural disasters (e.g. hurricanes, earthquakes, and tsunamis) (IMF 2018). Recently developed market-based insurance tools can help developing nations completely or partially insure against such risks. Whenever possible, insuring against bad outcomes through the market tends to be cheaper than self-insuring through precautionary savings or other means, which may carry large opportunity costs. Classifying risks based on countries’ ability to insure against them should help policymakers build sounder risk-management portfolios.
From known unknowns to black swans
In a recent World Bank report (Vegh et al. 2018), we classify the different types of risks faced by emerging markets based on the degree of predictability implied by their underlying probabilistic distributions.
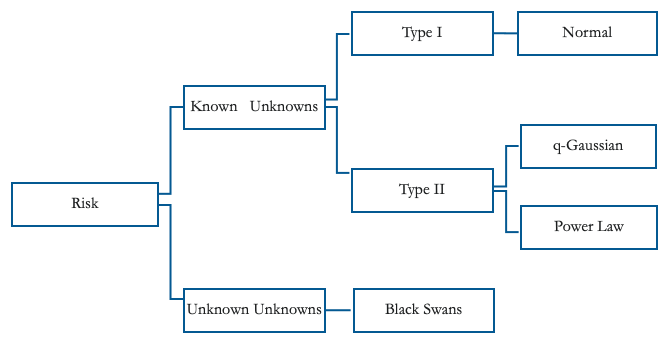
As illustrated in Figure 1, we distinguish between risks that are predictable (i.e. ‘known unknowns’ or events that have a known distribution) and those that are completely unpredictable (i.e. ‘unknown unknowns’ or events that simply have no known distribution, if at all). The latter are also commonly referred to as ‘black swans’, following the influential work of Taleb (2007) and others.1
Figure 1 Different types of risks
Source: Authors’ elaboration
Contrary to known unknowns, black swans are uninsurable due to their unpredictable nature. A good example is the terrorist attacks of 9/11. Nobody could have predicted on 10 September 2001 that 9/11 would happen. A major earthquake hitting New York City would be equally unpredictable. To minimise the impact of such large and unpredictable events, emerging markets can only rely on building broad-based resilience through, for example, more efficient national security and diplomacy, stronger and readily-available first responders, better infrastructure, and anti-seismic building codes. The quick deployment of ex-post aid is another key component of emerging markets’ arsenal against black swans.
As shown in Figure 1, among known unknowns, we distinguish between risks with underlying normal distributions (Type I risks) and risks with fat-tailed distributions (Type II risks).2In the case of Type I risks, all moments of the distribution are well-defined. For example, the normal distribution (the quintessential Type I risk) is fully characterised by its first two moments: mean and variance. This implies that ex-ante risk can be fully quantified, which opens the door for full and relatively cheap insurance. Possible distributions associated to Type II risks range from q-gaussians, with similar bell-curve shape but fatter tails than those of a normal distribution, to power-law distributions where a large share of the distribution falls under the tails. Risks associated with fat-tailed distributions are typically more difficult and expensive to insure.
Type I and II risks
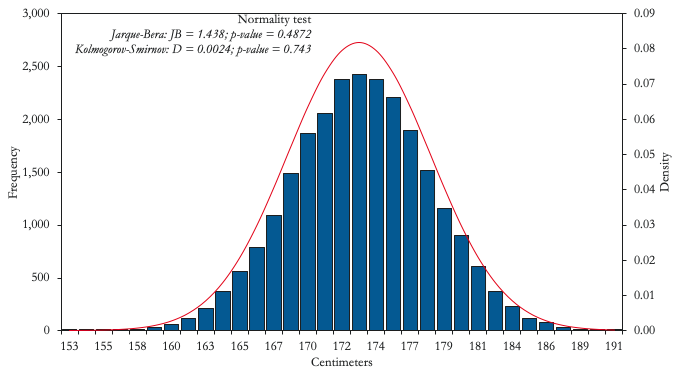
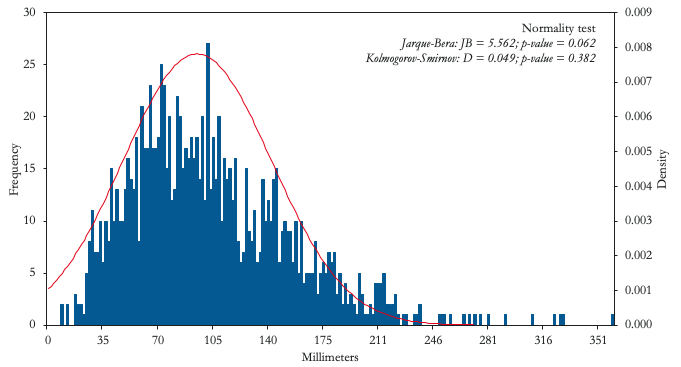
We now provide concrete examples of some of the distributions associated with Type I and Type II risks faced by emerging markets. While many natural phenomena, such as human height (Figure 2, Panel A), are very well characterised by a normal distribution, the same is not true for economic variables. A possible exception is the amount of rainfall in countries heavily associating with agricultural exports and/or rain for the generation of hydroelectric power, such as Uruguay (Figure 2, Panel B). In this case, even extreme tail events (at the edge of the physically possible) like continuous heavy rain for a full month does not fundamentally change the ex-ante characteristics of the distribution. Uruguay should thus find it relatively easy to insure against droughts and/or energy shortages using market instruments such as financial derivatives. Indeed, in 2014, the Uruguayan government issued a rainfall call option based on a rainfall index as the strike price and barrels of oil as the underlying asset.3
Figure 2 Type I events
A) Human height
B) Rainfall in Uruguay
Notes: Height data based on a growth survey of 25,000 children from birth to 18 years of age from Hong Kong. Monthly rainfall data for the period 1916-2015.
Source: Authors’ computations based on data from Statistics Online Computational Resource (UCLA) and Climate Change Knowledge Portal (World Bank).
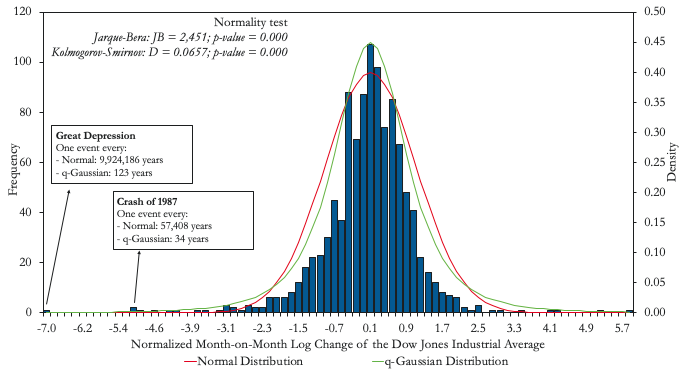
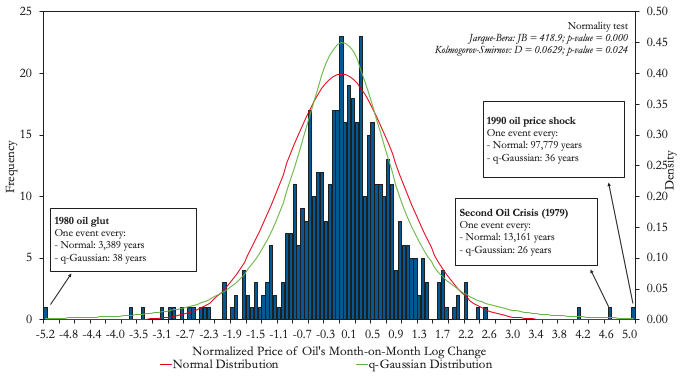
A substantial number of financial risks may be misidentified as Type I when, in reality, they are Type II. Panels A and B in Figure 3 illustrate two clear examples: the return to the Dow Jones Industrial Average index and the percentage change in the price of oil. While both distributions appear to follow the typical bell-curve shape, the relatively high number of extreme events under the tails imply that we can reject the null hypothesis that they follow a normal distribution. As a result, pricing insurance against an oil shock (e.g. a put option for an oil exporter like Mexico) assuming an underlying normal distribution, as is done in the widely known Black-Scholes pricing model, can lead to nasty surprises (Black and Scholes 1973, Merton 1973). As an example, while a q-gaussian distribution would predict that a Great Depression-type of event would occur every century, a normal distribution would predict such an event to occur once every ten million years (i.e. never).
Figure 3 When Type II events dress up as Type I events
A) Dow Jones
B) Price of oil
Notes: Dow Jones series from January 1928 to May 2018. Oil price data from January 1979 to April 2018.
Source: Authors’ computations based on data from Bloomberg and World Bank Commodity Price Data (Pinksheets).
Any trader in the business of selling derivatives should not ignore the possibility of Great Depression-type events or even events like the crash of 1987. In our paper we show, in a general equilibrium context, that adding risk aversion or assuming underlying distributions with fatter tails translates into significant premiums for the price of options compared to those obtained from the Black-Scholes formula (Borland 2002). While the Black-Scholes formula is still used as a benchmark for option pricing, market participants seem to understand the risk bias embedded in this formulation and premiums over Black-Scholes prices are typically observed in market prices. Risk premiums aside, international derivative markets represent a potentially good opportunity for emerging markets to insure against these risks. The Mexican oil hedge, the largest oil hedge in the world, provides a good example. Since 2001, Mexico has spent, on average, about 0.1% of GDP every year buying put options against drastic falls in the international price of oil. Mexico has exercised this option in 2009, 2015, and 2016 with payments representing 0.5, 0.6, and 0.3% of GDP, respectively.
Fat tails
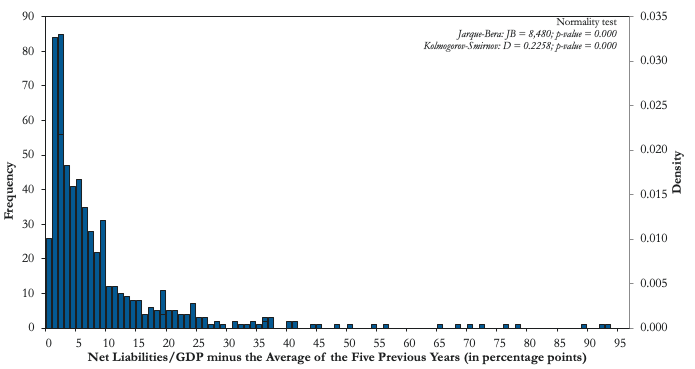
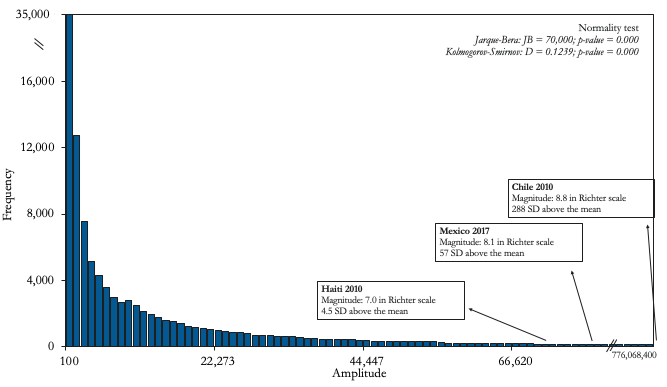
At the other extreme of the Type II risks spectrum, we find distributions where the probability of a single extreme tail event changing the ex-ante moments of the sample distribution is not negligible. Figure 4 illustrates two important examples for many emerging markets: (i) sudden reversals of international capital inflows (i.e. sudden stops) in Panel A, and natural disasters (represented here by earthquakes) in Panel B. These risks seem to follow power-law distributions where, compared to a normal distribution, the probability of tail events falls slowly relative to their size.
Figure 4 Type II events
A) Intensity of sudden stops
B) Magnitude of earthquakes
Notes: A sudden stop is defined as occurring when portfolio investments and other investments' net incurrence of liabilities (as percentage of GDP) of the private sector decline below the average of the previous five years by at least 1.5 standard deviations.
Source: Authors’ computations based on data from Northern California Earthquake Data Center (UC Berkeley Seismological Laboratory), BOP-IMF, and WDI.
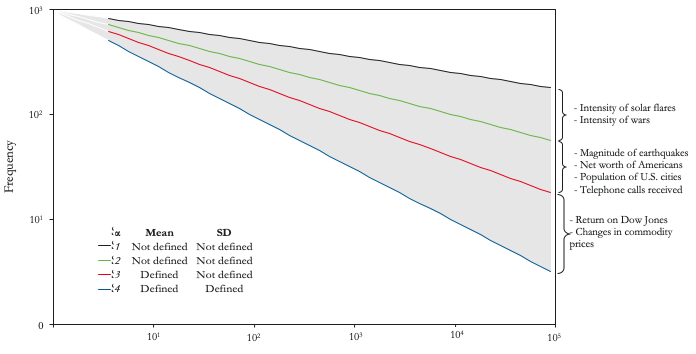
Generally speaking, the fatter the tail, the fewer moments of the sample distribution will be finite. To illustrate this point, Figure 5 shows the tails of a power-law distribution in logarithmic scale, where the exponent of the probability density function, α, captures the slope of the tail. The higher α is, the steeper the slope and the faster the probability falls for big tail events. For example, q-gaussian distributions have power tails with relatively high α, which means that their mean and variance are well defined. As α becomes smaller, as is the case for earthquakes and sudden stops, fewer moments of the distribution will be finite. Given the fact that some of these risks may not even have finite first and second moments (i.e. a well-defined ex-ante mean and variance), it may be very difficult, if not impossible, to buy insurance against them. Indeed, to the best of our knowledge, there is no effective market insurance against, for example, sudden stops.
Figure 5 Power-law distributions
Source: Authors’ elaboration.
Catastrophe bonds
In terms of market insurance, the good news is that continuous progress in insurance markets has recently allowed emerging markets to gain access to partial insurance against natural disasters through catastrophe bonds. A case in point is the catastrophe bond (cat bond) for the Pacific Alliance. In February 2018, the World Bank issued a catastrophe bond that collectively provides insurance for 1.36 billion dollars in earthquake protection to the countries in the Pacific Alliance (Chile, Colombia, Mexico, and Peru). This is the largest sovereign risk insurance transaction ever and the second largest issuance in the history of the catastrophe bond market.The bond is sold to investors at a premium and both principal and remaining interest coupons are not paid back in case of an earthquake.In terms of the cost, we show that creating a portfolio of countries with relatively uncorrelated exposure to earthquakes reduces the cost of the Pacific Alliance cat bond. Therefore, adding other countries like Turkey, Pakistan, or Indonesia to future issuances of cat bonds could further lower the cost of insurance.
In this environment, the World Bank could play an important role not only in the effective transfer of risk from countries to international investors but also mediating across such a set of diverse emerging economies. Needless to say, these insurance schemes only provide partial insurance up to the principal amount of the bond, which is typically not enough to cover all the costs of a large catastrophe. As mentioned above, in these cases, partial insurance needs to be complemented with precautionary savings, resilience, and ex-post funds.
Conclusions
Understanding the nature of the risks faced by emerging markets is critical when it comes to finding the best kind of response. To that effect, we have divided risks into ‘known unknowns’ and ‘unknown unknowns’. Ex-ante insurance is only possible for risks with known distributions and its availability diminishes with the degree of predictability. The good news is that insurance technology has been improving tremendously in the last decades. Today, even risks with ‘fat tails’, like natural disasters, can be met with (albeit partial) ex-ante insurance. A better understanding of the underlying risks faced by emerging markets should lead towards a more effective and efficient portfolio of insurance tools in the not-too-distant future.
References
Black, F, and M Scholes (1973), “The Pricing of Options and Corporate Liabilities,” Journal of Political Economy 81: 637-654.
Borland, L (2002), “A Theory of Non‐Gaussian Option Pricing,” Quantitative Finance 2: 415-431.
IMF (2018), World Economic Outlook, October 2018: Challenges to Steady Growth.
Merton, R C (1973), “Theory of Rational Option Pricing,” Bell Journal of Economics and Management Science 4: 141-183.
Taleb, N N (2007), The Black Swan: The Impact of the Highly Improbable, Random House.
Vegh, C A, G Vuletin, D Riera-Crichton, J P Medina, D Friedheim, L Morano, and L Venturi (2018), From Known Unknowns to Black Swans: How to Manage Risk in Latin America and the Caribbean, LAC Semiannual Report, World Bank.
Endnotes
[1] Until 1697, Europeans thought that all swans were white. Then, in an expedition to Australia, they discovered, to their surprise, that there are also black swans (see Taleb 2007 for a detailed account).
[2] There are, of course, numerous potential distributions behind Type II risks. For the sake of concreteness, we focus on two of the most common, the q-Gaussian and the power law probability distributions.
[3] The Uruguayan rainfall option started in January 2014 and ended in June 2015 (the government did not exercise the option).


