Investor trust in European banks has dwindled, first, in light of the economic and financial crisis, then, the European sovereign debt crisis and with it the worsening economic outlook. As tightening refinancing conditions for European banks spun out of control in summer and autumn 2011, the European Council agreed on a set of policy measures to address the pernicious triangle of sovereign debt, banking system health, and economic growth. Of all measures, the European Banking Authority’s (EBA ) recapitalisation exercise became the far most contested. Fears of a European-wide credit crunch, fuelled by banks shrinking their balance sheets, became policy priority number one (see BIS 2012 and IMF 2012a and 2012b).
On this site, Morris Goldstein has excoriated European policymakers and supervisors alike, for having defined the recapitalisation target in terms of a ratio to Risk Weighted Assets (RWA) rather in terms of absolute numbers (see Goldstein 2012). This would provide incentives for bank deleveraging “which is unambiguously contractionary”. While the risks of deleveraging are often prominently featured, the evidence so far is weaker and receives much less attention.
In this column we investigate balance-sheet growth, capitalisation, and deleveraging of European banks since the end of 2008 and show that based on existing empirical evidence banks have so far reduced their leverage (i) markedly and (ii) mainly by raising capital rather than reducing exposure to the real economy. In doing so, banks have been able to address two concerns at the same time: One related to their fundamental soundness (“banks are undercapitalised”), the other related to potential harm done to the economy at large (“banks are causing a credit crunch”).
Before we delve into the economic analysis and (available) quantitative evidence, let us define deleveraging as the reduction of leverage, i.e. a decrease in banks’ total-assets-to-capital ratios. Banks can achieve it by raising capital and/or shrinking total assets. Moreover, we refer to excessive deleveraging as a contraction of lending to the real economy to achieve deleveraging, such that creditworthy non-financials (companies and households) are credit constrained.
Pre-crisis misallocation of capital and post-crisis balance sheet repair
In Europe – especially in peripheral and some Central-Eastern- and South-Eastern European countries (CESEE) – the magnitude of the current economic crisis was partly caused by excessive bank lending at interest rates that were too low. Given this, a moderate deleveraging process is to be welcomed. Many fear however that bank deleveraging means a reduction of loans to the real economy.
But lending to the real economy is only 45% of their aggregate total assets; banks could reduce their balance sheets through reductions in interbank exposure, non-core external assets, and shares in the trading book. Even the sale of credit exposures merely leads to a transfer of ownership that in the end could have relatively little impact on the underlying exposures and therefore the financing of the real economy. If assets (or whole subsidiaries) are transferred from a weaker to a better capitalised, better funded market participant that is capable of maintaining or even expanding business, this form of deleveraging can even be considered beneficial.
Moreover, the real sector’s dependence on bank financing is changing. Some large non-financial corporations in Europe face lower credit spreads than most EZ banks.1 They can seek funding directly in the market.
Maintaining the Balance
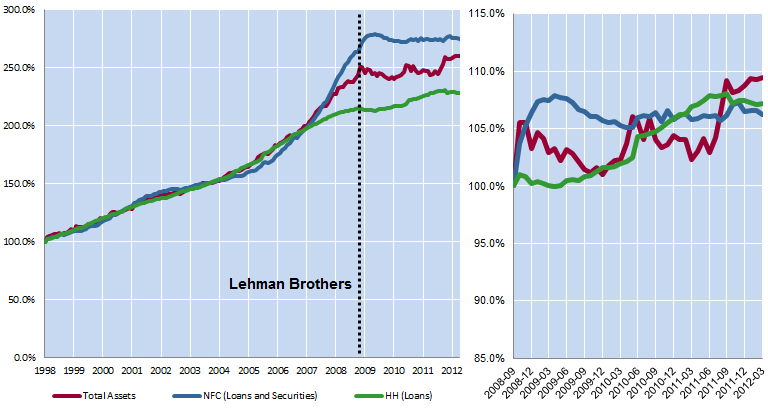
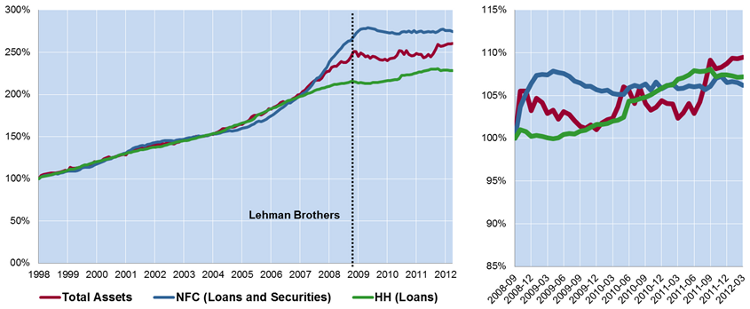
Chart 1 shows that total assets growth of Eurozone Monetary Financial Institutions has decreased markedly since 2008, but there has been a small rise; from €31.8 trillion at the end of 2008 to €33.6 trillion at the end of 2011. Over the same period, the total stock of outstanding loans (and securities) to Eurozone non-financial corporates and households has grown; albeit, at a much slower pace than before the crisis, and there are substantial regional differences (not shown).
Figure 1. Balance-sheet dynamics of Eurozone Monetary Financial Institutions
Source: ECB and authors’ calculations. Stocks are indexed at year-end 1997 (left-hand panel) and re-indexed at the end of the third quarter 2008 (the Lehman Episode, right-hand panel).
These institutions’ balance sheets have also evolved on the liability side.
- Deposits by Monetary Financial Institutions, money market funds, and external counterparties decreased by a hefty €1.4 trillion (a rise of 11% from 2008).
- This reduction was only partly be off-set by an increase of non-Monetary Financial Institution deposits (+ €1.1 trillion).
The gap was filled by the Eurosystem which increased its balance sheet by about €700 billion over the period.2
What all this means is that avoiding refinancing risk, the term funding of Eurozone banks would have to outpace growth of long-term illiquid assets. This would have to continue until the maturity mismatch relative is brought back into line with the banks’ liquidity risk baring capacity. With European banks currently facing difficulties accessing term markets and with the ECBs Long-Term Refinancing Operation cheap funding having constituted a funding lifeline to many European banks, banks could face refinancing pressures from the refinancing organisations in three years so achieving the desired sustainability of banks maturity mismatches will be a protracted slow process.
New evidence on the role of Capital increases in Eurozone deleveraging
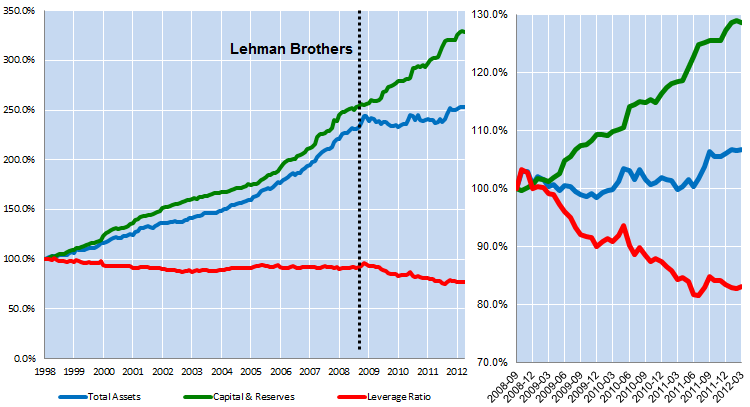
Despite this growth in total assets and credit intermediation to the real sector, Eurozone banks managed to decrease their assets-to-capital-and-reserves ratios from 18 to 15 between 2008 and 2001.3 Some large European banks, however, still have a long way to go.
On aggregate, Monetary Financial Institution data for December 2011 reveals that capital and reserves grew from €1.8 trillion at the end of 2008 to €2.2 trillion at the end of 2011, despite large write-downs over the period. Figure 2 summarises the evidence:
Figure 2. Leverage of Eurozone Monetary Financial Institutions
Source: ECB and authors’ calculations. Stocks are indexed at year-end 1997 (left-hand panel) and re-indexed at the end of the third quarter 2008 (the Lehman Episode, right-hand panel).
To complement the analysis of aggregate Monetary Financial Institution data, we take evidence from EBA’s disclosure regarding recapitalisation plans and the likely developments over the next 6 months. Under the recapitalisation exercise, banks have to increase their core tier-1 capital adequacy ratio to a (temporary) minimum of 9% of risk-weighted assets. The capital shortfall (excluding mostly Greece) amounted to €78 billion (EBA 2012). According to the EBA, 77% of the recapitalisations were direct capital measures.
We seek further evidence in banks’ annual/quarterly reports and press releases.4 Our sample covers 61 European banks of EBA’s recapitalisation exercise. About half are not subject to forced recapitalisation requirements, as they hold capital in excess of nine per cent of RWA. According to banks own public statements, most plan retaining (some) profit; around 30% envisage the buy-back of hybrids – both of which are measures to increase banks’ core capital. About 20% target assets sales – mostly insurance or banking subsidiaries – and less than 10% intend to withdraw from either certain lines of business (e.g. insurance or cross-border retail) or particular non-EU countries.
Nonetheless, Central-, Eastern- and South-Eastern countries have been identified as major deleveraging target by many studies. Therefore, we also examine recent BIS statistics, and Figure 3 shows the exposure of BIS-reporting banks to these countries which prior to the crisis have hugely benefited from cheap inflows of European bank lending (consider the scale in comparison to the other Figures). The right-hand chart also shows that after significant initial outflows late 2008, early 2009 the Vienna Initiative 1.0 helped, partly, to keep deleveraging orderly. The most recent dip in exposure, however, points to renewed pressure, which can at least partly be attributed to the economic travail of certain countries in the region. Furthermore, there has been a trend since the crisis for European banks from large countries to increase their holdings of domestic bonds. This rising home bias, which has been seen for France and Germany but also for Italy and Spain, implicitly contributes to the cross-border deleveraging progress.5
Figure 3. Exposure of BIS-reporting Banks to CESEE
Source: BIS and authors’ calculations. Stocks are indexed at the end of the first quarter 2003 (left-hand panel) and re-indexed at the end of the third quarter 2008 (the Lehman Episode, right-hand panel).
Although the sample composition differs (i.e. the sample consists only of large cross-border EU banks and, thus, also includes some non-euro area EU banks), in sum the bank-level data corroborates the evidence generated from Monetary Financial Institution statistics. In parallel to the deleveraging process underway in the Eurozone, large companies issued more debt since 2008 than before the crisis. Their average issuance jumped from €43 billion per annum (2006-8) to €67 billion per annum (from 2008-2011).6
Room for manoeuvre
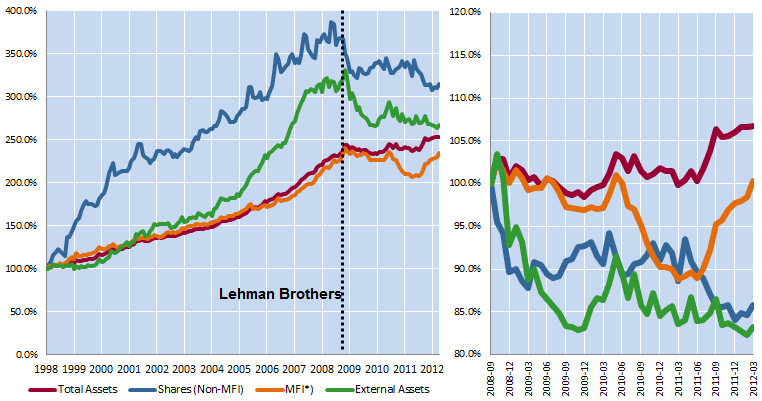
So far we have shown that Eurozone banks maintained their total exposure to non-Monetary Financial Institution corporates and households and that they nevertheless managed to decreased leverage by raising capital. But banks cut elsewhere – especially their holdings of non-financial company shares and external assets (Figure 4).
Figure 4. Balance-sheet dynamics of Eurozone Monetary Financial Institutions
Source: ECB and authors’ calculations. Stocks are indexed at year-end 1997 (left-hand panel) and re-indexed at the end of the third quarter 2008 (the Lehman Episode, right-hand panel).
This pattern of holding on to loans while exiting shares and external assets can be thought of a natural shift by banks towards what they do best.
Banks’ competitive advantage lies in credit and liquidity risk assessment and management rather than in speculative trading; in order to preserve their franchise values, banks do not resort to a decrease of their market shares in credit markets, unless absolutely unavoidable (e.g. restructuring due to EU state aid conditions). Banks also have relatively more pricing power in loan/deposit markets than in financial markets (i.e. shares, bonds, interbank markets) where they are usually price-takers. In addition, financial crisis are often accompanied by significant increases in loan margins (see among others Kwan 2010 and Aisen and Franken 2010).
Conclusion
Following the evidence presented above, we believe that banks’ choice is less between deleveraging and non-deleveraging, but between orderly and dis-orderly, excessive deleveraging. Without deleveraging, bank funding markets would be unlikely to stabilise, especially following the eventual unwinding of ECB liquidity measures, which would result in even greater and potentially uncontrolled deleveraging by banks. It is also to be welcomed from a financial stability angle. Thus, restoring confidence and securing access to sustainable funding markets is a necessary precondition for the sustainable supply of loans to the real economy. So far the deleveraging process was driven by increases in capital and reserves, as well as a reduction of external assets and non-Monetary Financial Institution shares, but not by the reduction of intermediation to the Eurozone real economy. Unless a tail risk scenario materialises, we expect this trend to continue for the near future. Both the evidence from banks’ disclosure and considerations concerning relative pricing power and franchise value point in this direction.
Disclaimer: The views expressed in this column are those of the authors and do not necessarily represent those of the OeNB/IMF or OeNB/ IMF policy.
References
Aisen, A and M Franken (2010), “Bank Credit During the 2008 Financial Crisis: A Cross-Country Comparison”, IMF Working Paper 10/47.
BIS (2012), “European bank funding and deleveraging”, Quarterly Review March 2012.
De Haas and van Horen (2011), Running for the exit: international banks and crisis transmission, EBRD.
European Banking Authority (2012), Overview of the Capital Plans following the EBA Recommendation on the creation and supervisory oversight of temporary capital buffers to restore market confidence, EBA 2012-005.
ECB (2011), “The financial crisis in the light of the euro area accounts: a flow of funds perspective, ECB Monthly Bulletin, 99-120.
EU COM (2012), Alert Mechanism Report, 14 February.
Goldstein M (2012), “Stop coddling Europe’s banks”, VoxEU.org, 11 January.
IMF (2010), “Spain: 2010 Article IV Consultation”
IMF (2012a), Global Financial Stability Report April 2012, Chapter 2, Section "Bank Deleveraging – Why, What, by How Much, and Where".
IMF (2012b), World Economic Outlook April 2012, Chapter 1, Section "Tighter Financial Conditions, Mainly in the Euro Area".
Kwan, SH (2010), “Financial Crisis and Bank Lending”, Federal Reserve Bank of San Francisco Discussion Paper.
OeNB (2011), “Financial Stability Report”, 4:52.
1See for instance the EU COM work on crisis management underway here.
2Even though some large European banks still have a long way to go to achieve more sustainable leverage levels.
3See ECB weekly financial statements (various).
4This paragraph is based on a survey by the author’s research assistant, Bernhard Berger, who covered 61 European banks from the EBA sample. Our sample excludes all Greek banks as well as Spanish cajas. It is based on publicly available data from banks’ annual/quarterly reports and press releases.
5In more general terms we actually prefer the concept of “core asset bias” to home bias. Large banks in large countries might exhibit a preference for their home asset (because their home market coincides with their core market). This must not be the case for cross-border banks from smaller countries, i.e. Sweden (with Scandinavia) or Austria (with Central Europe). See for instance De Haas and van Horen (2011).
6See ECB Eurozone accounts.


