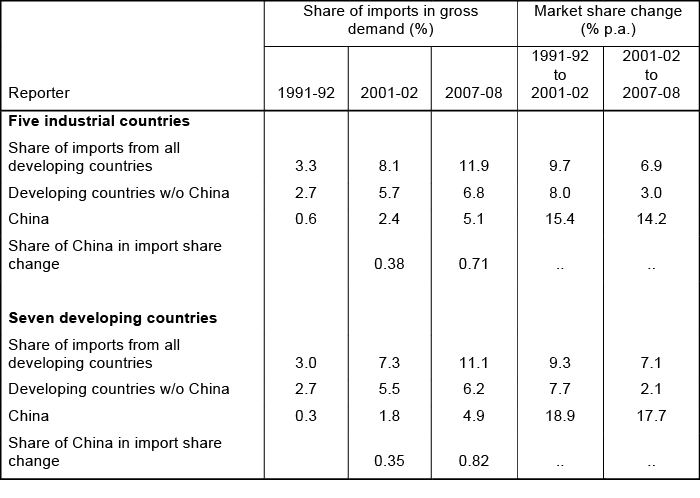
One of the important developments of the last couple of decades has been the rapid expansion of manufacturing exports from developing countries to high-income industrial countries, as well as to other developing countries. Developing economies have also gained significant market share in both major industrial countries and in each other’s markets during this period (Aksoy and Ng 2013a, 2013b). For five large high-income countries (US, Japan, Canada, Germany, and France) the share of manufacturing imports from developing countries in gross manufacturing output more than doubled from 3.2% in 1991-92 to 8.1% in 2001-02 and more than tripled to 11.7% in 2007-08. For seven large emerging economies (Brazil, India, Korea Republic, Malaysia, Mexico, South Africa, and Turkey) this ratio also rose vigorously, i.e. from 3.0% in 1991-92 to 7.1% in 2001-02 and 10.9% in 2007-08 (see Table 1). These sharp increases were a direct result of both the global trade liberalisation process and the increased competitiveness achieved by developing countries in manufacturing activities. These developments have led many institutions and writers to argue that market share increases in industrial countries and expanding south-south trade could possibly drive future world trade at reasonable rates. (IMF 2011; OECD 2006; UNCTAD 2002, 2005; and World Bank 2004, 2005, 2007).
In this column, we show that during the 1990s China’s market share in all markets (industrial and developing) increased at much higher rates than that of all other developing countries.1 Notwithstanding such growth in China, other developing countries also gained significant market shares in industrial and developing country markets. However, this situation changed during the 2000s with China accounting for about 75% of market share changes of all developing countries in five large industrial country markets and 80% of these changes in seven developing countries. We show that the better performance of other developing countries during the 1990s resulted to a large extent from onetime free trade agreements and to a lesser extent from increased competitiveness. We also show that other developing countries have lost market shares in the Chinese market. They include other Asian suppliers providing goods to be assembled in China for export to the rest of the world.
Data
For this study the gross production data are converted to dollars at the current average exchange rates to make them consistent with trade data from COMTRADE. These are nominal dollar values that include dollar inflation and changes in the real exchange rate of local currencies against the dollar. Gross production is taken from the UNIDO database and checked against other sources for consistency. The definition of industrial countries is based on the traditional IMF definition that includes the EU15, US, Canada, Japan, Australia, New Zealand, Iceland, Norway, and Switzerland. Developing countries include all countries in the world except 23 industrial ones. The 1991-92, 2000-01, and 2007-08 periods are used as benchmarks to estimate growth rates and import shares. Two-year averages are used to minimise the annual fluctuations in output and trade. The 2007-08 year is used as the final year both due to data availability, and more importantly, because it was the last year prior to the 2009 global financial crisis. An analysis of the impacts of that crisis on trade values would require a separate study.
Results
- Market share change rates of other developing countries decelerated during the 2000s while the high rates for China did not change.
- The deceleration in market share changes of non-China developing countries have been significant – from 8.0% p.a. to 3.0% p.a. in industrial markets and from 7.0% p.a. to only 2.4% p.a. in developing country markets.
- China’s market share increases were around 15 p.a. in industrial country markets and around 18 p.a. in developing markets during both periods (Table 1).
- The deceleration of market share changes of other developing countries and the increase in China’s contribution was not caused by the acceleration of market share increases of China; they were caused by the deceleration in market share increases of all other developing countries.
Table 1 Manufacturing imports from developing countries with and without China
Note: The data is based on twi-year averages of 1991-92, 2001-02, and 2007-08.
Sources: Based on UN COMTRADE Statistics (trade data) and UNIDO database (production data).
During the first period only around 35% of market share changes were accounted for by China in the markets of five industrial countries and seven developing countries. During the 2000s the contribution of China versus all other developing countries increased to a level where 79% of market share gains of developing countries in the seven developing country markets and 73% of market share changes in industrial countries markets were accounted for by China. If these countries are taken as representative, about three quarters of market share increases of developing countries are accounted for by China alone. As pointed out above, this has been caused primarily by the deceleration of market share increases by non-China developing countries.
The reasons for the deceleration in market share gains of non-China developing countries are varied. In industrial country markets the deceleration of other developing country market share change rates are related in part to free trade agreements signed in the 1990s. NAFTA was signed between the US, Canada, and Mexico, which led to an initial spurt in the imports of the US and Canada from Mexico. Similarly for France and Germany, the inclusion of eastern European countries and Turkey into free trade arrangements during the 1990s also led to a spurt in imports from these countries, which are classified as developing. If we separate the impact of free trade agreements on market share changes of developing countries, the differences between the two periods become clearer (Table 2).
Table 2 Decomposition of changing manufactured import shares in industrial countries
Note: Data is based on two-year averages of 1991-92, 2001-02, and 2007-8.
Sources: Based on UN COMTRADE Statistics (trade data) and UNIDO database (production data).
A big chunk of market share gains during the 1990s resulted from one-off gains generated from FTAs. These increases were not maintained during the 2000s where both the FTA and other developing countries did little to increase their shares. Therefore, the 1990s were not representative for these markets.
The effect of China in market share changes is more dramatic in the markets of the seven large developing countries. China increased its market shares to around 18% p.a. during both periods. Non-China developing countries increased their market shares to about 7% p.a. during the 1990s, which decreased sharply to 2.4 p.a. during the 2000s. This latter rate is similar to their market share gains achieved in the markets of five industrial countries. However, this deceleration was not true for all groups of countries. Middle Eastern, south Asian, eastern European, and sub-Saharan African countries did not experience a deceleration. These countries’ exports constituted a smaller part of the imports of the seven developing countries.
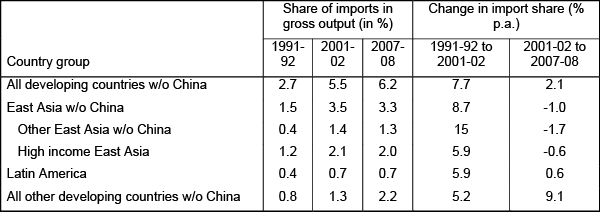
It is possible to separate the countries into three groups: developing countries in Latin America, countries in east Asia, and others. We separated east Asian countries into the high-income four – namely, South Korea, Singapore, Hong Kong, and Taiwan – versus all other east Asian countries (Table 3).
Table 3 Manufacturing import shares of seven developing countries from various developing country groups
Note: Data is based on two-year averages of 1991-92, 2001-02, and 2007-08.
Source: Based on UN COMTRADE and UNIDO Databases.
The countries that showed most deceleration were the countries in east Asia and Latin America. In east Asia, not only did their share of growth decelerate; their import shares actually decreased at about 1% p.a.
Given the dramatic increase in China’s export shares especially in other major developing countries, the question of whether other developing countries have managed to gain significant market shares in the Chinese market emerges. Alternatively, other Asian countries might have been selling thorough China where China became the final assembly point. The answer to both questions is no. While the market share of all other developing countries as a percentage of production of China increased marginally during the 1990s, it decreased significantly during the 2000s (Table 4). Thus while China was increasing its market share at about 18% p.a. in the markets of developing countries, these developing countries were losing market share in the Chinese market. Furthermore, all groups of countries were losing import market shares in China.
Table 4 China's manufacturing import share from developing countries
Note: Data is based on two-year averages of 1991-92, 2001-02, and 2007-08.
Sources: Based on UN COMTRADE Statistics (trade data) and UNIDO database (production data).
Part of the explanation could be that China’s production increased at rates even higher than its growth in trade, i.e. at about 31% p.a. during the 2000s. Both exports and imports to and from the rest of the world decreased as a share of demand (and output) during this period. China’s share of exports to the rest of the world as a percentage of gross output increased from 16.2% in 1991-2 to 24.2% 2001-02, and then decreased to 21.4% in 2007/08. Its share of imports in total production increased from 15.7% in 1991/92 to 19.5% in 2001/02, but decreased to 12.2% in 2007-08. Thus the dramatic increase in production was not led by international trade where its imports and exports are distributed equally between the industrial and developing countries, but by an expansion in domestic demand, as well as by import substitution.
In sum, developing countries have gained significant market shares in both industrial and other developing country markets throughout the 1990s and 2000s. However, China accounts for 79% of market share gains of developing countries in the markets of our seven large developing countries and 73% of market share increases in five industrial country markets during the 2000s. Therefore, recent increases in the industrial capabilities and competitiveness of developing countries can be considered predominantly a Chinese affair.
Authors’ note: We would like to thank Yilmaz Akyuz, John Baffes, Uri Dadush, Jose Sokol and Tercan Baysan for their useful comments.
References
Aksoy, A. and Ng, F. (2013a), Demand Growth versus Market Share Gains: Decomposing World Manufacturing Import Growth, World Bank Policy Research Working Paper, No. 6375, Washington DC: World Bank, February.
Aksoy, A. and Ng, F. (2013b), “Demand Growth versus Market Share Gains from World Import Growth,” Modern Economy, 4(6): 431-447, June.
Akyuz, Y. (2011), “Export Dependence and Sustainability of Growth in China,” China and World Economy, 19(1):1-23, January.
Akyuz, Yilmaz (2012), “The Staggering Rise of the South?” Research Papers 44, South Centre: Geneva, March.
Athukorala, P. (2011), “South-South Trade: An Asian Perspective,” ADB Economics Working Paper, No. 265, Manila: Asian Development Bank, July.
IMF (2011), “New Growth Drivers for Low-Income Countries: The Role of BRICs,” IMF Strategy, Policy and Review Department, Washington DC: IMF.
Ng, Francis and Alexander Yeats (2003), Major Trade Trends in East Asia: What are their Implications for Regional Cooperation and Growth? World Bank Policy Research Working Paper, No. 3084, Washington DC: World Bank, June.
OECD (2006), “South-South Trade: Vital for Development,” Policy Brief, OECD Observer, August.
UNCTAD (2002, 2005), Trade and Development Report, Geneva: UNCTAD.
World Bank (2004, 2005, 2007), Global Economic Prospects, World Bank publication, Washington DC: World Bank.
1 China accounted for almost 31% of manufacturing exports from all developing countries (14% of world exports) in 2007/08. This ratio was 18% in 2001/02 and only 14% in 1991/02. China has an even bigger share of 44% in 2007/8 of all developing country manufacturing exports to industrial countries. See (Akyuz 2011; 2012; Athukorala 2011) for China and south-south trade.


