Across the world, countries have responded to the COVID-19 pandemic with the introduction of restrictions on mobility, travel, and social contact. In the run-up to the adoption of these measures there were widespread reports of people engaging in panic buying, with resulting shortages raising concerns about the sustainability of the food system and people's ability to access the products they need. Google search data indicates sharp increases in searches for terms such as “panic buying” and for necessities such as “toilet paper” across many countries (Keane and Neal 2020), and several papers that use financial transaction data to track the effects of the pandemic on consumer spending have highlighted a pre-restriction spike in grocery spending (e.g. Baker et al. 2020, Cox et al. 2020, Hacioglu et al. 2020). However, little is known about what types of products were hoarded, how widespread hoarding was, and what margins of purchase behaviour drove demand spikes. In a new paper (O’Connell et al. 2020), we use household-level scanner data for the UK to document purchase dynamics during the pandemic.
Rapidly rising COVID-19 cases and the expectation of curbs on movement in the early stage of the pandemic provided a rationale for consumers to build up their stocks as a precautionary measure against, for instance, the need to quarantine or significant supply disruptions. In addition, knowledge that other consumers were in a similar position provided an additional incentive to purchase before stocks ran out. In the UK, unusually high demand for essentials led to calls from senior politicians for people to behave responsibly, to supermarkets imposing limits on the quantity of individual products that consumers were permitted to buy per visit, and to the UK competition authority relaxing competition rules.
In our paper, we document purchase dynamics using household level scanner data, covering fast-moving consumer goods (i.e. grocery products, including food, alcohol and non-foods). We use data on the purchases of a nationally representative panel of 17,000 households. These data have a number of key advantages for measuring hoarding behaviour over other real-time datasets covering consumer spending. The data record information on the disaggregate products that consumers purchase, including quantities and number of packs bought, as well as long purchase histories for households that cover pre-pandemic behaviour. Using this dataset, we establish four sets of results regarding consumer purchase dynamics on the run-up to the UK's national lockdown on 23 March 2020.
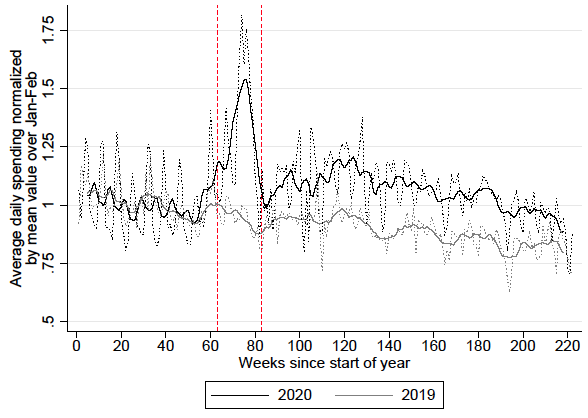
First, we show that there were large spikes in spending on storable products in the four weeks preceding lockdown. Figure 1 shows the evolution of daily expenditure between 1 January and 9 August in 2019 and 2020 on staples (such as canned goods, pasta, rice and grains) and household supplies (such as soap, cold treatments, and toilet tissue). The two vertical red lines denote the day in 2020 that the UK government published its coronavirus action plan and the beginning of lockdown. Spending on staples rose sharply at the end of February, peaking on 14 March at over 80% of the January and February daily average.
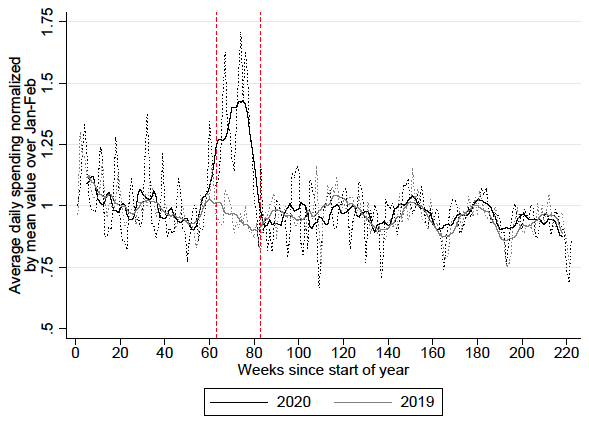
A similar pattern is evident for non-food household supplies (such as soap, cold treatments, and toilet tissue), with demand peaking at over 70% of January and February levels on 14 March. Spending on the remaining set of fast-moving consumer goods (discretionary calories and perishable foods) increased much more gradually into March and continued to rise as the UK entered the lockdown period.
Figure 1 Average daily spending
(a) Staples
(b) Household supplies
Notes: Each panel shows total daily expenditure on staples and household supplies, discretionary calories, and perishables. Solid lines show smoothed daily expenditure, dotted lines show non-smoothed daily expenditure after day of the week and holiday effects are removed. In each case the line is normalized by the mean value over January and February. The vertical red lines indicate the announcement of UK's Coronavirus action plan on March 3, and the beginning of lockdown on March 23.
Source: O’Connell et al. (2020).
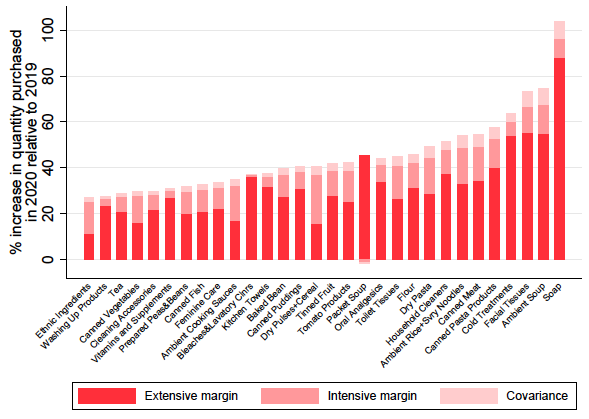
Second, we identify which product categories were the primary drivers of these increases in spending and the extent to which quantity spikes at the category level were driven by changes in purchase frequency (extensive margin), or in the average quantity bought, conditional on purchasing (intensive margin). Figure 2 shows the increase in demand for 30 categories in the four weeks up to 23 March in 2020 relative to 2019. These 30 product categories, out of a total of 138, experienced an increase in demand of more than 25%; they account for 70% of the increased spending on household supplies and 53% of the increase for staples.
Figure 2 also decomposes these demand spikes into changes in purchase frequency, and average quantity bought conditional on purchasing. Across these categories, on average, 70% of the demand increase was due to increased purchase frequency. The increase in purchase frequency was relatively more important for those categories that experienced the largest increases in demand. This increase at the extensive margin was mainly driven by more households than normal choosing to buy these categories once over the ‘hoarding period’ preceding the lockdown in late March, rather than an increase in the number of times purchasing households bought them. Although there was a small increase in the number of trips that households made to the store over this period, this increase was not enough to explain the higher purchase frequency for storable categories. Instead, households were more likely to buy storable products when they did visit a store. This suggests that further spates of hoarding could still occur, even though households are now making fewer trips than they did prior to the pandemic.
Figure 2 Quantity increase across 30 most affected categories
Notes: For each category we compute the mean quantity purchased (across household-dates) over the four-week period ending March 22 in 2019 and 2020. The bars show the percentage change between these two periods, decomposing the increase into changes due to the extensive margin, intensive margin and a covariance term.
Source: O’Connell et al. (2020).
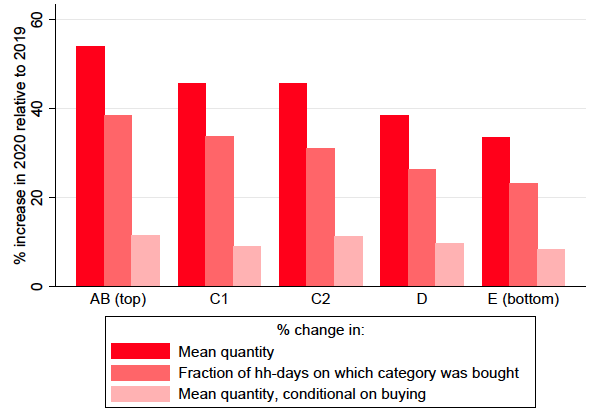
Third, we show that across socioeconomic groups, there was a sharp increase in the quantity purchased of all storable categories, underlining that hoarding was a widespread phenomenon. However, as shown in Figure 3, the average increase was substantially bigger for higher socioeconomic status households: those in the top group increased purchases by 55% across the 30 most affected categories, compared with 30% for the bottom group. This pattern is entirely driven by differences along the extensive margin, with higher SES households increasing their probability of buying by more than lower SES households. Wealthier households were therefore able to build up larger precautionary stocks than less well-off households.
Figure 3 Average change in product categories, by socioeconomic group
Notes: The figure shows the unweighted mean percentage change in quantity, fraction of household-days on which the category was bought, and quantity conditional on buying across the top 30 categories shown in Figure 2 for each socioeconomic group.
Source: O’Connell et al. (2020).
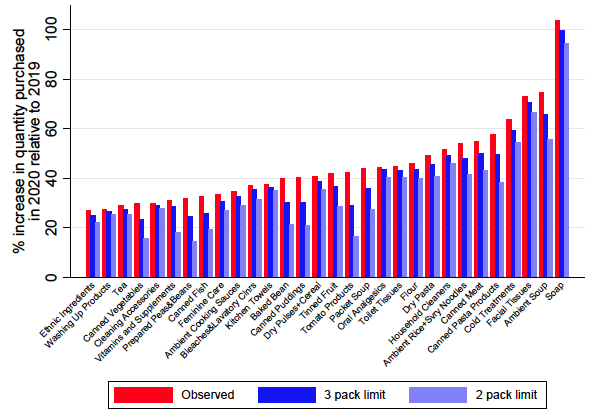
Fourth, we consider the likely impact of limiting the number of units of each product that households are permitted to purchase on a visit to the store. These limits were imposed by supermarkets following the demand spike just prior to the UK's lockdown. Figure 4 shows what the quantity spikes in the 30 most affected categories would have been had either a two- or three-unit limit been in place for the four weeks up to lockdown, and had households made no adjustment to their behaviour to circumvent the constraint. Under a two-unit limit the average increase in quantity across the 30 categories would have been 34% rather than 44%. Among the eight categories that experienced spikes of more than 50%, the average quantity increase would have been 55%, rather than 66%. This suggests that re-introducing limits may have only a modest impact on preventing a further round of hoarding and shortages.
Figure 4 Change in quantity spikes under counterfactual quantity limits
Notes: The red bars show the percentage increase in quantity purchased for each category between the four-week period ending March 22 in 2020 compared with the same period in 2020. The dark and light blue bars show the analogous, counterfactual increases if households were limited from buying no more than 3 and no more than 2 packs per transaction, respectively.
Source: O’Connell et al. (2020).
A central lesson from this work is that the huge increase in demand for certain products during the first COVID-19 wave was driven not by a few extreme purchasers, but many more households than usual choosing to buy these products. This is in line with panic buying in different settings, for instance following the 2011 earthquake in Japan (Hori and Iwamoto 2014). Resurgent COVID-19 case numbers and the prospect of more stay-at-home orders mean that further bouts of hoarding are a distinct possibility. Quantity limits are unlikely to be effective in preventing shortages. Another policy implemented in March was to have dedicated shopping hours for the elderly and other vulnerable consumers. If these were timed to coincide with deliveries of new stock, then this could help ensure vulnerable people get the supplies they need.
References
Baker, S R, R A Farrokhnia, S Meyer, M Pagel, and C Yannelis (2020a), “How Does Household Spending Respond to an Epidemic? Consumption During the 2020 COVID-19 Pandemic”, Review of Asset Pricing Studies 35 (forthcoming).
Cox, N, P Ganong, P Noel, J Vavra, A Wong, D Farrell, and F Greig (2020), “Initial impacts of the pandemic on consumer behavior: Evidence from linked income, spending and savings data”, Brookings Papers on Economic Activity.
Hacioglu, S, D Känzig, and P Surico (2020), “Consumption in the time of COVID-19: Evidence from UK transaction data”, CEPR Discussion Paper 14733.
Hori, M and K Iwamoto (2014), “The Run on Daily Foods and Goods After the 2011 Tohoku Earthquake”, The Japanese Political Economy 40(1): 69–113.
Keane, M and T Neal (2020), “Consumer panic in the COVID-19 pandemic", Journal of Econometrics (forthcoming).
O’Connell, M, A de Paula and K Smith (2020), “Preparing for a pandemic: Spending dynamics and panic buying during the COVID-19 first wave”, CEPR Discussion Paper 15371.
