At its launch, the Doha Round was dubbed the Round for the ‘Developing Countries and for the protection of the environment’ as it was to create a triple-win situation, for trade, for development, and for the environment by the reduction or elimination of tariff and non-tariff barriers on environmental goods and services. So far, as the ministerial conference is approaching, the only progress has been from Asia-Pacific Economic Cooperation (APEC) members at a meeting last September where they agreed on a list of 54 products (i.e. 54 HS six-digit codes) on which they would reduce tariffs by 2015.
Why so little progress on the multilateral front?
One explanation could be strategic behavior (a bargaining chip in a framework where negotiations are multi-dimensional). Recent evidence (Balineau and de Melo 2011 and 2013) suggests three other factors:
- First, there are inherent ‘technical’ difficulties in identifying environmental goods.
Broadly speaking, one can classify environmental goods as either: goods for environmental management or environmentally preferable products. The current Harmonized System is ill-suited to help implement such a classification. For goods for environmental management the problem is multiple end-use, which could be partially resolved but at great implementation cost for developing countries (Steenblik et al. 2005). For environmentally preferable products, the problem is ‘relativism’ as what is environmentally ‘friendly’ is difficult to define requiring the completion of a life-cycle assessment that includes production, use, and disposal of the product. Furthermore, most environmentally preferable products have conventional products as substitutes, so the burning issue of ‘like products’ must also be dealt with.
- Second, countries had different perceptions of environmental goods, and especially what was in their interests.
This led them to the proposal of different approaches to reduce tariff and non-tariff barriers – as well as different products on their lists for supporters of the ‘list approach’. The list approach was mainly suggested by industrialised countries while developing preferred a ‘request-and-offer’ approach à la the GATT old days or an ‘integrated approach’ in which national authorities select projects thereby addressing the multiple-uses issue raised by the list approach.1
- Third is mercantilistic behavior.
Once dispelled the possibility that progress might have taken place unilaterally, by studying the submissions by those who opted for the list approach, we show that countries behaved in typical mercantilistic fashion. With relatively low rates of protection in environmental goods across-the-board, this bodes ill for those who hope for a breakthrough at the next ministerial meeting.
Any Unilateral Reduction in protection?
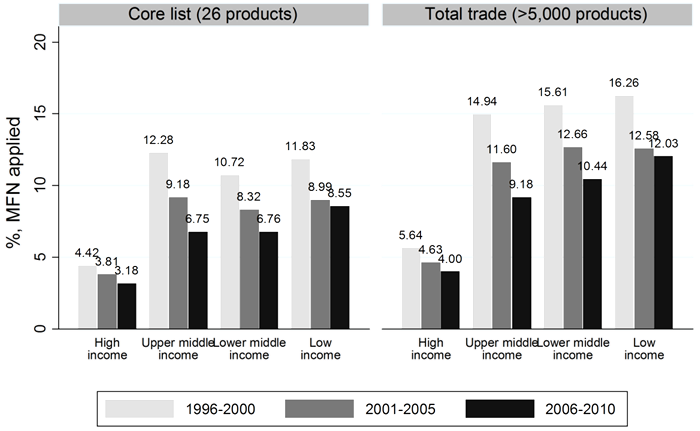
On the off chance that countries might have reduced protection unilaterally, Figure 1 compares tariff reductions by income group for a core list of 26 products drawn by Australia, Colombia, Hong Kong, Norway and Singapore from the WTO ‘combined’ list of 411 products – the union of the six different lists submitted by developed countries (plus Philippines) – as a ‘starting point’ for discussion towards a credible core list of environmental goods.2 The data show a steady decline in tariffs across income groups, but no larger reduction for environmental goods. For all income groups, environmental goods are less protected on average than other goods (reflecting the opposition to protection from final goods users, see Cadot et al. 2005). Also protection of environmental goods remains highest in the low-income group. But with average tariffs in the 10-15%, this was barely high enough for a bilateral barter among developing countries by a request-and-offer approach to be rewarding as it had been in the early days of the GATT (Baldwin 2010). As to developed countries, average tariffs were around 5%, so their expected gains from participation in the negotiations would be from reduction in tariffs by developing countries.
Figure 1. Evolution of the average rate of protection in environmental goods and total trade, 1996-2010
Source: Balineau and de Melo, 2013 (Figure 2).
Exclusion of goods with tariff peaks from submission lists
For countries that submitted lists, the selection of goods could have been governed by a combination of overall efficiency considerations and by the narrower interests of pressure groups. If the selection of goods had been governed by efficiency considerations, the lists would have included either (or both) goods with high tariffs and/or goods in which the country has a comparative advantage. Excluding goods with peak tariffs would then largely reflect a mercantilistic position.
We compared Revealed Comparative Advantage indices and tariff peaks for environmental goods and for all goods for countries that submitted lists of environmental goods and for a group of non-submitters, studying both individual lists submitted by the US, the EU, Japan, and so on, and the characteristics of the final result i.e. the ‘combined list’ of 411 products (the union of individual lists).
Consider first the selection process leading to each individual environmental list; both statistical and econometric approaches led us to conclude that, as expected under mercantilistic behavior, high-income countries did not propose highly protected goods. For example, Canadian average effectively applied (unweighted) tariffs reach 3.6% for all goods versus 1.3% for the 164 environmental goods submitted. Similar pattern holds for the EU, Japan, Korea, Taiwan, the US and Philippines. We found that average protection is negatively correlated with the probability of being included in the high-income countries’ lists, especially the Japanese, the US and the EU lists, though the opposite holds for the lists submitted by Qatar and Saudi Arabia. As to comparative advantage, submitters usually had a large share of their submitted environmental goods with an revealed comparative advantage of more than one (less than 10% for Philippines, New Zealand, Saudi Arabia and Taiwan, but around 20% for Canada and Qatar and up to 45-50% for Japan and the US; and, finally, 78% for the EU).
The combination of these individual submissions patterns led the ‘combined list’ of 411 products to have interesting characteristics to study to understand the stalemate at the negotiations under the WTO Committee of Trade and Environment in Special Session especially when we compared submitters and a group of emerging countries that did not adhere to the list approach (and, a fortiori, that did not submit a list).
Indeed, further inspection of this combined list that should serve as a starting point to continue discussions under the WTO Committee of Trade and Environment in Special Session shows that:
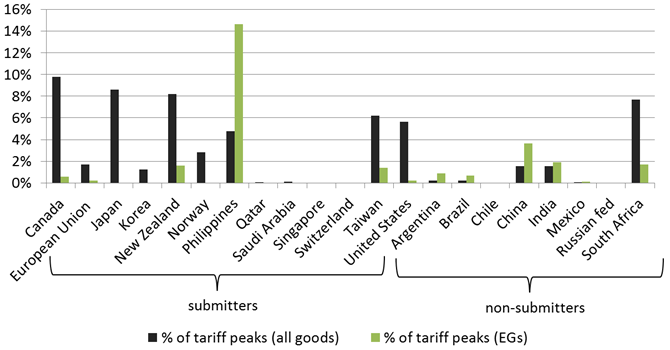
- Submitters had a lower percentage of goods with tariff peaks on the environmental goods list than on their respective total goods lists while the opposite pattern often holds for non-submitters (Figure 2).
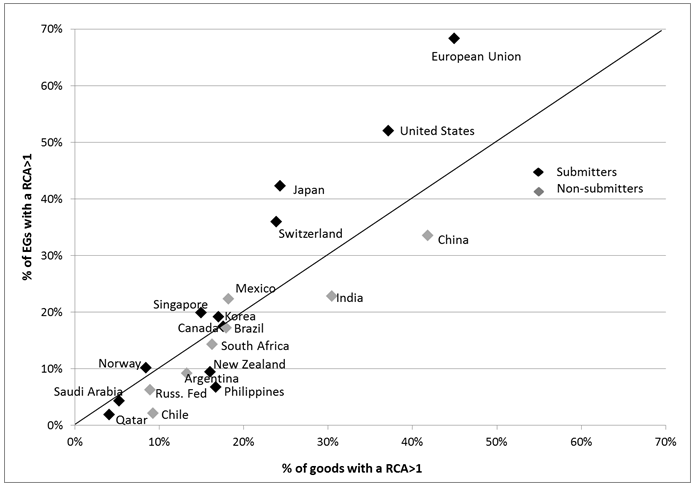
- The high-income countries who participated had a comparative advantage in the goods selected on the combined list they constructed with non-participation clearly revealed by Figure 3 as all non-participants are below the 45° line.
- China and Mexico could have been expected to participate as they had high shares of goods with an revealed comparative advantage of more than one.
- With developing countries overwhelmingly below the 45° line, the pattern gives support to the often-heard complaint by developing countries that goods in the environmental goods list are of little export interest to them.
Figure 2. Tariff peaks in environmental goods versus total trade (2007)
Source: Balineau and de Melo, 2013, Table 2.
Figure 3. Comparative advantage in environmental goods versus overall comparative advantage (2007)
Source: Balineau and de Melo, 2013, figure 4. Countries above (below) the 45° line have a larger (smaller) proportion of goods with a comparative advantage in EGs than in the overall distribution of comparative advantage across all products. Differences in proportions are statistically significant (see Balineau and de Melo 2013, Table 2).
Mercantilism with no security valve
The combination of a small pittance on the table (average effective tariffs in EGs was less than for all goods) and the straightjacket of participation by all led to the current stalemate in the multilateral negotiations while APEC members agreed on a list of 54 environmental goods (all on the WTO ‘combined list’ of 411 products) on which they would reduce tariffs to 5% or less. The mercantilistic approach observed at the Doha negotiations was also evident in the APEC declaration as APEC members accounted for 70% of world exports for the products in this list. And if this combined list could be construed as approximating a comprehensive list of environmental goods, then the major developing countries that might have been expected to participate in the submission of lists had a smaller proportion of goods than those who participated, confirming their perception that a list approach would end up mostly reflecting the comparative advantage of high-income countries. In the end, with average tariffs for environmental goods close to three times higher for developing countries compared with high-income countries, reciprocal trade gains would be from bilateral reductions between developing countries. However, overall, it is the developed countries that generally have a comparative advantage in environmental.
This outcome is all the more regrettable as recent research suggests that the elimination of protection on environmental goods would help technology transfer towards developing countries. From an inspection of a large sample of Clean Development Mechanism projects, Schmid (2012) shows that projects are more likely to have a technology transfer component when host countries’ tariffs are low and estimates that a 10% increase in the applied most favoured nation tariff rate on environmental goods is associated with a three-percentage-point decrease in the likelihood of technology transfer in a project.
References
Baldwin, R (2010), “Understanding the GATT’s Wins and the WTO’s Woes”, Policy Insight 49, CEPR, London.
Balineau, G and J de Melo (2011), “Stalemate at the Negotiations on Environmental Goods and Services at the Doha Round”, Ferdi Working Paper 28.
Balineau, G and J de Melo (2013), “Removing Barriers to Trade in Environmental Goods: An Appraisal”, World Trade Review, forthcoming.
Cadot, O ,J de Melo and M Olarreaga (2005), “Lobbying and the Structure of Protection in Rich and Poor Countries”, The World Bank Economic Review 18(3), 345-366.
Schmid, G (2012), “Technology transfer in the CDM: the role of host-country characteristics”, Climate Policy 12(6), 722-740.
Steenblik, R (2005b), “Liberalising Trade in ‘Environmental Goods’: Some Practical Considerations”, OECD Trade and Environment Working Papers, No. 2005/05, OECD Publishing, doi: 10.1787/888676434604.
1 In fact, members also considered other variants including ‘hybrid’ approaches combining all three approaches and multiple lists to preserve preferential market access for LDCs.
2 Based on WTO Room document circulated on 17 March 2011 without prejudice by Australia; Colombia; Hong Kong, China; Norway; and Singapore.


