The recovery instrument Next Generation EU (NGEU) aims to repair the immediate economic and social damage brought about by the coronavirus pandemic and make Europe greener, more digital, more resilient, and more fit for the current and forthcoming challenges (European Commission 2020a). It is a temporary instrument to boost the EU’s long-term budget (the multi-annual financial framework, 2021-2027). Designed in response to the Covid-19 pandemic, one of the main elements of NGEU is the Recovery and Resilience Facility (RRF), which aims at providing large-scale financial support to sustainable reforms and related public investments with the explicit long-run goal to support green investment, digitalisation, and resilience more broadly (Verwey et al. 2020).
In a new paper (Pfeiffer et al. (021), we provide a stylised quantitative assessment of NGEU investment. Simulating NGEU for the EU and all member states requires a specially adapted model. The starting point is the European Commission’s QUEST model. QUEST incorporates the main features relevant for fiscal policy transmission, such as Keynesian price and wage rigidities and liquidity-constrained households. To assess the macroeconomic impact of NGEU, we extend this core framework along three main dimensions. First, we incorporate key elements of NGEU: grant allocations, favourable RRF loan conditions, and new debt issued by the EU with stylised (but explicit) repayment assumptions. Second, we include detailed public investment dynamics with construction delays.1 Finally, the setup is embedded into a large-scale multi-country structure. In this setup, rich trade linkages and financial markets (e.g. exchange rate movements) link each of the 27 countries and the rest of the world to all other economies. This approach allows for a careful assessment of spillover effects in the highly integrated EU economy.
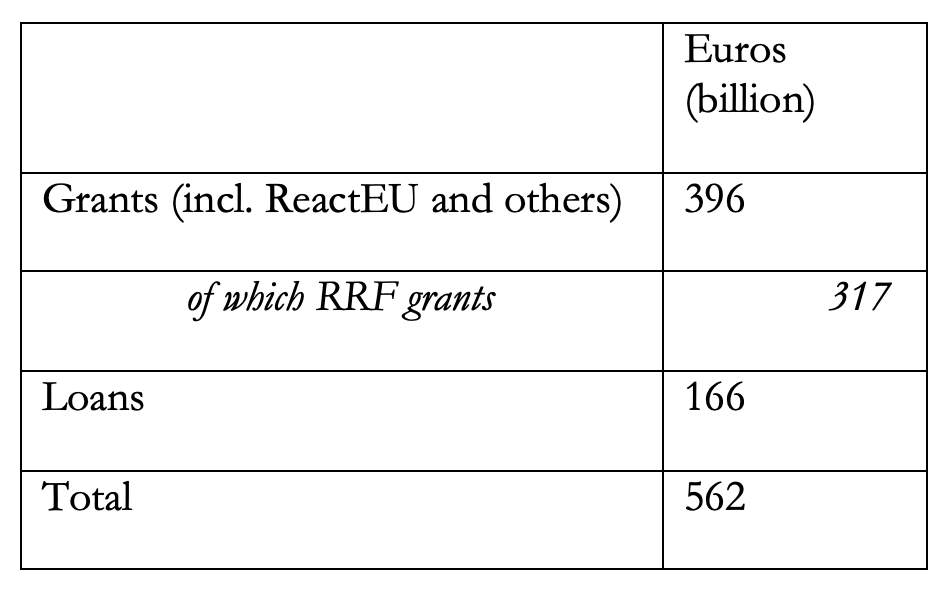
Modelling NGEU requires several simplifying assumptions. First, the total simulated package amounts to around 4% of EU GDP. Of this, €396 billion are grant instruments, with country-specific shares following the RRF allocation key.2 The simulations account for €166 billion in RRF loans, based on requests by seven member states (as of July 2021). Second, the analysis considers two stylised spending profiles - a four-year fast scenario (2021-2024) and a six-year profile (2021-2016) for all member states. Third, the use of all NGEU grants and half of the loans (50% additionality) for productive public investment, with productivity assumptions in line with the literature.3 Fourth, all member states repay the EU-wide debt from 2027 to 2058 based on current Gross National Income (GNI) shares. Member states receiving RRF loans repay those from 2031 until 2050.4 Fifth, this assessment does not quantify the impact of reforms (see below).
Table 1 Apportioning across Next Generation EU instruments (for modelling purposes only, in 2019 prices)
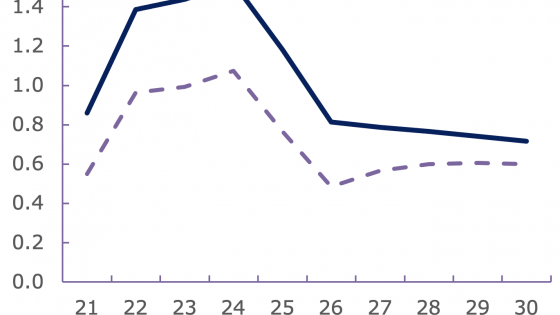
Figure 1 EU real GDP effects of Next Generation EU (%)
Notes: This graph reports the level of real GDP in percent deviation from a no-NGEU baseline assuming a high productivity of public investment and a fast NGEU spending profile spanning four years. The dark line shows simulation results for a simultaneous investment stimulus (NGEU). The dashed line displays a synthetic EU-wide GDP (weighted average) obtained by aggregating stand-alone 27 simulations with unilateral stimulus in each country.
Source: Pfeiffer et al. (2021).
Based on these assumptions, the simulations highlight the substantial growth effects of NGEU investments (Figure 1). For a fast NGEU scenario (four years), with evenly distributed spending between 2021 and 2024, we find that the level of real GDP in the EU can be around 1.5% higher than without NGEU investments (in 2024). As public capital is productive, the additional investment boosts demand and increases potential growth. The latter supply-side effects last beyond the implementation and lead to large long-run multipliers. Even in 20 years’ time, EU GDP could be around 0.5% higher than without NGEU investment.5
Improved labour market conditions accompany the favourable GDP dynamics. During its period of operation, NGEU investment is estimated to increase employment by up to 1%, compared to the no-policy change baseline. In the medium-run, substantial and persistent real wage gains reflect improved labour market conditions and productivity gains.
Figure 2 EU real GDP effects of Next Generation EU (%): Sensitivity analysis
Notes: This graph reports the level of real GDP in percent deviation from a no-NGEU baseline for a six-year NGEU profile. Dark (dashed) lines show results for a high (low) productivity calibration; dotted line shows simulations without effective lower bound assumptions.
Source: Pfeiffer et al. (2021).
Which factors explain these significant expansionary effects? Around one-third of this impact comes from spillover effects, pointing to the benefits of coordinated expansion. Limited import leakage increases the effectiveness of this policy: since all countries expand, not only imports will increase but also exports. A simple aggregation of individual effects of the member states’ plans would thus substantially underestimate the macro effects of NGEU (dashed line in Figure 1 and the decomposition in Figure 3).
Besides spillovers, several interrelated factors further contribute to these substantial GDP effects. To help quantify these channels, Figure 2 presents three additional scenarios as sensitivity analysis. The first scenario shows that the macroeconomic impact remains substantial even for a six-year profile, reaching 1.2% in 2026 and leading to a similar long-run impact. Second, at the current juncture, the policy interest rate at the effective (zero) lower bound implies at least a partial monetary accommodation, limiting crowding-out effects in private consumption and business investment. In ‘normal times’, away from the lower bound, the short-run output impact is somewhat smaller (dotted line). Third, assumptions about the productivity of public capital have a large impact on estimates.6 While sizeable effects remain under more pessimistic assumptions, the growth impact appears substantially lower but still significant when public investment is allocated to less productive uses (dashed line). This result is particularly visible in the medium to long run when the productivity effects unfold. This underlines the importance of the focus on high-quality investment.
Decomposing GDP effects into direct effects and spillovers reveals strikingly different patterns across member states, as displayed in Figure 3. By design, NGEU strongly supports convergence within the EU economy, thereby counteracting the divergences that the Covid-19 crisis risks unleashing. Given the allocation key, the strongest growth effects appear in economies with below-average GDP, and those hit hardest by the crisis. For example, for a four-year stimulus and a high productivity calibration, the simulated output gains in 2024 reach more than 4% in Greece, around 3¾% in Bulgaria, Croatia, and Romania, and around 3% in Italy and Portugal. For these countries, the role of spillovers is smaller (dashed bars) because their trade partners receive smaller allocations and their economies tend to be less integrated into value chains and trade networks.
Figure 3 GDP effects of Next Generation EU investments across member states (%)
Notes: The graph shows peak effects on real GDP in 2024 expressed in percent deviation from a no-policy change baseline for a fast NGEU profile spanning 2021-2024 under high productivity. Dark bars show simulation results for the stand-alone simulations of the national plans. Spillovers (dashed bars) are defined as the difference between the coordinated simultaneous NGEU stimulus in all member states and the stand-alone simulations of the national plans.
Source: Pfeiffer et al. (2021).
Beyond the direct impact of their own national envelopes, countries will also benefit considerably from the effects of NGEU investments in other member states, mainly through trade flows and exchange rate movements. This finding suggests that focussing only on the allocation of funds and ignoring cross-border spillover effects can substantially underestimate the macroeconomic impact. Spillovers are central for small open economies with smaller grant allocations. In these cases, the positive effects coming from other member states’ plans account for the bulk of the GDP impact. However, also for larger economies with deep trade integration, such as Germany, spillovers account for more than half of the sizeable GDP effect.
In sum, the simulations underline the significant impact of NGEU and its potential to lift Europe’s economies onto a significantly better recovery path in terms of both GDP and labour market conditions. If implemented swiftly, with a strong focus on high-quality public investment and additionality, NGEU gives a substantial boost to the recovery in all member states. At the same time, positive spillover effects are most relevant for small and open economies. Moreover, the model analysis stresses that high-quality public investment can significantly boost potential output beyond the implementation period and thus also contribute to addressing medium-term challenges such as climate change and digitalisation.
Finally, note that the analysis presented here has abstracted from country-specific details of the national recovery and resilience plans (RRPs) (such as the precise timing of the spending and the type of it), leaving these important aspects for future research. Also, while the simulations cover NGEU investments in a stylised manner, they do not include the possible positive impact of reforms, which is difficult to quantify, but which can add substantially more to the GDP and employment effects in the long run. In this regard, a model-based benchmarking exercise shows that undertaking reforms that would result in halving the gap vis-à-vis best performers in terms of structural indicators could raise GDP substantially in member states, on average by 11% in 20 years’ time (Varga and in 't Veld 2014). This illustrates that the overall benefits from NGEU including reforms could be even larger than the gains from investment shown here.
References
Bańkowski, K, M Ferdinandusse, S Hauptmeier, P Jacquinot and V Valenta (2021), “The macroeconomic impact of the Next Generation EU instrument on the euro area”, ECB Occasional Paper No. 2021/255.
Bom, P and J Ligthart (2014), “What Have We Learned From Three Decades Of Research On The Productivity Of Public Capital?”, Journal of Economic Surveys 28: 889-916.
European Commission (2020a), “Identifying Europe’s recovery needs”, SWD (2020) 98 final.
European Commission (2020b), “European Economic Forecast Autumn 2020”, European Economy Institutional Paper 136.
Leeper, E M, T B Walker and S-C S Yang (2010), “Government Investment and Fiscal Stimulus”, Journal of Monetary Economics 57: 1000–12.
Pfeiffer, P, J Varga and J in ’t Veld (2021), “Quantifying Spillovers of NGEU investment”, European Economy Discussion Papers No. 144.
Varga, J and J in 't Veld (2014), “The Potential Growth Impact of Structural Reforms in the EU: A Benchmarking Exercise”, European Economy Economic Papers No. 541.
Verwey, M, S Langedijk and R Kuenzel (2020), “Next Generation EU: A recovery plan for Europe”, VoxEU.org, 09 June.
Endnotes
1 This approach follows Leeper et al. (2010).
2 Besides the RRF grants, the total NGEU grant volume includes other instruments such as ReactEU, Just Transition Fund, Horizon Europe, InvestEU, Rural Development, and RescEU. See Pfeiffer et al. (2021) for the applied allocation keys.
3 In the simulations, non-additional loans finance general spending (which would take place anyway) but are repaid in full, thereby reducing the debt burden. Concerning the productivity assumptions, the main scenarios calibrate the output elasticity of public capital based on a meta-study. Sensitivity analysis also considers a lower productivity scenario. See Bom and Ligthart (2014).
4 All repayments follow a linear schedule and assume lump-sum contributions.
5 These results are broadly in line with previous Commission estimates using the QUEST model (European Commission 2020a, 2020b). Similarly, the ECB’s EAGLE model analysis finds that NGEU could increase real GDP in the euro area by around 1.5% over the medium term. Both studies have underlined the importance of productive public investment. See Bańkowski et al. (2021).
6 This low productivity calibration applies a reduced output elasticity in line with the lower bound in Leeper et al. (2010).


