Over the last two decades, the international economics literature has been focusing on evaluating the inflence that governments exercise on trade. With general movement towards deregulating the global market, understanding the consequence of such measures is crucial. It is, without much debate, acknowledged that countries (or firms) tend to self-select into trading internationally. This is often decided as they evaluate their own potential to benefit from trade. This potential, in turn, is directly related to a series of individual characteristics, such as GDP (total assets), capital-to-labour ratio (productivity), and partner characteristics such as whether it shares the same language or a border. Importantly, the potential for benefiting from trade is inversely related to the geographical distance to the trading partner. These factors have built the basis for the so-called gravity equation, first introduced by Tinbergen (1962), which has acted as a workhorse for international trade models ever since.
With all these factors cumulatively explaining the lion's share of the trade happening between two countries, not many ways are left for governments to control such cross-border transactions. However, the one instrument at hand to shape trade to a certain extent is the materialisation of economic preferentialism. This usually takes the form of a preferential trade agreement (PTA).
The econometric problem with estimating the effects of preferentialism is, however, that PTAs are meant to stimulate trade, and, according to economic theory, they have greater benefits for natural trading partners than otherwise (Frankel et al. 1996, Baier and Bergstrand 2004, Egger and Larch 2008). While earlier work used a log-linear index regression approach for the identification of partial PTA treatment effects conditional on observables (Aitken 1973, Soloaga and Winters 2001), more recent work has resorted to non-parametric estimation techniques (e.g. Egger et al. 2008, Baier and Bergstrand 2009, Egger and Tarlea 2017). These latter papers prominently pave the way for a new literature using non-parametric estimators to evaluate the effect of preferentialism on trade. Egger et al. (2008) use a difference-in-difference matching approach and find particularly strong effects on intra-industry trade. Baier and Bergstrand (2009) use matching on a host of metrics to compare bilateral trade between country pairs party to a signed PTA with very similar country pairs without one. The similarity is evaluated on the basis of the standard gravity covariates, such as GDP, common language, adjacency, and distance. They find that estimates obtained through non-parametric approaches are much more stable across different years, and return more economically plausible magnitudes compared to the typically estimated linear gravity equations.
Although non-parametric estimation is relatively flexible and assumes much less than parametric estimators, one potentially problematic assumption is still made. In order to non-parametrically estimate the average treatment effect (ATE) of PTAs, all studies so far implicitly assume treatment homogeneity – that is, any two countries bounded by a PTA have qualitatively an identical status, all else equal. In reality, however, no two PTAs are identical. This violates the assumption of treatment homogeneity and leads to inexact inferences of the impact of each such agreement on its respective bilateral trade.
One PTA-specific characteristic that has been consistently ignored as a trade determinant by the international trade literature is the duration of negotiations of each PTA. One notable exception is Moser and Rose (2012), who look at negotiations’ duration the other way around, i.e. aiming to identify its causes. Our study aims to fill this gap, and unveils a negative robust causal relationship between the suspense generated during (or for the duration of) negotiations and the anticipation effect this has on trade between countries directly involved.
Quick look into PTA negotiations duration
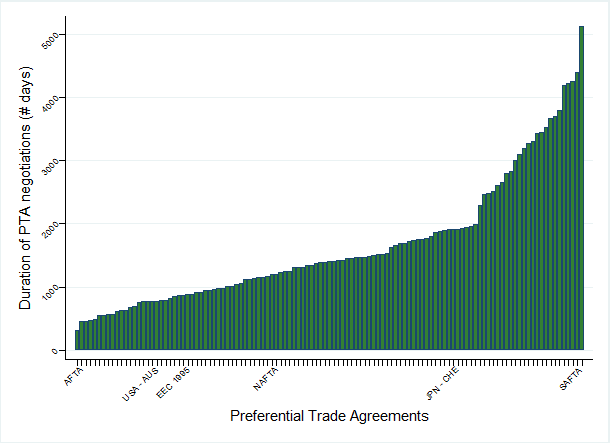
Figure 1 plots all PTAs (bilateral or multilateral) that have been notified to the WTO and came into force between 1988 and 2014. As is the case with multilateral agreements (say, NAFTA), the one agreement unit expands to importer-exporter dyadic units (in this case US-Mexico, US-Canada, and Canada-Mexico). In this example, the corresponding negotiations duration is 1195 days, so just over three years. This is calculated based on the date the negotiations of this PTA were first publicly announced and the date they were concluded.
Figure 1 All PTAs notified to WTO, 1988-2014
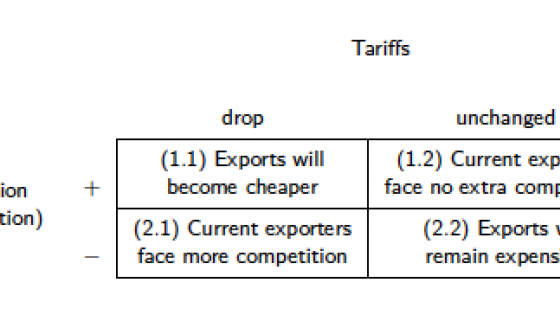
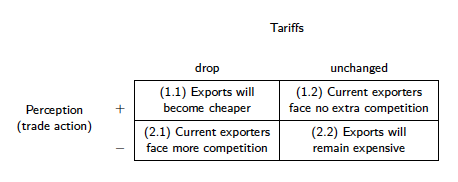
Now, we wonder what exactly happens during those negotiations. We kind of know what policymakers do. Over different rounds, the parties involved negotiate import and export tariff levels. In the meantime, though, there are firms that make decisions about their production, domestic sales, and international sales. All they know is the current tariff level, which may decrease or may remain unchanged. The uncertainty of what goes on behind the scenes at the negotiation table generates a lot of suspense and forces firms to speculate. Firms may interpret each of these two potential outcomes in a positive way (leading them accelerate trade) or a negative way (and slow down trade). Thus, the start of negotiations generates a 2x2 decision (read speculation) matrix for the average firm, as shown in Figure 2.
Figure 2 Speculation matrix
Two potential scenarios can unfold: either tariffs drop, or they do not. If they drop, firms could anticipate exports will become cheaper and already accelerate trade (1.1), or they could slow down trade for fear that more competition will arise (2.1). The opposite stands for constant tariffs (1.2 and 2.2).
Estimation and results
This study remains methodologically in the area of non-parametric estimation of PTAs on trade, but the heterogeneity of treatment, as well as its continuous form, requires a departure from standard procedures. Hirano and Imbens (2004) propose a model that accounts for continuous multivalued treatments, yet the one shortcoming of this model is that it relies on the assumption that the treatment intensity conditional on covariates is drawn from a normal distribution. With data structures such as ours, where many units are not treated (i.e. country pairs never negotiating a PTA), there is a non-zero probability mass at zero.
As an extension to the Hirano and Imbens (2004) model, Cerulli (2014) proposes an econometric model for estimating dose-response functions through a regression approach when treatment is continuous. Specifically, it models the dose response-function as approximated by a third-degree polynomial (see Tarlea 2018 for how it can be used to formally model trade). In our context, if we imagine a country pair not negotiating a PTA as the control unit, a country pair starting to negotiate a PTA as the treated unit, and the number of days it takes until it reaches an agreement as the intensity or the dose of treatment it receives, we can model the yearly growth rate in bilateral exports as a dose-response function.
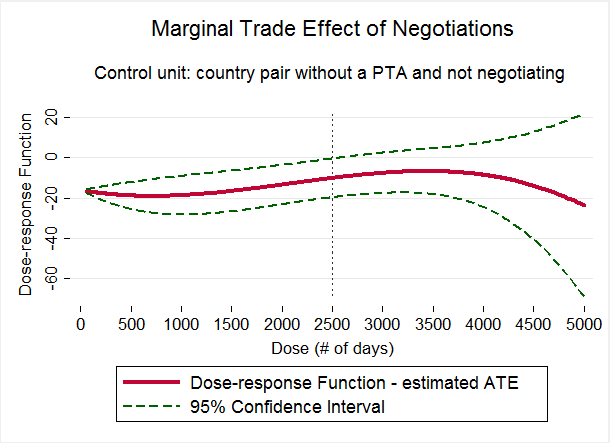
Figure 3 Marginal trade effect of negotiations compared to non-negotiation
Note: The control unit in this instance is a country pair without a PTA nor currently negotiating.
The dataset producing these results contains 119 PTAs, with negotiation duration ranging 1-14 years, with a large number of untreated units. We include importer and exporter GDP growth as a control, while any unobserved time-invariant heterogeneity is wiped out by the differencing of our data.
Figure 3 shows the dose-response function, in particular the response of export growth to different doses of treatment (i.e. negotiation duration) compared to the untreated country pair units (i.e. those that don't negotiate and have no PTA). The negative effect of negotiations increases in magnitude from 18% in the first year to about 20% in the second and third year. With the value of PTA negotiation duration being rescaled to the 0-100 range, the 18% estimated coefficient correspond to a one-unit dose increase, equivalent to approximately 500 days. In other words, on average, a non-negotiating country pair that increase trade by, say, 100% in one year, should they hypothetically have been engaged in negotiations for 500 days, would have only increased their trade by 82% in that same year. Negotiations taking 4-7 years have a smaller yet still negative effect on export growth, of around 11%. The effect becomes even smaller later, but after year 7 it is no longer statistically significant at the 95% confidence level. One might say that after a long enough period, parties no longer react to the suspense of negotiations in a systematic manner. Despite the obvious econometrical issues, a series of least-squares estimators also return negative and highly statistically significant results, adding further robustness to the above-discussed preferred dose-response function estimates.
At this point it is worth making a few clarifications regarding how these results reconcile with the literature on PTA effects on trade. First, and most importantly, this column does not deal with the effect of the enforcement of a PTA. It only evaluates the behaviour of countries (or firms) facing uncertainty with regards to tariffs. Temporally, this translates into distinguishing between trade changes after negotiations and during negotiations – i.e. when dealing with the suspense is an additional factor in the exporting decision process.
Second, between two naturally trading partners (as theory predicts two countries negotiating a PTA to be), trade likely increases with time. For that reason, we look at the rate at which trade increases, and whether this is impacted by the length of negotiations. A negative coefficient estimated for export growth rate may or may not thus imply less trade, but it will certainly imply a deceleration of trade. Importantly, these results are not indicative of an actual slowdown in trade during negotiations in absolute terms. The economic performance (GDP growth) of each country in the pair and how they converge in size with each other are important drivers of bilateral exports. The story that the negative coefficients on the negotiation duration tell is that once we abstract away the positive effect of economic growth and country-pair convergence, longer duration of negotiation undermines trade growth.
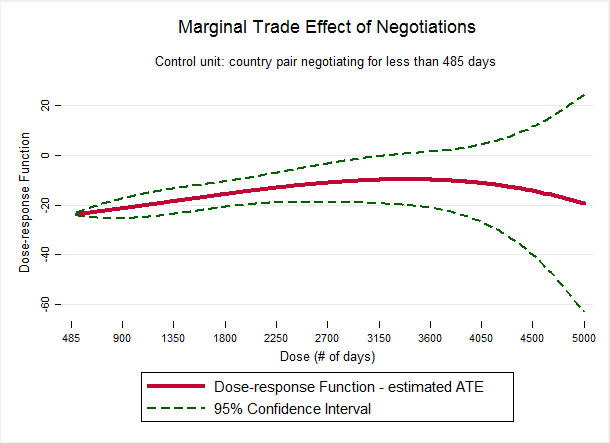
Implicitly, the comparison group for results plotted above consists of all country pairs that do not negotiate in that year. One might wonder, however, about the relative ATE when comparing negotiators to country pairs that have only been negotiating for a short while. We therefore construct an alternative control group consisting of those country pairs that have only been negotiating for a maximum of 485 days (the equivalent of the bottom 5th percentile in negotiations duration) and run the same dose response-function procedure.
Figure 4 Marginal trade effect of negotiations compared to short negotiations
Note: The control unit in this instance is a country pair negotiating for less than 485 days.
Magnitudes are consistently larger at almost all dosage levels when using short-time negotiators as a control group instead of non-negotiators. This result could be explained by the fact that the first one or two years of negotiations (a period captured by the dosage of the newly created control group) systematically gives subjects a positive perception about the international trading scene, the ‘excitement of a new beginning’. This leads to faster trade growth during that period. Consequently, when comparing the mean trade growth in the treatment group (negotiations greater than 485 days) with that in the new control group, the difference is larger than in the absence of such a positive perception, as is the case in the old control group. The bigger picture of this result can be observed in Figure 4, where the interval of duration with an estimated effect that is statistically significant is more apparent, ranging between dose levels of about 5 to 25, or 250 to 625 days.
Negotiating a PTA implies at least two countries trying to reach those terms generating most benefits while compromising the least. The position at the negotiation table is rarely equitable (e.g. Bagwell and Staiger 2011). The imbalance is often generated by each country's economic strength. We therefore proceed to testing whether country imbalances generate different effects of negotiations duration on export growth. In the context of a negotiation between two countries of relatively different sizes, it would be informative to see in which direction the negatively impacted trade growth goes, from the richer to the poorer or vice-versa. We split the sample into country pairs where the exporter is larger than the importer and country pairs where the exporter is smaller than the importer. As documented in Tarlea (2018), the pattern is clear – the magnitude of the deceleration effect of negotiations on exports is larger when the exporter is smaller than the importer. The trade balance of the smaller country is therefore impacted more drastically by the suspense governing the PTA negotiations.
Finally, we calculate the discrepancy between importer and exporter GDPs as one's share to the other and estimate the dose-response function of negotiations duration for its 100th, 95th, 75th, and 50th percentile. As we move from the full sample (100th percentile) to the subsample of country pairs in the bottom half of dissimilarity (or the most similar 50%), the effect is consistently reduced, yet still statistically significant at 1% level. This suggests that prolonged negotiations have less of an effect (albeit negative and significant) on trade growth between more similar countries.
References
Aitken, N D (1973), “The effect of the EEC and EFTA on European trade: A temporal cross-section analysis”, The American Economic Review, 63 (5), 881-892.
Baier, S L, and J H Bergstrand (2004), “Economic determinants of free trade agreements”, Journal of international Economics, 64 (1), 29-63.
Baier, S L, and J H Bergstrand (2009), “Bonus vetus OLS: A simple method for approximating international trade-cost effects using the gravity equation”, Journal of International Economics, 77 (1), 77-85.
Cerulli, G (2014), “ivtreatreg: A command for fitting binary treatment models with heterogeneous response to treatment and unobservable selection”, Stata Journal, 14 (3), 453-480.
Egger, H, P Egger, and D Greenaway (2008), “The trade structure effects of endogenous regional trade agreements”, Journal of international Economics, 74 (2), 278-298.
Egger, P, and M Larch (2008), “Interdependent preferential trade agreement memberships: An empirical analysis”, Journal of International Economics, 76 (2), 384-399.
Egger, P H, and F Tarlea (2017), “Comparing apples to apples: Estimating consistent partial effects of preferential economic integration agreements”, CEPR Discussion Paper no. 11894.
Frankel, J, E Stein, and S Wei (1996), “Regional Trading Arrangement: Natural or Super-Natural? ”, NBER Working Paper no. 5431.
Hirano, K, and G W Imbens (2004), “The propensity score with continuous treatments”, Applied Bayesian modeling and causal inference from incomplete-data perspectives, 226164, 73-84.
Moser, C, and A K Rose (2014), “Who benefits from regional trade agreements? The view from the stock market”, European Economic Review, 68, 31-47.
Soloaga, I, and L A Winters (2001), “Regionalism in the nineties: What effect on trade?”, The North American Journal of Economics and Finance, 12 (1), 1-29.
Tarlea, F (2018), “The Suspense of Trade Agreements”, KOF Working Paper no. 440.
Tinbergen, J, and A Hekscher (1962), Shaping the World Economy Suggestions for an International Economic Policy, Twentieth Century Fund.
