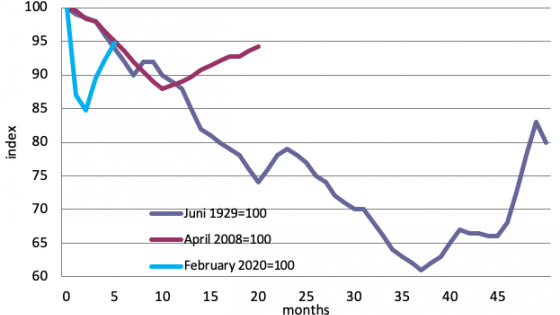
In their classic contribution, Eichengreen and O’Rourke (2010) traced and compared the evolution of industrial production after two great shocks, the banking crisis that produced the Great Depression in the 1930s and the one that led to the Great Recession in 2008-2009. We reproduce their results here (see Figure 1). The figure shows the index of world industrial production during the months following the onset of these two crises (June 1929 for the Great Depression and April 2008 for the Great Recession).
Eichengreen and O’Rourke (2010) observe that the downturns following the two banking crises were initially very similar. The difference occurred after about ten months. During the Great Recession there was a relatively quick recovery after ten months. Such a recovery did not occur during the Great Depression. The downturn would continue for another 25 months before a steady recovery set in.
It is now generally recognised that the fundamental reason for this sharp contrast between these two crises was the different reactions of monetary and fiscal authorities. During the Great Depression, both the monetary and fiscal authorities conducted restrictive policies (Friedman and Schwartz 1963, Eichengreen and O’Rourke 2010). These ill-conceived policies had the effect of intensifying and prolonging the downturn in production and transforming this into a Great Depression. By 2008 policymakers had learned their lessons from history and reacted by monetary and fiscal stimuli. As a result, the economic downturn that initially had all the ingredients of becoming a Great Depression was cut short.
Figure 1 Index of world industrial production: Great Depression vs Great Recession
Source: Eichengreen and O’Rourke (2010)
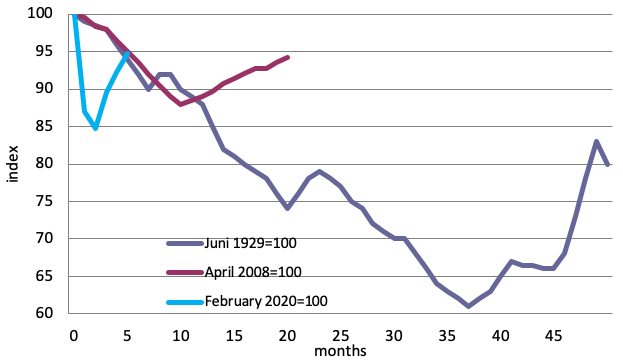
How different is the economic shock produced by the COVID-19 pandemic that shook the world at the start of 2020? It was very different compared to the shock caused by the financial crisis of 2007-2008 and the Great Depression in the 1930s. We show this in Figure 2. As in Figure 1, each line represents the index of industrial production from the start of the respective crises: the Great Depression of the 1930s, the Great Recession following the banking crisis of 2007-2008, and the COVID-19 pandemic.
As we do not yet have access to measures of world industrial production, we aggregate the industrial productions of China, the US, and the EU. These three countries are responsible for 60% of world industrial production.
Figure 2 Index of world industrial production: Great Depression, Great Recession, and COVID-19
Source: Eichengreen and O’Rourke (2010); Eurostat for EU 2020, Federal Reserve for US 2020, and OECD for China 2020. The February 2020 line relates to the aggregate industrial production of China, the US, and EU. Note that for in the case of China the starting point is not February 2020, but December 2019. The reason is that China was hit earlier by the coronavirus and the downturn also started earlier.
The contrast between the aftermath of the Covid-19 shock and those of the two banking crises is strong, in two ways.
First, the intensity of the downward movement after the eruption of the coronavirus pandemic is much greater and faster than that of the Great Depression and of the banking crisis of 2008. The reason is that the pandemic produced both a supply and a demand shock. The supply shock arose from interruptions of supply chains that forced many companies to halt production (Inoue and Todo 2019). This supply shock in turn produced major demand shocks: consumers could not get to the shops, workers saw their revenues decline, and animal spirits set in that induced consumers and firms to postpone consumption and investment (Baldwin and Weder di Mauro 2020). These supply and demand shocks interacted and amplified each other, leading to a swift deflationary spiral that was much faster than the downward spirals after the banking crises of 1929 and 2008. The latter triggered negative demand shocks but did not lead to supply disruptions.
A second difference has to do with the revival observed after the coronavirus shock. We see that once the lockdowns were released, industrial production rebounded strongly. This revival was made possible by the fact that most governments responded in the right way. They made sure that companies were given financial support and that workers who were at risk of losing their jobs were not dismissed. In Europe, governments simply took over (part of) their wages. This ensured that those employees retained their purchasing power and could therefore continue to buy goods and services, and that firms were not driven into bankruptcy. In the US, government spending – including unemployment benefits – expanded massively. Governments supported their economies so that these were kept alive, making it possible to rebound relatively easily when the lockdowns were lifted.
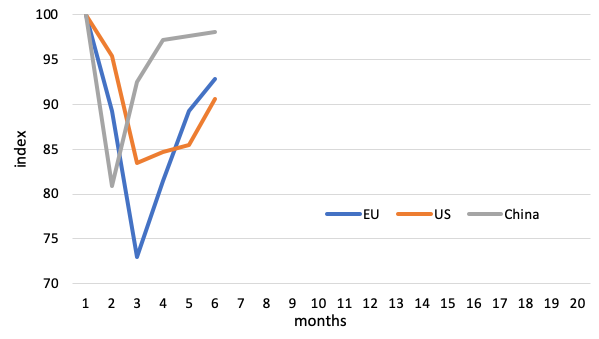
These recoveries were extremely fast and look much like V-shaped recoveries. In Figure 3, we show the detail of the declines and recoveries in China, the US, and the EU (the same countries used in Figure 2). We observe that the Chinese decline in industrial production was very steep but followed by a swift recovery. The EU’s decline was the sharpest, but its recovery was also relatively sharp, at least when compared to the US recovery. These differences had much to do with the fact that China reacted faster and in a more intrusive way than the EU and the US. The latter, in particular, was the slowest to respond.
Figure 3 Index of industrial production: Aftermath of the coronavirus shock
Source: Eurostat for the EU, Federal Reserve for the US, and OECD for China.
Why was the recovery after the coronavirus shock much swifter than after the banking crisis of 2008? In both cases, support for the economy by the fiscal authorities was very strong, as is shown by the fact that governments allowed their budget deficits to increase dramatically (see Figure 4). The answer must be that the Great Recession of 2008-2009 was triggered by a banking crisis. After that shock, banks were impaired and were very reluctant to expand credit (Bentolila et al. 2015, Giovanini et al. 2015). This led to a more protracted recovery than the one observed after the coronavirus shock. In the latter case, banks did not suffer comparable difficulties and were not major impediments to a recovery.
Figure 4 Government surplus/deficit (% of GDP)
Source: OECD
Note: The numbers for 2020 are forecasts. Those of 2021 are also forecasts assuming no second coronavirus wave.
Today we face great uncertainty about the sustainability of the revivals in industrial production observed in Figures 2 and 3. Will these strong revivals be maintained? There is a risk of second and third waves of the pandemic, and so there is still a risk of new economic downturns. Much will depend on the willingness of the monetary and fiscal authorities to continue to support the economy by monetary and fiscal expansions if these second and third waves occur. All this is still very uncertain. It is not to be excluded that the recovery will turn out to be W-shaped (or some other letter) rather than V-shaped.
The important insight about the potential for recovery from the COVID-19 shock is the following. Figures 2 and 3 show that once the fears about COVID-19 are gone, the economy has the capacity to rebound quickly, and much faster than during the previous two historical episodes. The reason is that during these episodes, the banks had to be fixed before a recovery could be sustainable. This took some time. Today banks do not have to be fixed. As a result, provided governments and central banks continue their operations aimed at supporting economic activity, the recovery can be relatively quick. Put differently, if by their support the authorities ensure that no permanent damage is done to the economy, the latter has the potential to rebound quickly.
References
Baldwin, R and B Weder di Mauro (2020), Economics in the time of Covid-19, a VoxEU.org eBook, London: CEPR Press.
Bentolila, S, M Jansen, G Jiménez and S Ruano (2015), “When credit dries up: job losses in the Great Recession”, CEMFI Working Paper no. 1310.
Giovannini, A, C Mayer, S Micossi, C Di Noia, M Onado, M Pagano and A Polo (2015), Restarting European Long-Term Investment Finance, London: CEPR Press.
Eichengreen, B and K O’Rourke (2010), “A tale of two depressions: What do the new data tell us? February 2010 update”, VoxEU.org, 8 March.
Friedman, M and A Schwartz (1963), A Monetary History of the United States 1867-1960, Princeton University Press.
Inoue, H and Y Todo (2019), “Propagation of economic shocks through supply chains”, VoxEU.org, 10 September.


