A pre-requisite for good macroeconomic policymaking is timely information on the current state of the economy, particularly when economic activity is changing rapidly. Given that GDP figures are usually only available on a quarterly basis, and that monthly survey-based indicators (such as the Purchasing Managers’ Indices) can become unreliable when changes in economic activity are abrupt and massive, the current crisis has prompted a search for alternative high frequency indicators of economic activity. The OECD Economic Outlook (OECD 2020), and a recent OECD paper (Woloszko 2020), discuss one such indicator based on Google Trends, which are used to construct a ‘Weekly Tracker’ that provides real-time estimates of GDP growth in 46 economies covering G20, OECD, and OECD partner countries. The OECD Weekly Tracker data are updated on a regular basis and made available on this webpage.
A model of GDP growth based on Google Trends and machine learning
The Weekly Tracker uses a two-step model to nowcast weekly GDP growth based on Google Trends. First, a quarterly model of GDP growth is estimated based on Google Trends search intensities at a quarterly frequency. Second, the relationship between Google Trends and activity (using the same elasticities estimated from the quarterly model) is applied to the weekly Google Trends series to yield a weekly tracker. The OECD Weekly Tracker can therefore be interpreted as an estimate of the year on year growth rate of ‘weekly GDP’ (the same week compared to the previous year).
The relationship between Google Trends variables and GDP growth is fitted using a machine learning algorithm (‘neural network’). The algorithm captures non-linearities that are likely to be key in extreme situations, but which are difficult to estimate with more conventional econometric approaches. Google Trends ‘big’ data make it possible to use algorithms that are powerful but require large samples. Cross country differences related to Google Search’s market penetration or institutional settings are flexibly captured as the neural network allows for all possible interactions between Google Trends variables and country dummies.
Signals about multiple facets of the economy are aggregated to infer a timely picture of the macro economy. The algorithm extracts and compiles information about consumption (e.g. from searches for vehicles or households appliances), labour markets (e.g. searches for unemployment benefits), housing (e.g. searches for real estate agencies or mortgages), business services (e.g. searches for ‘venture capital or bankruptcy), industrial activity (e.g. searches for maritime transport or agricultural equipment), trade (e.g. searches for exports or freight) as well as economic sentiment (e.g. searches for recession) and poverty (e.g. searches for food banks).1 Using multiple variables reduces the risk related to structural breaks in specific series, which was highlighted by the failure of the ‘Google Flu’ experiment.3
High-frequency and big data have limitations as scientific analysis is usually not the original purpose of their collection. These caveats call for specific attention and statistical pre processing. Among the many available Google Trends variables, 215 categories and topics are judged as being relevant for economic analysis and selected to feature in the model. Selected variables are transformed to year on year growth rates. Finally, as the Google Search user base has increased dramatically since 2004, the relative search intensities of most search categories decrease over time. This long term trend is filtered out using a methodology described in Woloszko (2020).
The quarterly model of year-on-year GDP growth based on Google Trends performs well in out of sample nowcast simulations. On average across 46 countries, it has a ‘Root Mean Squared Error’ (RMSE) that is 17% lower than an ‘autoregressive model’ that just uses lags of year-on-year GDP growth. The model captures a sizeable share of business cycle variations, including those around the 2007/08 global crisis (when the available data for training the algorithm was much smaller) and the euro area sovereign debt crisis. The tracker therefore provides a useful tool for real time narrative analysis on a weekly basis, although it does not, on average, outperform models based on more standard variables (once these are eventually released).
Insights from the OECD Weekly Tracker during the Covid-19 crisis
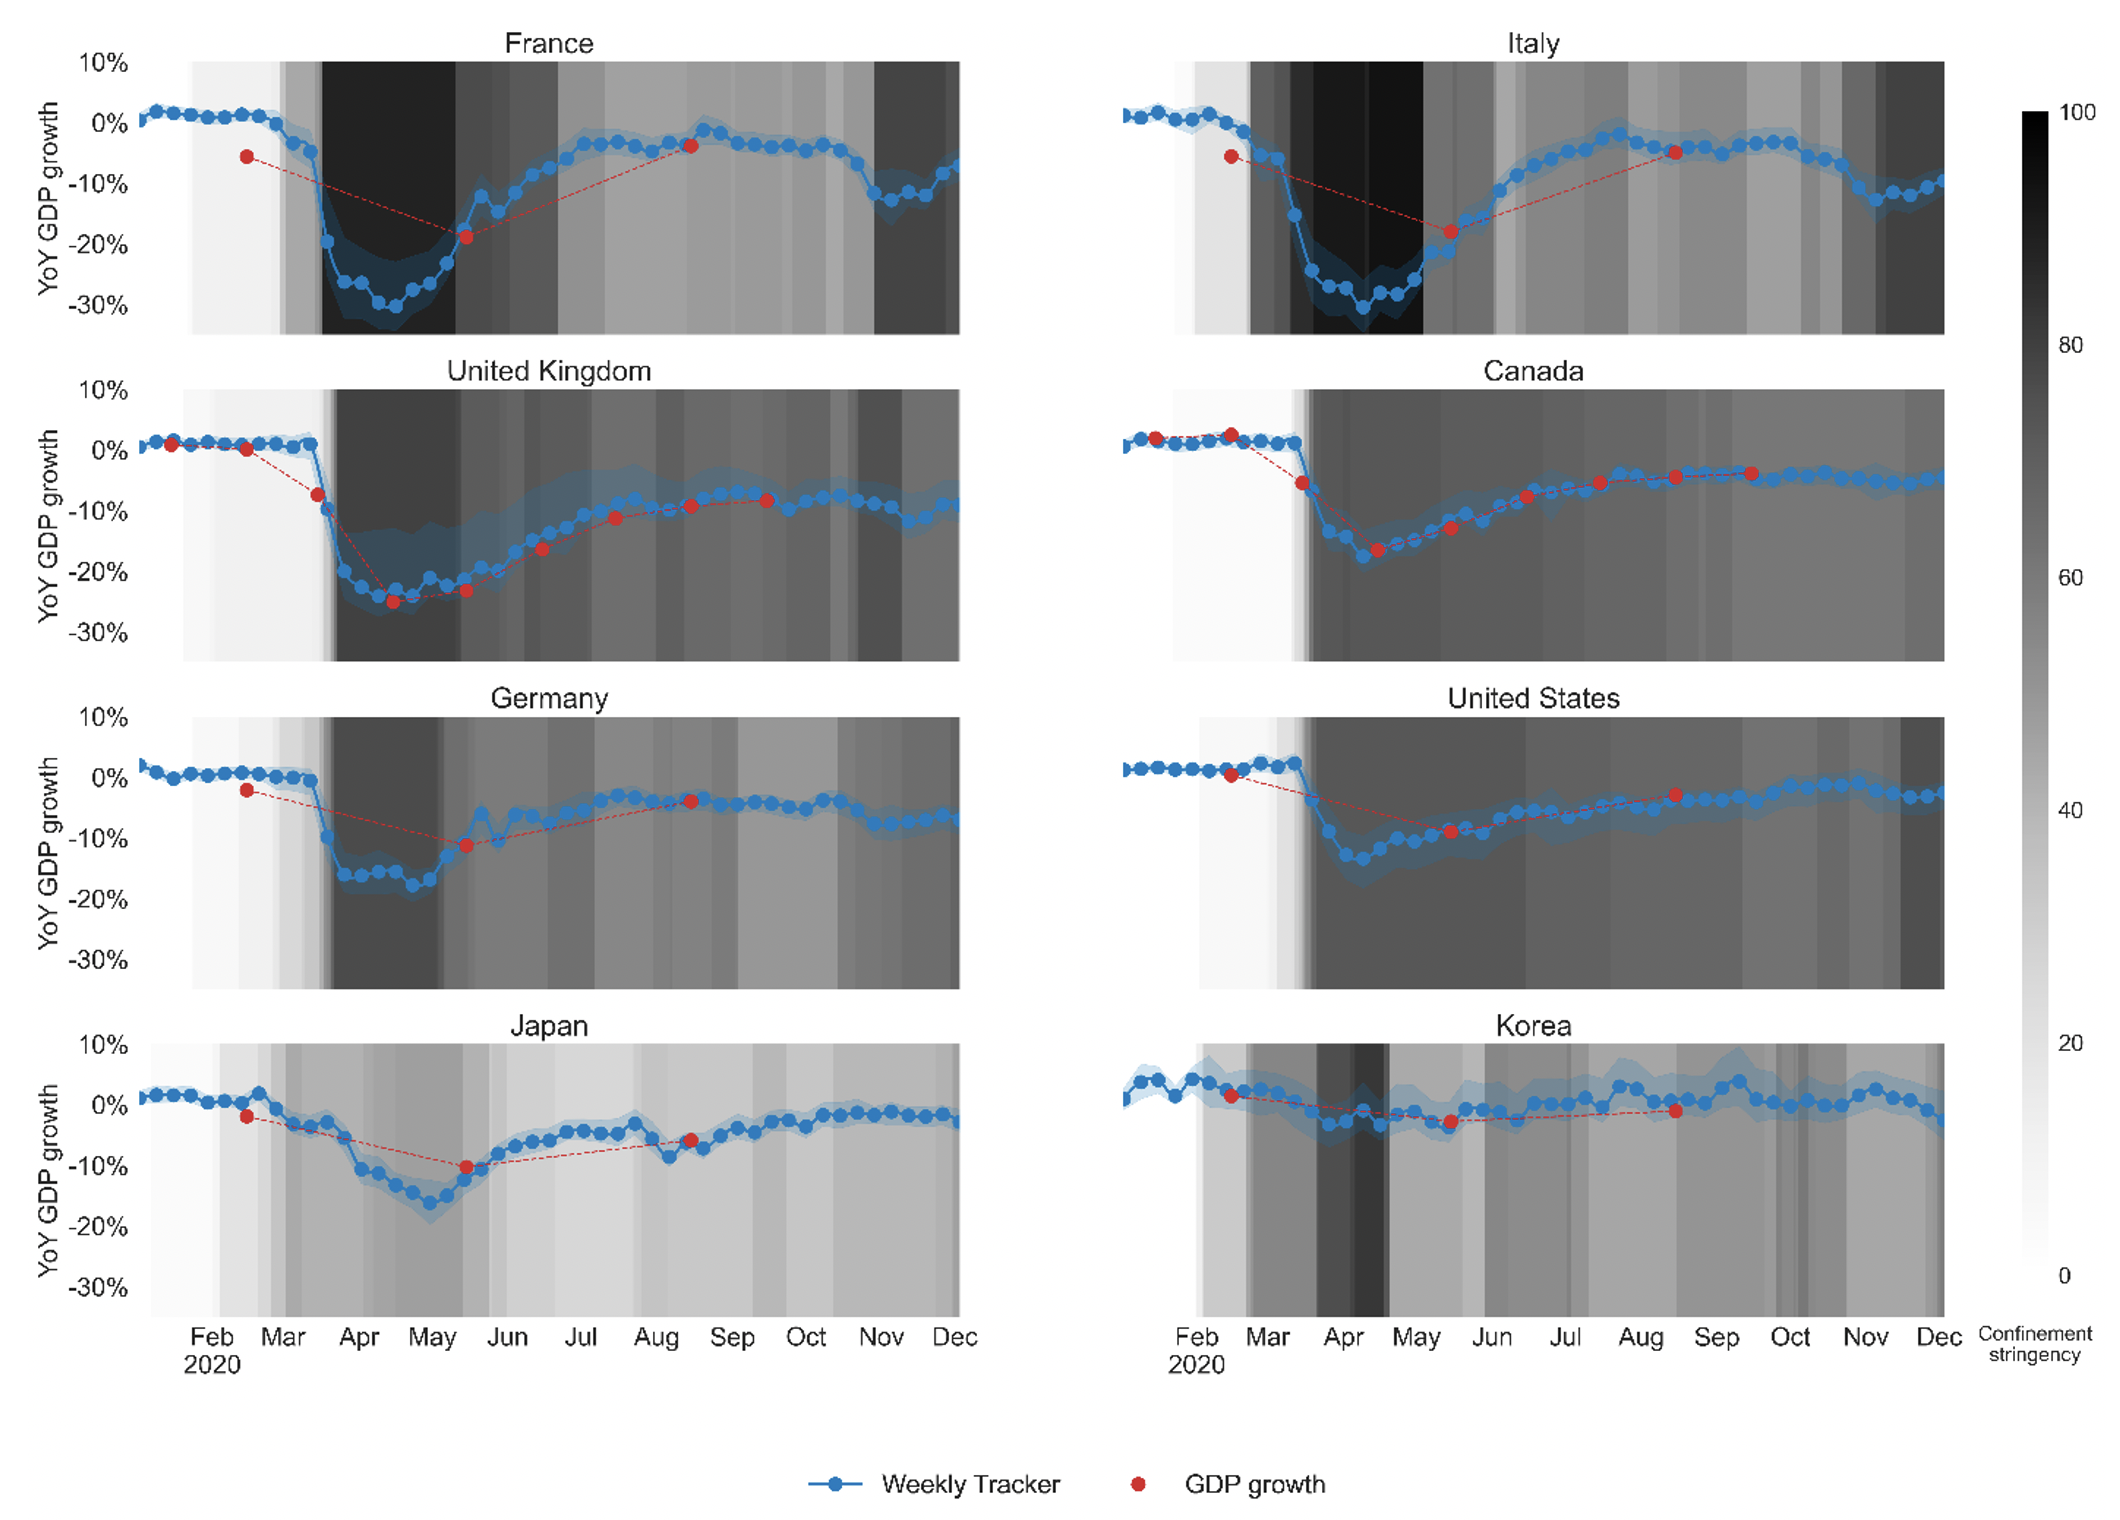
The timeliness and wide country-coverage of the tracker mean that it is particularly informative during the turbulent period of the current global pandemic. The timing of the sharp second quarter downturn in 2020 is signalled well before more conventional business cycle indicators and coincides closely with the implementation of lockdown measures (Figures 1-2), although the full magnitude of the negative shock is typically under estimated, given its unprecedented scale. The tracker suggests that the crisis caused fluctuations in economic activity that were too abrupt to be adequately represented by monthly indicators. For example, during March 2020, the Weekly Tracker suggests that for the US, year-on-year GDP growth fell from 2.4% during the first week to 10.2% in the last week, before reaching -14.7% in mid-April (Figure 1). In the UK, the Weekly Tracker suggests that annual GDP growth fell from 0.4% to -20% in the course of March, reaching -24% in mid April.
The tracker also suggests that the immediate impact on GDP was heterogeneous across advanced economies (Figure 1). In France and Italy, where especially stringent lockdowns were implemented, activity is estimated to have fallen much more suddenly than in countries where the lockdowns were less stringent (Germany, Japan, and Canada). Korea – where epidemic control relied on track-and-test rather than on lockdown policies – had the lowest short-term drop.
Figure 1 The OECD Weekly Tracker: selected advanced G20 economies in 2020
Weekly Tracker of GDP growth based on Google Trends
Note: The charts show GDP relative to a year earlier. Countries are ranked by the magnitude of the negative shock at the trough. The blue confidence band shows 95% confidence intervals. Red dots representing GDP growth are official outturns. Monthly GDP growth series are used when available (for the United Kingdom and Canada). The darkness of the grey background indicates confinement stringency.
Source: OECD Weekly Tracker; UK Office for National Statistics; StatCan; and Oxford COVID-19 Government Response Tracker (Hale et al., 2020).
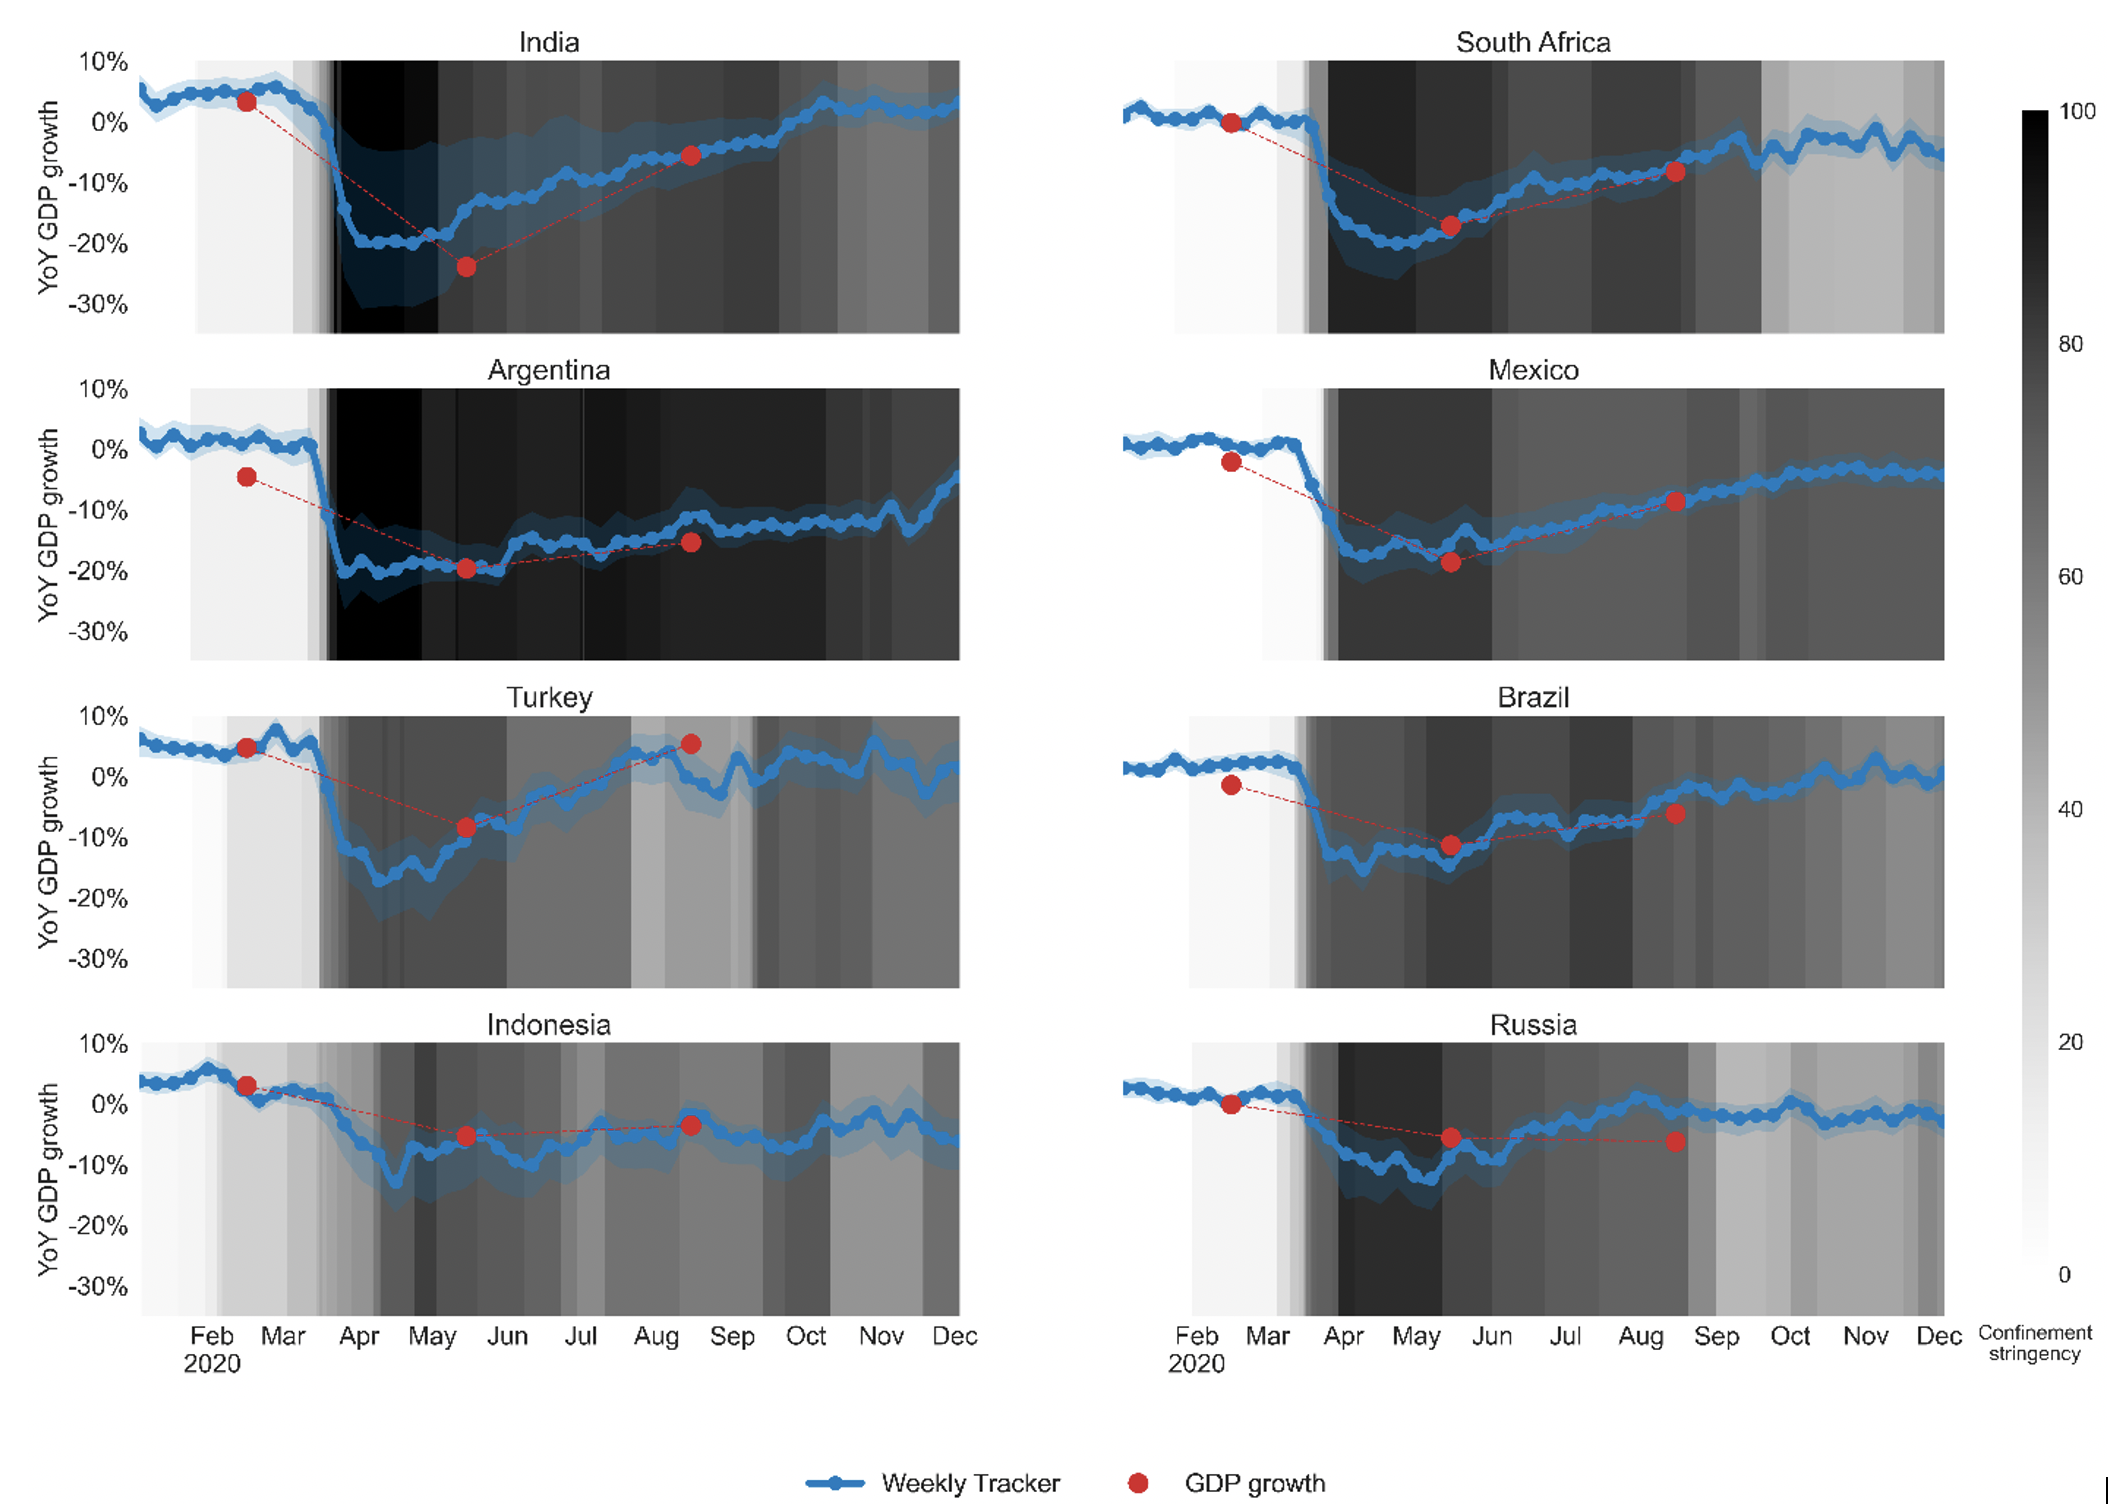
Many emerging-market economies exhibit a similar sudden fall in activity based on the Weekly Tracker, although the rebound differs widely across countries (Figure 2). The initial shock to activity is estimated to be particularly strong in India (-20%), Mexico (-19%), South Africa (-19%), Argentina ( 18%), Turkey ( 15%), and Brazil (-13%) with regards to the same weeks of 2019. Russia and Indonesia were hit less hard, with the Weekly Tracker suggesting that activity at the ‘trough’ was around 11% lower than in 2019.
Figure 2 The OECD Weekly Tracker: emerging G20 economies in 2020
Weekly Tracker of GDP growth based on Google Trends
Note: The charts show GDP relative to a year earlier. Countries are ranked by the magnitude of the negative shock at the trough. The confidence band shows 95% confidence intervals. Red dots representing GDP growth are official statistics except for the third quarter of 2020 where they are either Economic Outlook projections or the outturns when the latter are available (for Indonesia and Mexico). The darkness of the grey background indicates confinement stringency.
Source: OECD Economic Outlook 108 database; OECD Weekly Tracker; and Oxford COVID-19 Government Response Tracker (Hale et al., 2020).
The tracker suggests that in a number of countries a partial recovery began towards the end of April, with impetus slowing from June. Predictions for the third quarter GDP proved very accurate, with a mean absolute error of around one percentage point and no evidence of systematic bias (compared with variation in quarter-on-quarter growth of between 2% and 18% across the countries in the sample). The performance of the model over the crisis period is particularly impressive when assessed for those few countries (including Canada and the UK) that publish monthly estimates of GDP (Figure 1). Latest estimates suggest a further brake on activity in those (mostly European) countries which imposed further lockdown measures in November (OECD 2020).
References
Butler, D (2013), “When Google got flu wrong”, Nature 494(7636): 155-156.
Cournède, B, V Ziemann and F De Pace (2020), Housing amid Covid-19: Policy responses and challenges, OECD Policy Responses to Coronavirus (COVID-19), Paris: OECD Publishing.
D’Amuri, F and J Marcucci (2012), “The Predictive Power of Google Searches in Forecasting Unemployment”, Bank of Italy Temi di Discussione, Working Paper 891.
Ginsberg, J, M H Mohebbi, R S Patel, L Brammer, M S Smolinski and L Brilliant (2009), “Detecting Influenza Epidemics Using Search Engine Query Data”, Nature 457(7232): 1012-1014.
Gonzales, F, A Jaax and A Mourougane (2020), “Nowcasting aggregate services trade. A pilot approach to providing insights into monthly balance of payments data”, Paris: OECD Publishing.
Hale, T, A Petherick, T Phillips, S Webster, B Kira, N Angrist and L Dixon (2020), “Oxford COVID-19 Government Response Tracker”, Blavatnik School of Government, Oxford University.
OECD (2020), OECD Economic Outlook 2020 Issue 2: Preliminary version, Paris: OECD Publishing.
van der Wielen, W and S Barrios (2020), “Fear and Employment During the COVID Pandemic: Evidence from Search Behaviour in the EU”, JRC Working Papers on Taxation and Structural Reforms 08/2020, European Commission.
Varian, H and H Choi (2009), “Predicting the Present with Google Trends”, SSRN Electronic Journal.
Woloszko, N (2020), “A Weekly Tracker of activity based on machine learning and Google Trends”, OECD Economics Department Working Papers 1634, Paris: OECD Publishing.
Endnotes
1 See also D’Amuri et al. (2012), Cournède et al. (2020), Gonzales et al. (2020) and van der Wielen et al. (2020).
2 In 2009, Google started tracking influenza epidemics based on searches for “influenza” or related symptoms (Ginsberg et al., 2009). In 2013, the experiment was shown to be limited by media coverage of influenza epidemics during major outbreaks that were causing surges in Google searches unrelated to the virus propagation (Butler, 2013).


