The transport sector is a significant greenhouse-gas emitter. According to the IPCC (2014), in 2010 it was responsible for approximately 23% of global energy-related CO2 emissions (6.7 gigatonnes CO2). The figure is higher in many developed countries. In 2017, for example, transportation was responsible for about 29% of total greenhouse-gas emissions in the US and about 41% in California (EPA 2019 and California Air Resources Board 2019). Reducing emissions from the transport sector is thus important for reducing global greenhouse-gas emissions.
International trade in goods requires transportation, and the need for transportation has been amplified by the development of global production networks in which production is geographically fragmented. Cristea et al. (2013) report that international transport is responsible for 33% of world trade-related emissions, and that, for example, the maritime shipment of goods (excluding bulk cargo) to and from Europe results in CO2 emissions that are comparable to emissions produced by the 38 million passenger cars in Italy.
This has led to international trade being regarded with some suspicion. There have been calls to consume locally produced goods and suggestions that international trade may have to be reduced.
A response to this criticism of trade is that the gains from cleaner production can outweigh even very dirty transportation. For example, Williams (2007) finds that cut roses produced in Kenya and transported by air to the UK create fewer emissions compared with roses produced in the Netherlands. Cristea (2013) finds that a quarter of all trade flows (31% of global trade by value) lead to reduced emissions compared with autarky. Shapiro (2016) finds that trade increases global CO2 emissions by some 5% – but also that the welfare gains of international trade exceed the welfare costs of CO2 emissions by two orders of magnitude.
In a recent paper (Forslid 2019), I show that trade and transportation may actually decrease emissions even when there are no gains from cleaner production. That is, comparing trade to autarky for two countries or regions with exactly equally polluting industry, I show that trade can lead to less global emissions in spite of the pollution from transportation. The reason is that transportation uses primary production factors, and transportation will therefore crowd out some production in equilibrium. If production is dirtier – in a well-defined sense – than transportation, global emissions will fall as a result of trade and transportation.
The paper also derives a new measure of how environmentally harmful a firm is – a ‘dirtiness index’ – that can be used to rank firms and sectors in terms of their effect on global emissions. The index is a function of the emissions to cost ratio of firms. This index differs from the standard measure of dirtiness, which is emissions per unit.
Some intuition for the new index can be found by comparing two imaginary modes of transportation. The first mode of transportation emits very little per transported unit and uses very little primary resources, say labour. Such a transportation mode would be favoured by the traditional measure of emissions per transported unit.
The second mode of transportation emits a little more per transported unit but uses considerably more labour. The second mode of transportation emits more per transported unit, but it crowds out more production as it uses more of the labour stock. The fall in production due to crowding out will mean less emissions, and it may therefore be that total emissions (from production and transportation) are lower when using the second mode of transportation compared with the first mode.
The relevant measure of how dirty a firm or sector is is therefore not emissions per unit, but a function of emissions to total factor use or to total cost.
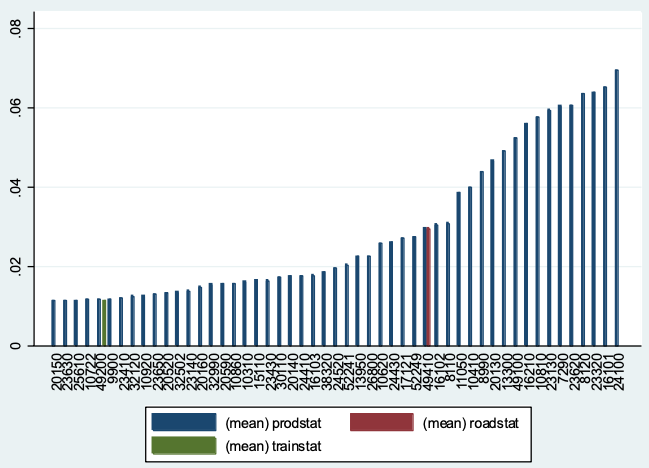
Figure 1 ranks CO2 emissions by Swedish 5-digit sectors using the novel dirtiness index. The figure shows the mean of the statistic for 2007 and 2008. Sector-level emissions are aggregated from plant-level emissions, where CO2 emissions are calculated from the fuel use at the plant level. Differences in emission taxes among sectors, as well as the effects of the EU emissions trading system, are accounted for in the index calculation. Goods transport by road and by rail are marked.
Figure 1 The dirtiness index: CO2 emissions by Swedish 5-digit sectors
Notes: The figure shows the mean of the statistic for 2007 and 2008. Sector-level emissions are aggregated from plant-level emissions, where CO2 emissions are calculated from the fuel use at the plant level. Differences in emission taxes among sectors, as well as the effects of the EU emissions trading system, are accounted for in the index calculation. Goods transport by road and by rail are marked.
The figure centres on the two transport sectors, leaving out the dirtiest and the cleanest sectors. The dirtiest sectors, which are not shown in the figure, are cement (0.82) followed by kraft pulp (0.58). The mean of the 305 sectors (0.018) lies between transport by rail (0.012) and transport by road (0.030). Fifty-nine sectors have a higher dirtiness index than rail transport, and 30 sectors have a higher index than road transport.
It’s evident that there are a large number of cases where transportation is cleaner than production, and where trade and transportation therefore can lead to lower CO2 emissions than production. One example seen in the figure is sugar manufacturing (10810), which is dirtier than any of the transport sectors.
The main point is that transportation by itself may actually decrease emissions when general equilibrium effects are taken into account. The likelihood of this depends on how dirty transportation is compared with production. Transportation will reduce global emissions if the production of transport services is cleaner than the production it substitutes. The question then is which production is substituted by transportation in practice.
Clearly, the cleaner transportation is relative to other production sectors, the higher is the likelihood that transportation could lead to lower emissions. One example where transportation is relatively likely to have positive effects on the environment is transportation by electric train. This mode of transportation will have a dirtiness index below most production sectors due both to low CO2 emissions and to high costs per transported unit.
However, to evaluate the overall empirical importance of the effect described here requires simulation of a large-scale general equilibrium model, such as the one by Shapiro (2016), explicitly accounting for the factor use of the transport sector.
References
California Air Resources Board (2019), “California greenhouse gas emissions for 2000 to 2017 trends of emissions and other indicators”, technical report.
Cristea, A, D Hummels, L Puzzello and M Avetisyan (2013), “Trade and the greenhouse gas emissions from international freight transport”, Journal of Environmental Economics and Management 65(1): 153–73.
Forslid, R (2019), “Trade transportation and the environment”, CEPR Discussion Paper 14228.
Shapiro, J S (2016), “Trade costs, CO2, and the environment”, American Economic Journal: Economic Policy 8(4): 220–54.
US Environmental Protection Agency (2019), “Inventory of US greenhouse gas emissions and sinks 1990 to 2017”.
Williams, A (2007), “Comparative study of cut roses for the British market produced in Kenya and the Netherlands”, Précis Report for World Flowers, February.


