Over the past two decades, both the academic and policy communities have been increasingly concerned by the persistently large, and often rising, dispersion in productivity performance across firms, even within narrowly defined industries (Bartelsman and Doms 2001, Syverson 2011, OECD 2015). Such rising dispersion has been cited as a contributing cause of the productivity slowdown experienced by OECD countries (Andrews et al. 2017). A link was also established between productivity dispersion and dispersion in wages and incomes – a measure of inequality (Berlingieri et al. 2017a, OECD 2021). Rising dispersion, observed both domestically and globally, has focused attention on the drivers of superior performances of a minority of firms, often referred to as the productivity frontier, and on the causes of disappointing performances of the remaining ones, often referred to as the productivity laggards.
To date, much of the analysis has focused on the technology advantage of leading firms (Tambe et al. 2020, Sudekum et al. 2020) or delays in technology adoption by laggards (Berlingieri et al. 2020). However, it is increasingly recognised that such technologies, which spread out rapidly over the past two decades, are strongly complementary with key intangibles, including organisational capital and workers’ skills (Brynjolfsson et al., 2021). So far, little research has been devoted to the role played by these human capital component of intangibles, especially at the cross-country level (however, see Goldin et al. 2021 and Haskel and Westlake 2018). Moreover, policy can play an important role in ensuring that intangible and human capital – for example, skills – are at the same time available and accessible to a majority of potentially dynamic and innovative firms, especially young, small and medium-sized ones.
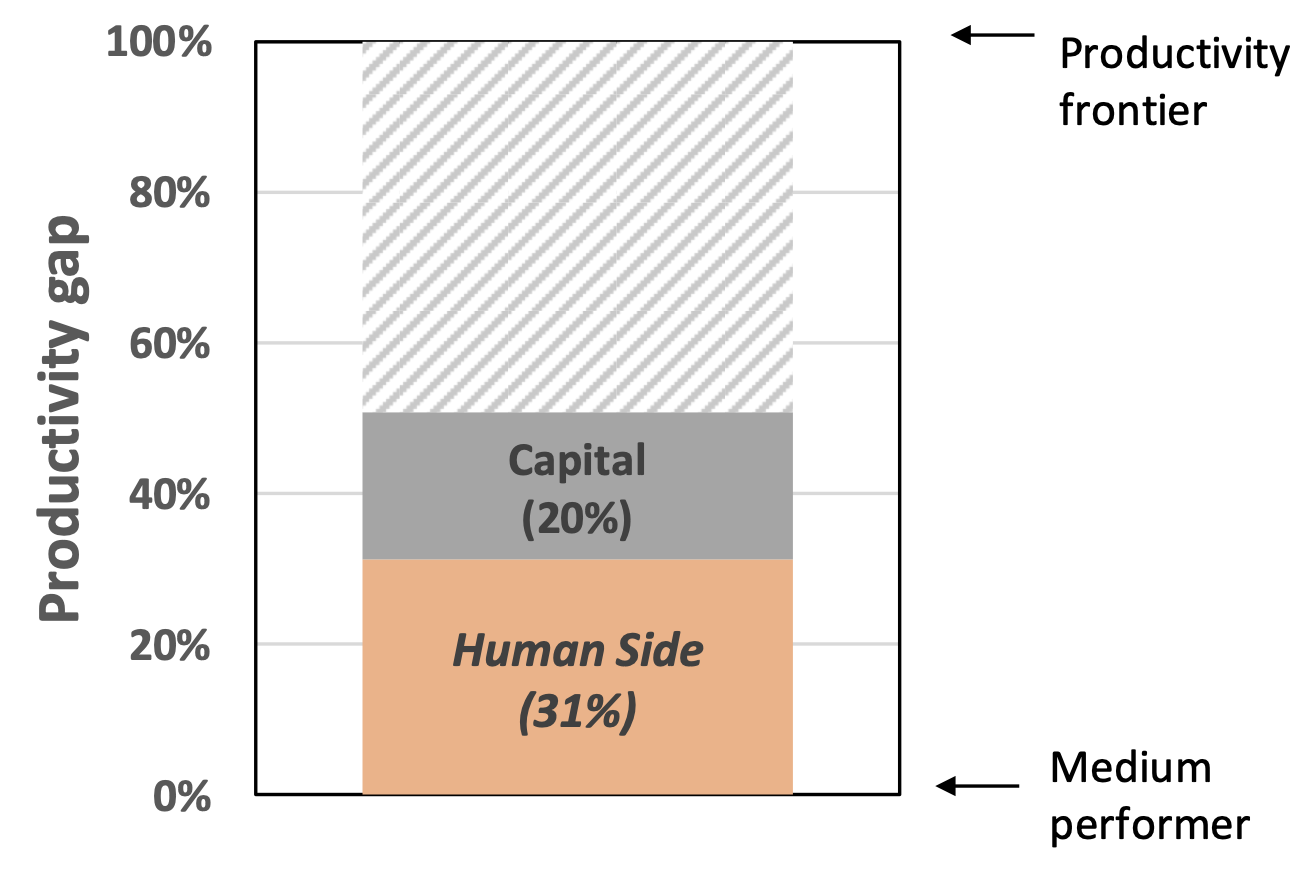
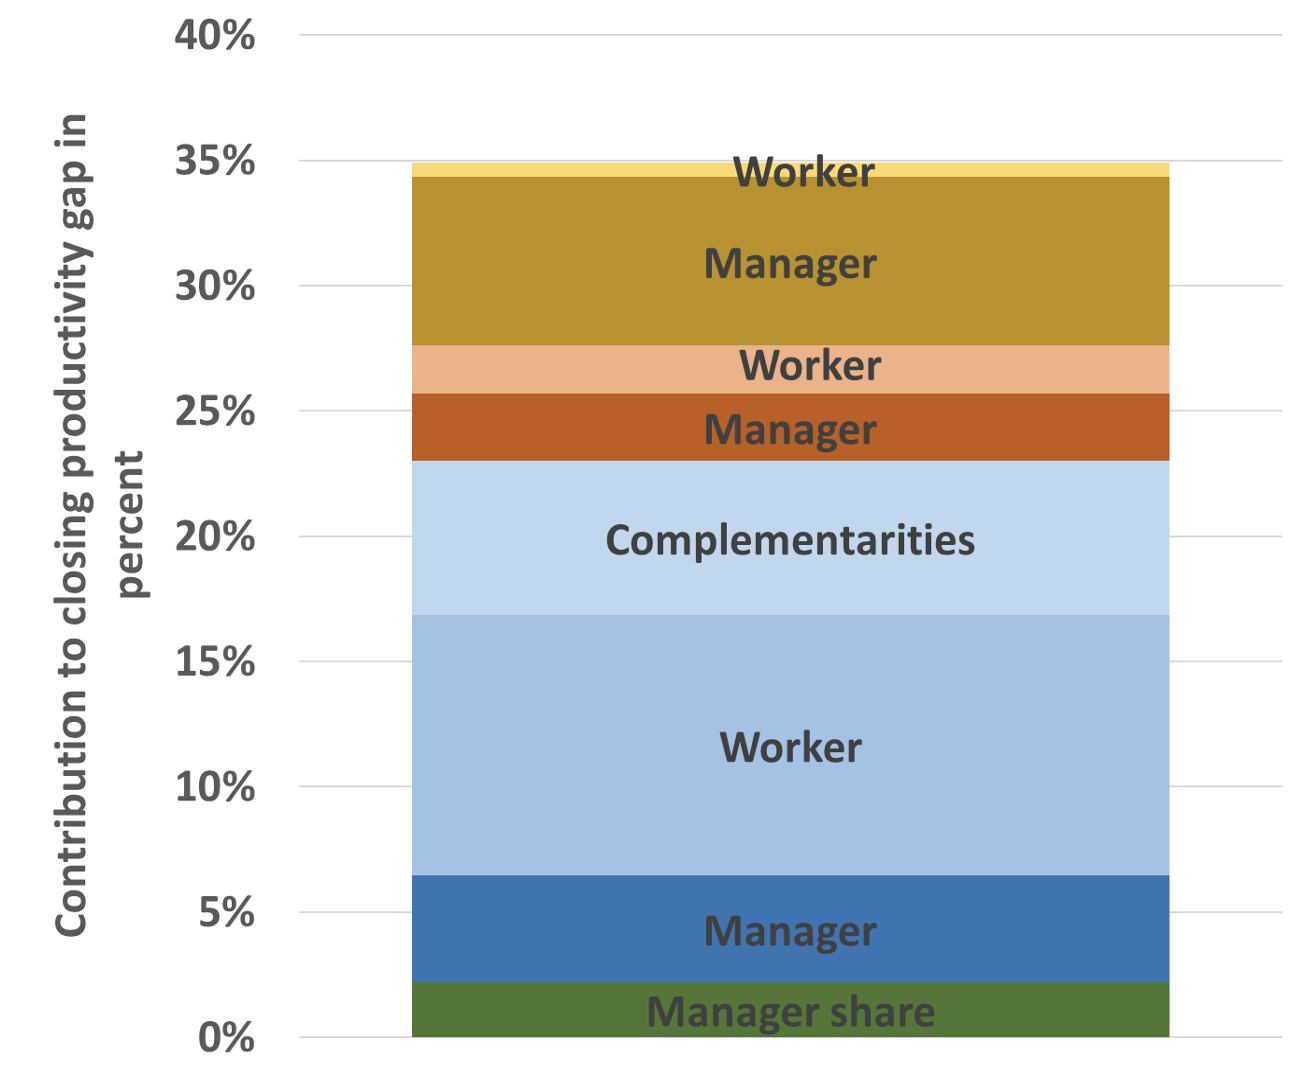
In new research, we leverage a unique cross-country database built from matched employer-employee datasets from ten countries (Criscuolo et al. 2021). We link employees to the performance of their firm to explore how differences in productivity outcomes of frontier and laggard firms depend on their Human Side – that is, the composition, diversity, and competencies of their managers and their workers. Overall, we find that the Human Side covered by our analysis explains about a third of the observed differences in productivity across firms, more than what is accounted for by differences in capital intensity (Figure 1). The remaining productivity gaps, related to differences in other intangibles and to their complementarity with physical capital, remain to be explored in future work.
Figure 1 The ‘Human side’ explains over a third of productivity gaps
Note: The figure shows the contribution of productivity enhancing adjustments of the workforce composition and capital intensity respectively to the catch up of a typical medium performer towards the productivity frontier in the same industry and country. Results are based on a firm-level regression controlling simultaneously for capital intensity and workforce composition among other variables and fixed effects. More details on the underlying analysis are provided in Box 1 and Annex A of Criscuolo et al. (2021). All countries for which capital is measured have been included.
Source: Criscuolo et al. (2021).
The analysis overcame the well-known issues of accessibility and cross-country comparability of linked employer-employee data by using a distributed micro data approach (Bartelsman et al. 2013, Berlingieri et al. 2017b). This benefited from the contribution of a network of national experts that accessed the (often confidential) data and ran the identical codes we prepared to grind out the descriptive and econometric results from the basic data. This approach was facilitated by the participation of countries contributing to the Global Forum on Productivity,1 which allowed covering countries in Europe, Asia and Central America.
Which Human Sides contribute to productivity gaps?
There are many dimensions to the human side of productivity, but (partly due to data availability) we focused on three of them: workers’ skills, managerial talent, and staff diversity. We looked at two main dimensions of diversity – gender and culture – and several dimensions of workers’ skills – educational attainment, general cognitive skills and specific skills (management and communication skills and ICT skills) – based on country-specific information on occupations from the OECD’s Adult Skills database (PIAAC). The underlying hypothesis was that dispersion in productivity across firms is closely related to dispersion in such key characteristics of their workforces.
We find that firms that are close to the productivity frontier differ from other firms in several dimensions of their human side: they employ more high-skilled workers and they have more managerial talent. Moreover, employing a more diverse workforce is associated with important productivity gains, over and above the role played by workforce skills. However, the extent of these differences varies a lot across countries and sectors.
Workers’ skills and productivity gaps
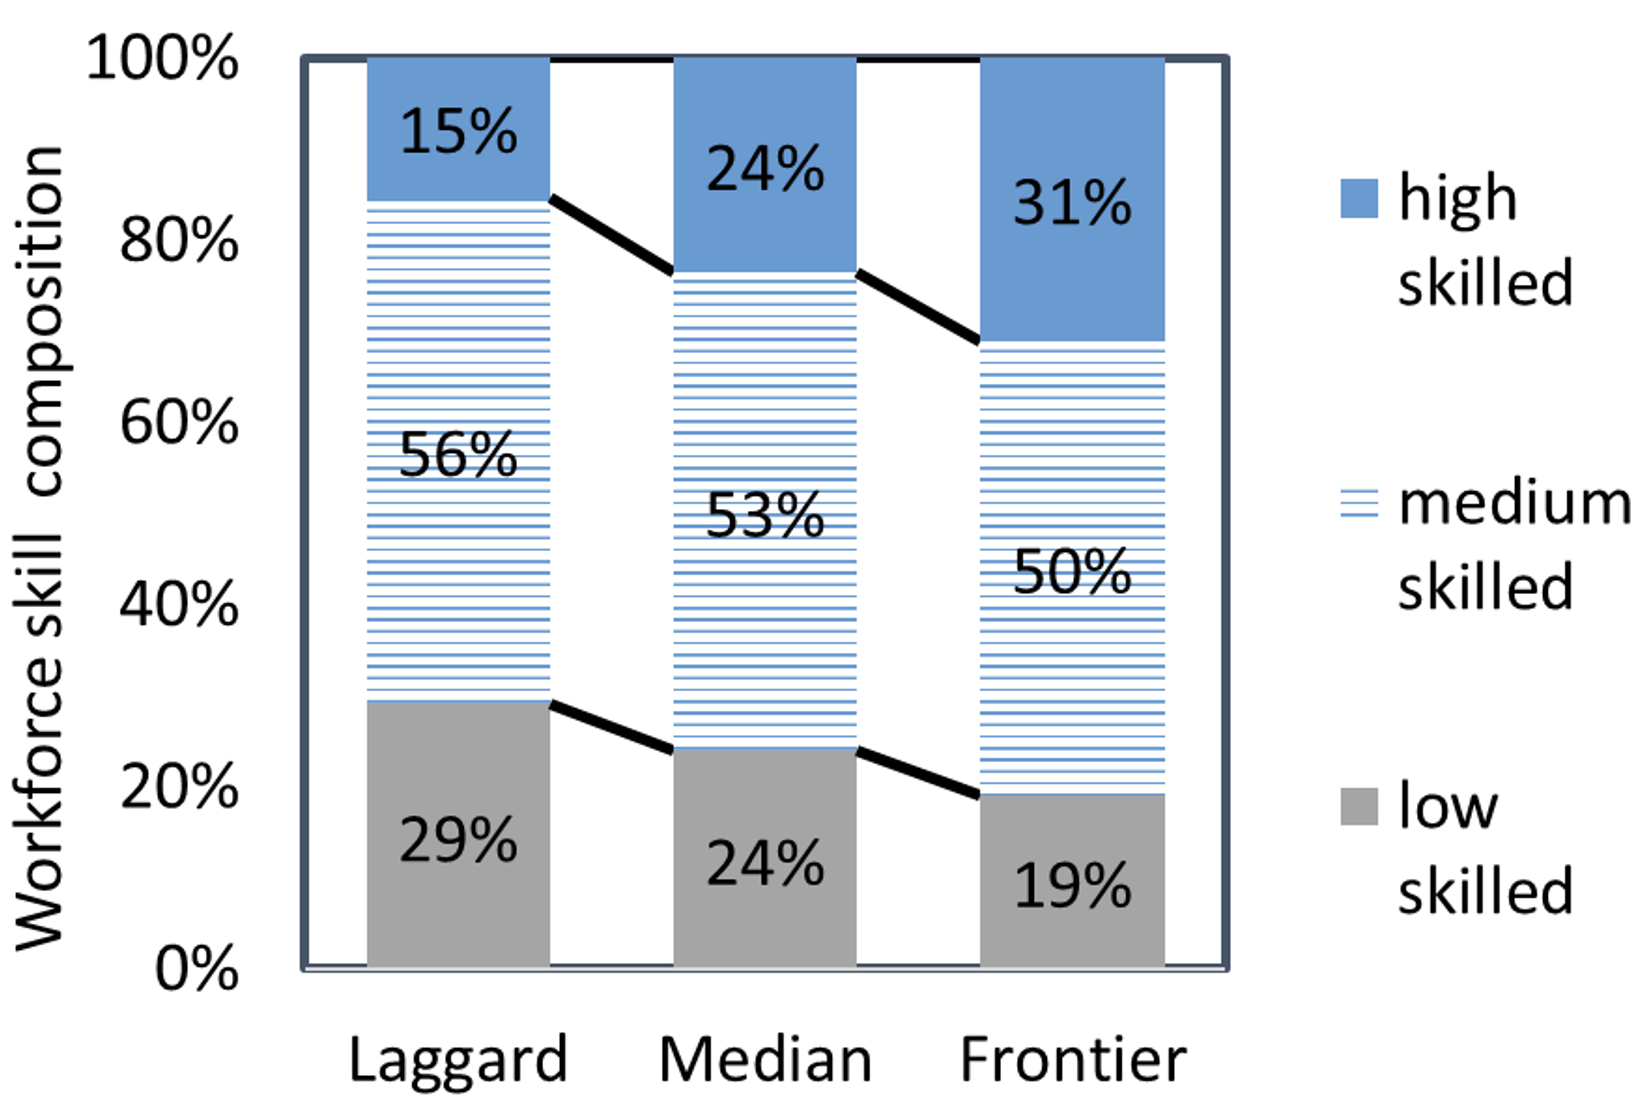
In all countries and sectors covered by our analysis, firms at the upper end of the productivity distribution have a larger share of high-skilled workers, especially in manufacturing and knowledge-intensive services (Figure 2A), a tendency that has been increasing over the past two decades. Conversely, in these firms the shares of medium- and low-skilled workers are lower (and generally decreasing over time). An exception to this is found among less knowledge-intensive services (wholesale, retail, transport, hotels and restaurants, etc.), where the most productive firms also employ a higher share of medium-skilled workers.
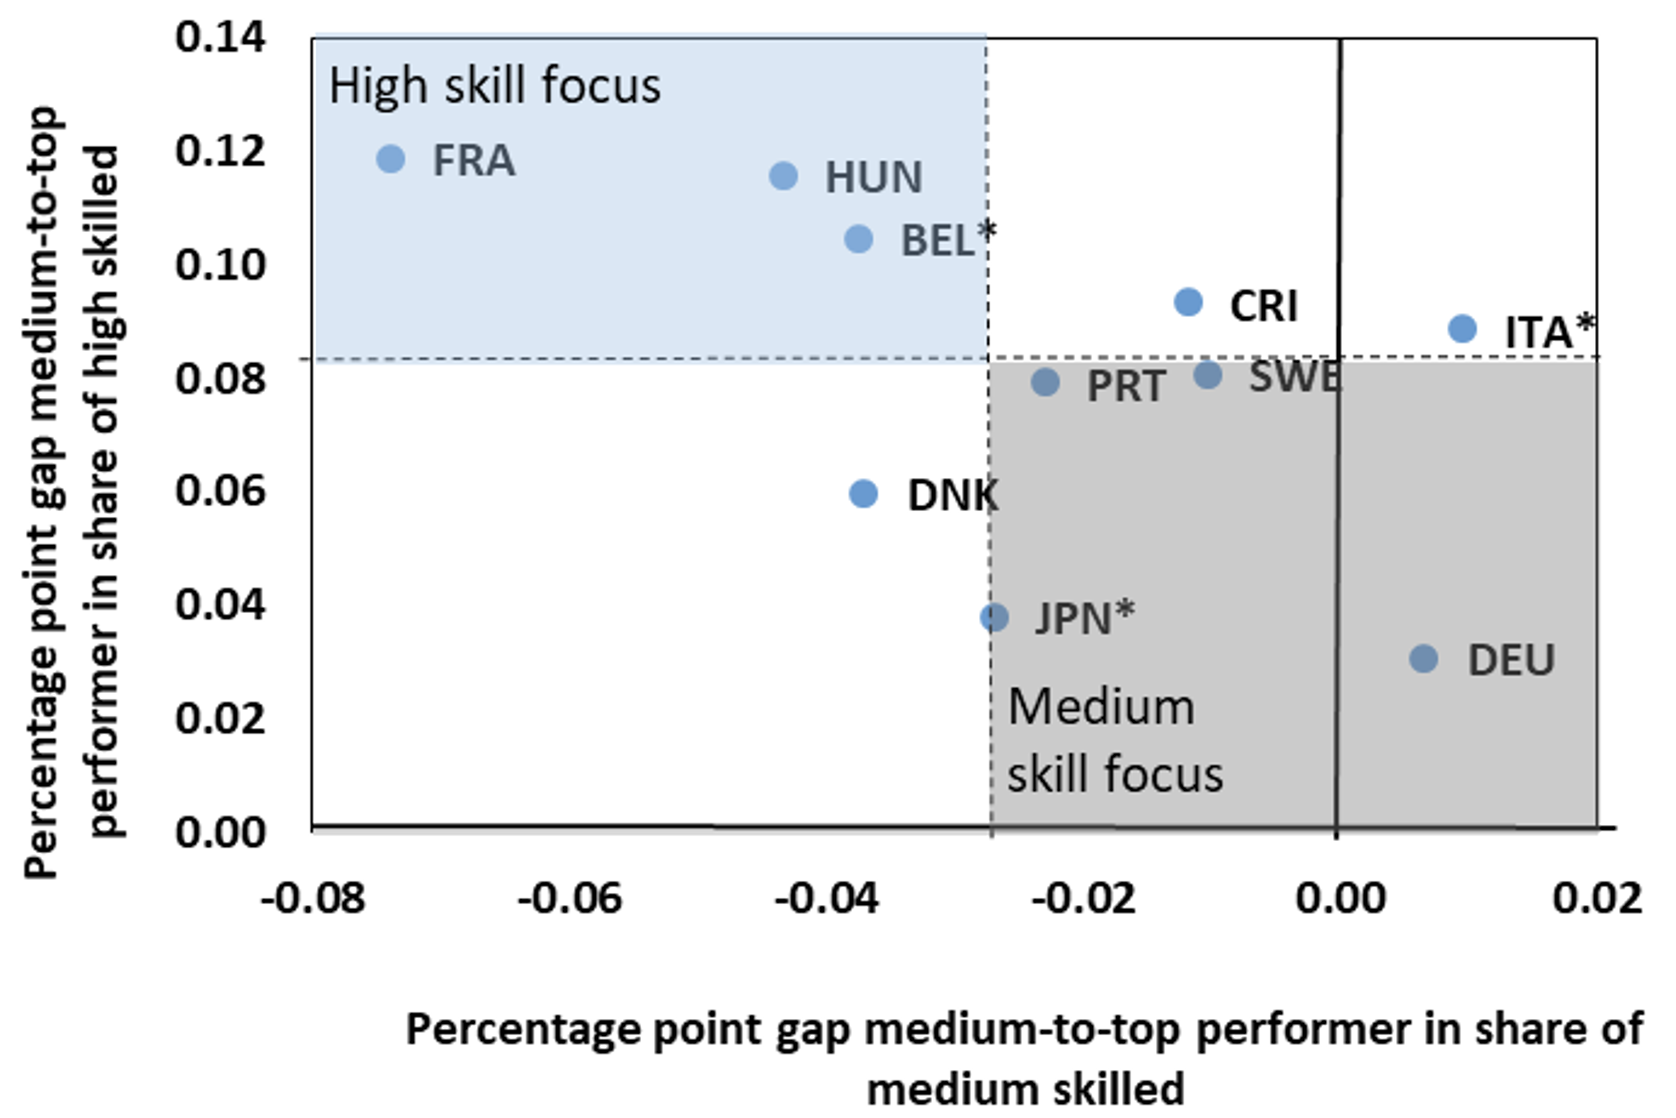
Moreover, the extent to which high- and medium-skilled workers are concentrated in top productivity firms varies across countries, with French top firms having a higher share of high-skilled than elsewhere and German and Italian top firms having a higher share of medium-skilled (Figure 2B). This suggests a variety of strategies to achieve high productivity depending on sector and country characteristics, which in turn are likely to reflect education and training policies. We find that highly productive firms also differ in having a larger share of their workforce with managerial, communication and ICT skills relative to other firms. Thus, there is wide scope for productivity catch up by increasing education and training, though this may be easier to achieve with specific tasks like ICT ones than with more general ones, like management and communication.
Figure 2 Skills and productivity gaps
A) Use of skills differs a lot across the productivity distribution…
Note: The figure shows workforce skill composition along the productivity distribution. Workforce composition shown as firm-level shares of low, medium and high skilled employees. Firm-level shares are computed as average firm-level skill group shares by productivity group x STAN A38 industry x year x country; results shown are averaged by productivity group across STAN A38 industries x years x countries. Baseline skill measure is based on 2-digit ISCO08 occupations ranked by cognitive test scores from PIAAC; where occupational data in sufficient detail is not available, educational attainment is used. More details on the construction of skill groups can be found in Box 3 and in Annex A of Criscuolo et al (2021). Frontier, median and laggard firms refer to 90th, 40-60th and 10th percentile of the productivity distribution by country x STAN A38 industry x year. Productivity is measured as log of value added per worker.
Source: Criscuolo et al (2021).
B) … and this pattern varies significantly across countries
The relative concentration of high (vertical axis) and medium skilled (horizontal axis) at the productivity frontier, in percentage points
Note: Figure shows high skill gap at the productivity frontier, i.e. the difference in the share of high skilled employees at frontier versus median firms, plotted against the corresponding medium skill gap by country. Results are based on average firm-level share of medium- and high-skilled employees by productivity group x STAN A38 industry x year x country cell. Skill gaps are computed as difference between share of respective skill group averaged across industries by country. Baseline skill measure is based on 2-digit ISCO08 occupations ranked by cognitive test scores from PIAAC. Countries where skill measure is based on education levels because occupations were not available in sufficient detail are marked by asterisk (*). More details on the construction of skill groups can be found in Box 3 and in Annex A of Criscuolo et al (2021). Frontier and median firms refer to 90th and 40-60th percentile of the productivity distribution by country x STAN A38 industry x year. Productivity is measured as log of value added per worker.
Source: Criscuolo et al (2021)
Managers, workers, and productivity gaps
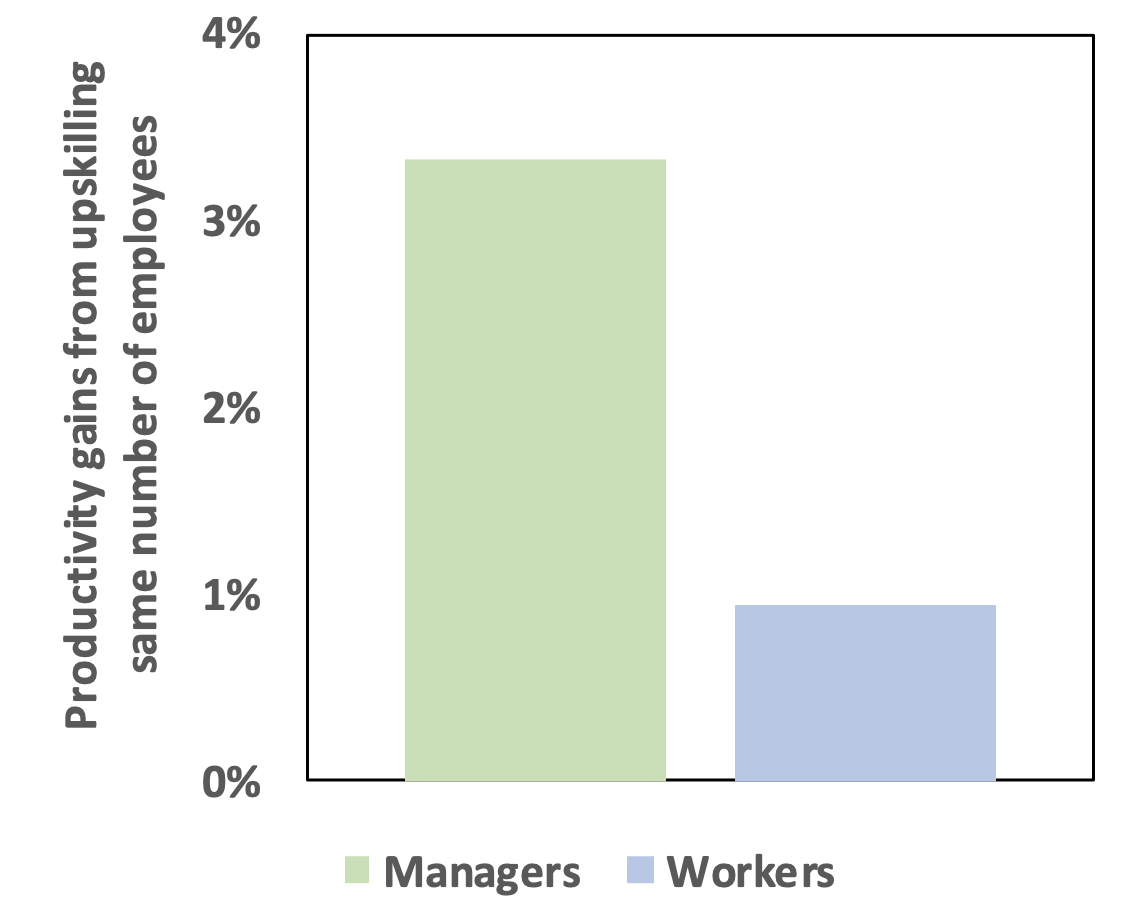
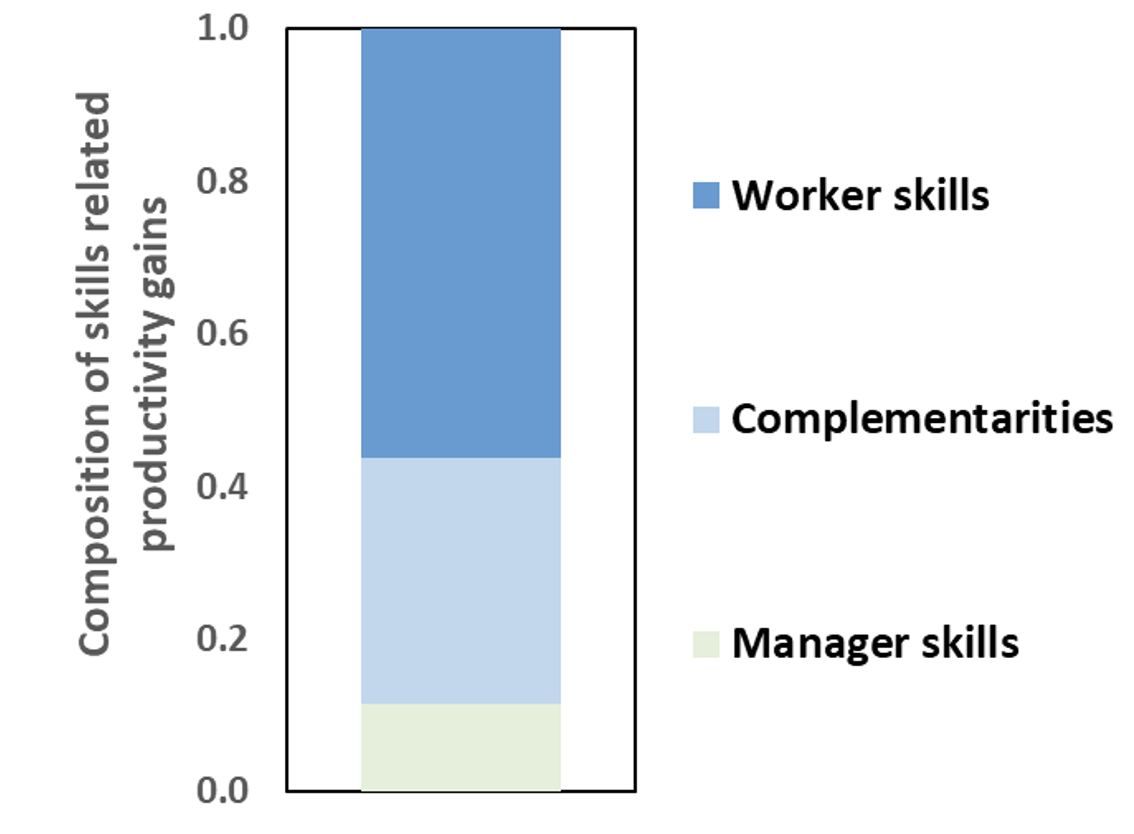
We also find that top productivity performers tend to devote more resources to formal managerial roles than other firms do: the share of managers in top firms is higher, especially in market services, with the difference being highest in the knowledge intensive ones. Moreover, the productivity gains associated with the upskilling of managers is estimated to be more than three times as large as the upskilling of the same number of workers (Figure 3A), pointing to the key role played by managerial talent and business organization for productivity. Of course, given the larger share of workers in the average firm, upskilling both managers and workers to match skill levels found at the productivity frontier would still see the largest productivity contribution coming from more educated workers, especially when combined with highly skilled managers (Figure 3B).
Figure 3 The combination of high skilled managers and workers boosts productivity
A) The effects of upskilling managers and workers
Note: The Figure shows the percentage change in productivity for the medium productivity firm associated with replacing medium skilled managers (workers) with high skilled managers (workers) corresponding to 1% of the firm’s workforce. Percentage change in productivity is approximated by difference in log productivity. Results are based on coefficients of skill-shares among managers and workers on log productivity, estimated from baseline regression at the firm-level separately for each country, multiplied by change in shares corresponding to 1% of average firm-level employment in the respective country. Baseline regression described in Annex A and Box 1 of Criscuolo et al (2021). More details on the construction of skill groups can be found in Box 3 and in Annex A of Criscuolo et al (2021). Results are first computed by country and then averaged across countries. High skilled workers x managers correspond to employees employed in top quartile occupation of within-country occupational wage distribution. Managers and workers are identified based on occupations. Occupational classifications used are 2-digit ISCO 08. Frontier and medium firms refer to 10th decile and 40-60th percentile of the productivity distribution within country x STAN A38 industry x year cells. Productivity is measured as log of value added per worker.
Source: Criscuolo et al (2021).
B) The overall effects of combining high-skilled managers and workers
Note: Figure shows contribution to total productivity gains from adjusting skill composition of managers and workers for medium firm to match skill composition of frontier firm by sector. Results are based on coefficients of skill-shares among managers and workers on log productivity, estimated from baseline regression at the firm-level separately for each country and sector, multiplied by difference in shares between typical frontier and medium firm in the respective country-sector. Baseline regression described in Annex A and Box 1 of Criscuolo et al (2021). More details on the construction of skill groups can be found in Box 3 and in Annex A of the same paper. Results are first computed by country-sector and then averaged across countries by sector. Skill groups for workers x managers based on within-country occupational wage distribution. Managers and workers are identified based on occupations. Occupational classifications used are 2-digit ISCO 08. Frontier and medium firms refer to 10th decile and 40-60th percentile of the productivity distribution within country x STAN A38 industry x year cells. Productivity is measured as log of value added per worker.
Source: Criscuolo et al (2021)
The role of gender and cultural diversity
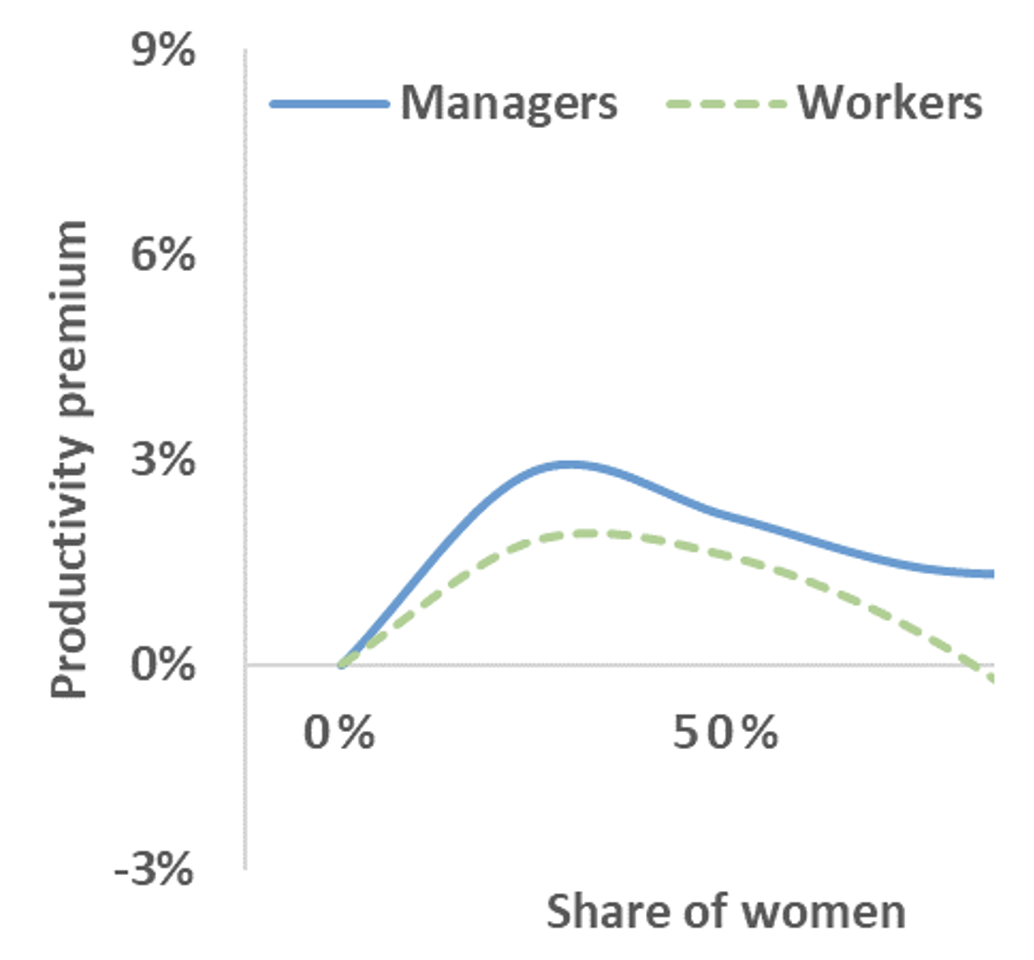
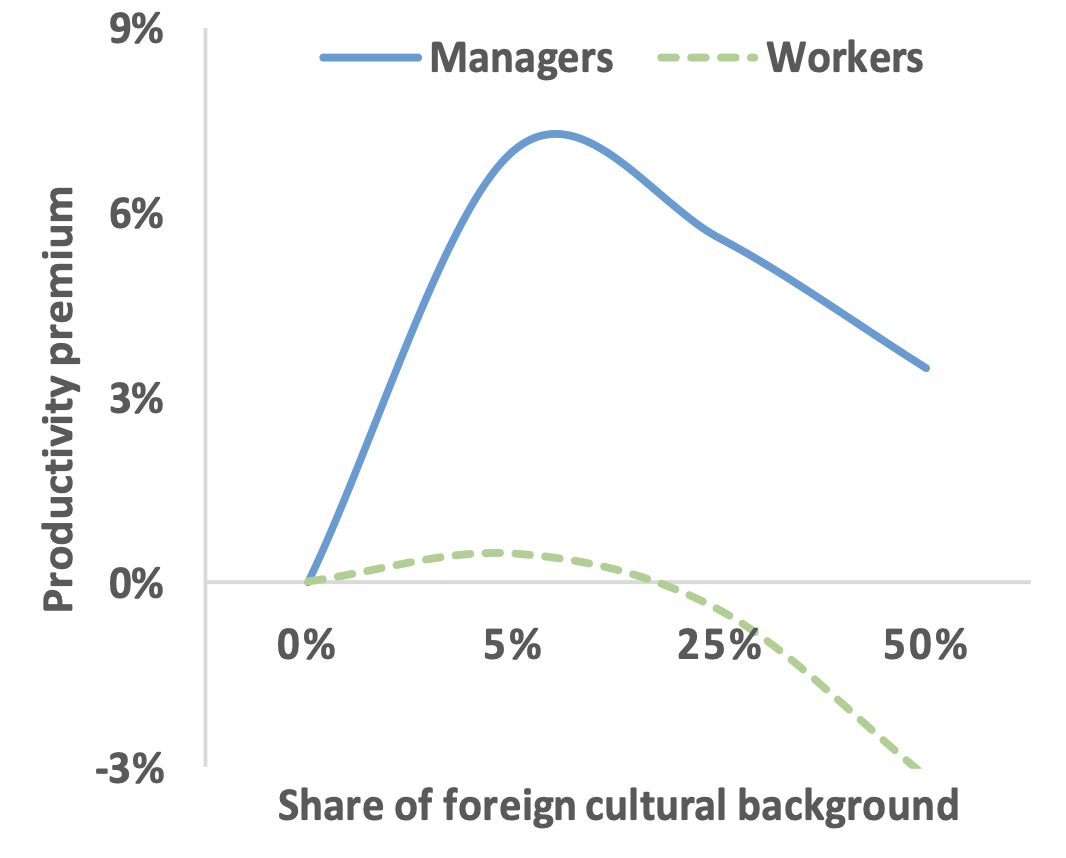
Finally, staff diversity, both in gender and foreign cultural background (proxied by country of birth or nationality), also emerges as an important factor for productivity, though with some more nuances. Controlling for a number of other potential influences on productivity – such as skill and occupational structures, managerial roles and industry characteristics – we find that, up to a point, there is a productivity premium for having a more diverse workforce – and especially management – in the firm (Figures 4A and 4B). While there are diminishing productivity returns to diversity, with the premium eventually becoming a penalty in the case of workers that are culturally too heterogeneous, most firms in our sample are on the ‘upward’ side of the curve (to the left of the peak), where diversity is too weak and increasing it would be associated with a productivity premium. Therefore, the majority of firms would likely gain in productivity from recruiting more women and more staff with foreign cultural backgrounds.
Figure 4 The diversity productivity premia
A) Gender diversity
Note: Figure shows productivity premium associated with employing a higher share of women among managers or workers respectively. Results shown are smoothed dummy estimates for women share bins (in 20 percentage point categories) compared to the baseline category of having a women share of 0-20% in the respective group by sector. Productivity premium is approximated by difference in log productivity. Results are based on baseline firm-level regression estimated separately for each country. Baseline regression described in Annex A and Box 1 of Criscuolo et al (2021). Estimates shown are averaged across countries; estimates insignificant at the 10% confidence level are replaced with 0 when computing the average. Managers are identified based on 2-digit ISCO 08 occupations. Productivity is measured as log of value added per worker. On average across countries, most firms are located in categories 0-40% and less than 25% of firms located in categories 60-100%, are so identification of categories above 60% is based on relatively few observations and thus more uncertain.
Source: Criscuolo et al (2021)
B) Cultural diversity
Note: The figure shows the change in firm-level productivity associated with employing a higher share of managers or workers with foreign cultural background respectively compared to the baseline category of having a share of of 0-5% with foreign cultural background in the respective group. Percentage change in productivity is approximated by difference in log productivity. Results are based on coefficients of foreign cultural background share categories among managers and workers on log productivity, estimated from baseline regression at the firm-level separately for each country. Baseline regression described in Annex A and Box 1 of Criscuolo et al (2021). Estimates shown are averaged across countries ; estimates insignificant at the 10% confidence level are included with 0 when computing the average. Managers are identified based on 2-digit ISCO 08 occupations. Productivity is measured as log of value added per worker. On average across countries, about 90% of firms are located in the 0-25% region, so the estimates for categories above 25% are based on relatively few observations and thus more uncertain.
Source: Criscuolo et al (2021).
Achieving inclusive productivity growth via the Human Side
All in all, our results indicate that much of the productivity gaps between typical and top performers could potentially be closed by improving the managerial, skill, and diversity structure, with the largest boost provided by the combination of upskilling workers and managers (Figure 5). These results are based on averaging firm-level regression results from individual countries that control for a number of different factors that may generate differences in productivity across firms (such as detailed industry and year fixed effects, firm size categories, differences in the composition of the workforce due to demographics and occupational structure). They also demonstrate that the pursuit of efficiency and of stronger inclusion of workers via skill upgrading, gender equality and cultural diversity may be complementary goals.
Figure 5 Closing the productivity gap via the Human Side
Note: The figure shows the productivity gains for medium firm from adjusting components of the Human Side as percentage of productivity gap between top and medium performer. Adjustments for manager-share and skill structure correspond to medium firm adopting values at frontier; for gender and cultural diversity measures, adjustments correspond to non-diverse firm adjusting to diversity levels with the highest estimated productivity levels (gender diversity: 20-40%; cultural diversity: 5-10% of the workforce with foreign cultural background). For manager-share and skill structure adjustments correspond to catching adopting; gender & cultural diversity. Counterfactuals are based on baseline regression described in Annex A and Box 1 of Criscuolo et al (2021). More details on the construction of skill groups can be found in Box 3 and in Annex A. Results are first computed by country and then averaged across countries. Manager- and skill classifications based on 2-digit ISCO 08 occupational classifications. Frontier and medium firms refer to 10th decile and 40-60th percentile of the productivity distribution within country x STAN A38 industry x year cells. Productivity is measured as log of value added per worker.
Source: Criscuolo et al (2021).
While this cannot be achieved overnight and at low cost, public policies can play a strong role in helping firms reduce productivity gaps through their Human Side. Policies can help laggards catch up with best practice firms by enhancing the quality and supply of workers’ and managers’ skills across the whole skill spectrum, not only focusing on the highest skill segment. This can be achieved via appropriate extension and upgrading of education and training systems as well as by facilitating the matching of workers to jobs (e.g. by enhancing information, mobility and allowing flexible working arrangements). They can also leverage the productivity benefits of diversity by making social benefits and taxes more friendly to working women, by establishing gender quotas where needed and by improving immigration policies. Reforms aimed at the human side of firms would reap a double dividend: they hold the potential to reverse rising productivity dispersion and its negative consequences on aggregate productivity growth while at the same time containing wage inequality, increasing the inclusiveness and equity of our economies.
References
Andrews, D, C Criscuolo and P Gal (2017), “The best vs the rest: The global productivity slowdown hides an increasing performance gap across firms”, VoxEU.org, 27 March.
Bartelsman, E. and M. Doms (2000), “Understanding Productivity: Lessons from Longitudinal Microdata”, Journal of Economic Literature.
Bartelsman, E, J Haltiwanger and S Scarpetta (2013), "Cross-Country Differences in Productivity: The Role of Allocation and Selection", American Economic Review 103(1): 305-34.
Berlingieri, G, P Blanchenay and C Criscuolo (2017), “Great Divergences: The growing dispersion of wages and productivity in OECD countries”, VoxEU.org, 15 May.
Berlingieri, G, P Blanchenay, S Calligaris and C Criscuolo (2017b), "The Multiprod project: A comprehensive overview", OECD Science, Technology and Industry Working Papers No. 2017/04.
Berlingieri, G, S Calligaris, C Criscuolo and R Verlhac (2020), "Laggard firms, technology diffusion and its structural and policy determinants", OECD Science, Technology and Industry Policy Papers, No. 86.
Brynjolfsson, E, D Rock and C Syverson (2021), “The Productivity J-Curve: How Intangibles Complement General Purpose Technologies”, American Economic Journal: Macroeconomics 13(1).
Criscuolo, C, P Gal, T Leidecker and G Nicoletti (2021), "The human side of productivity: Uncovering the role of skills and diversity for firm productivity", OECD Productivity Working Papers No. 29.
Haskel, J and S Westlake (2018), “Productivity and secular stagnation in the intangible economy”, VoxEU.org, 31 May.
Goldin, I, P Koutroumpis, F Lafond and J Winkler (2021), “Re-evaluating the sources of the recent productivity slowdown”, VoxEU.org, 31 May.
OECD (2015), The Future of Productivity.
OECD (2021), The Role of Firms in Wage Inequality: Policy Lessons from a Large Scale Cross-Country Study.
Südekum, J, J Stiebale and N Woessner (2020), “Robots and the rise of European superstar manufacturers”, VoxEU.org, 30 July.
Syverson, C (2011), “What Determines Productivity?”, Journal of Economic Literature 49(2): 326-65.
Tambe, P, L Hitt, D Rock and E Brynjolfsson (2020), “Digital Capital and Superstar Firms”, NBER Working Paper No. 28285
Endnotes
1 https://www.oecd.org/global-forum-productivity/
