Fiscal discipline looks set to start 2012 as it ended 2011: centre-stage in the Eurozone debate (Wyplosz 2011). While the fiscal compact agreed upon in December 2011 sets out new fiscal rules, many are expecting another round of emergency summits. This column studies the evolution of debt-to-GDP ratios in some of the EU’s most troubled economies in hopes of finding the right policy responses.
Debt-to-GDP ratios started to increase in Europe in 2008 (Cafiso 2011a). This was when governments undertook measures in an effort to avoid things getting any worse – they put in place stimulus packages and rescued large financial institutions. In previous research, we disentangled the average debt-to-GDP ratio variation in the period 2008–10 by considering its structural drivers: primary balance, real growth and interest payments (Cottarelli et al 2010).1 Our discussion here focuses on six particularly troubled EU countries: Greece, Ireland, Italy, Portugal, Spain, and the UK. Apart from Italy, these are the countries that have experienced a debt-to-GDP ratio increase above that of the EU15 average in 2008–10 (see Table 1).
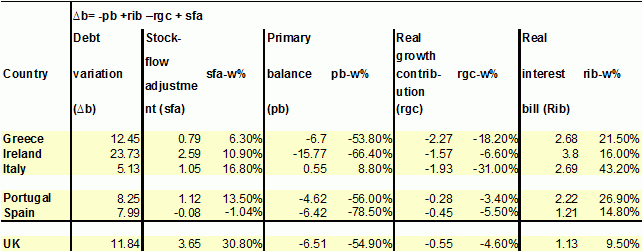
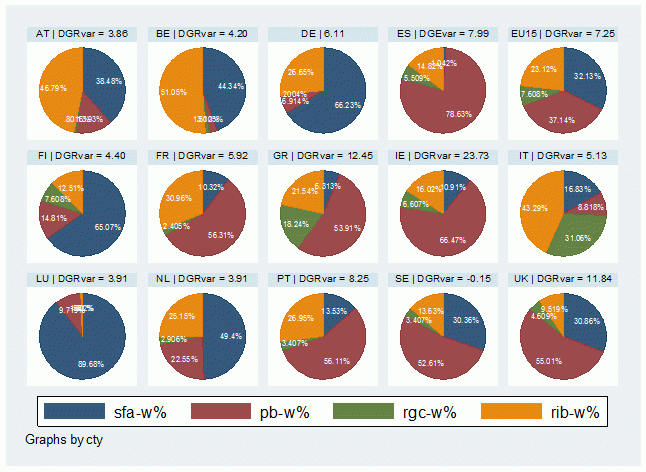
The contribution of each component to the debt-to-GDP ratio variation is reported in Table 1 in percentage of GDP and in percentage share (w%) over the total variation; the contribution in w% is also plotted in Figure 1.2
1. The primary balance (PB)
The debt-to-GDP ratio increase is mainly primary-balance driven for the six countries under consideration; however, Italy differs in this regard.
The primary-balance share of the debt-to-GDP ratio variation is 37.1 w% for the EU15 group (row ‘eu15’ in Table 1). In the six countries studied, the primary-balance share of the debt-to-GDP ratio variation is positive for all apart from Italy (a deficit increases the debt-to-GDP ratio) and higher than 50.0 w%; it reaches 78.59 w% for Spain. Italy’s primary-balance contribution is negative, however, because of its primary surplus and it amounts to 8.83 w%.
2. The real interest bill (RIB)
Apart for countries with a large debt-stock and a sound primary-balance stance, interest payments have had a minor effect on the debt-to-GDP ratio so far.
The real interest bill has the largest share for Italy (43.24 w%), Portugal (27.0 w%) and Greece (21.56 w%) in the six heavily-indebted countries. The bill is directly related to the outstanding amount of debt, this is why its weight is at the top for Italy and Belgium.
Nonetheless, if the ongoing turmoil in the sovereigns market persists, the interest bill will increase considerably in future.3
Table 1. Decomposition of debt-to-GDP ratio variation (2008–10), percentage of GDP and percentage share
SIX STUDIED COUNTRIES
OTHER EU COUNTRIES AND AVERAGES
Notes: • All values are averages of 2008, 2009, 2010 figures • ∆b is the debt variation, sfa is the stock-flow adjustment, pb is the primary balance, nib is the nominal interest bill, icf is the inflation correction factor, rib is the real interest bill, rgc is the real growth contribution. • Percentage shares (w%) are calculated over the sum of the absolute value of sfa, pb, rgc, rib; by so doing shares sum up to 1.
Figure 1. Decomposition of debt-to-GDP ratio, percentage shares
Notes: • Above each pie, the debt-to-GDP ratio variation for the specific country is reported. • sfa-w% is the Stock-Flow Adjustment share, pb-w% is the primary-balance share, rgc-w% is the real growth contribution share, rib-w% is the real interest bill share.
3. The contribution of growth (RGC)
Real GDP has decreased considerably in 2008–10. This has contributed to the worsening of the debt-to-GDP ratio directly (GDP decreases while debt increases) and indirectly (through less tax revenue, the primary balance worsens).
Real GDP dropped dramatically in 2009 in the EU15 countries. Consequently, the real-growth contribution is negative for almost all the EU15 countries. In terms of shares, the real-growth contribution accounts for -7.62 w% for the EU15 group. In the group of six the real-growth contribution is relevant only for Italy (-31.0 w%) and Greece (-18.25 w%).
Italy’s large real-growth contribution share recalls statements affirming that worries on the sustainability of its large debt depend particularly upon its low/null growth perspectives.
Debt Projections
Debt-to-GDP ratio projections can be used to assess EU countries’ fiscal stance before the crisis, and to consider what the trend would be if the economy were to perform (on average) as in the past.4
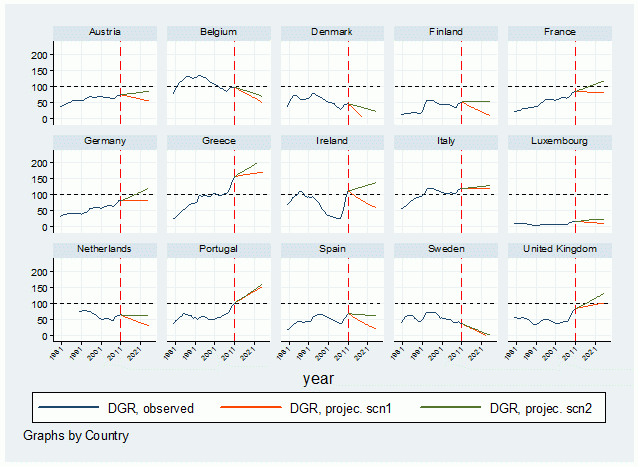
We consider two scenarios. In scenario 1, the parameters are set equal to their 2005–07 average. We name this the ‘Positive Scenario’ where EU15 countries are supposed to enjoy pre-crisis growth rates. In scenario 2, the parameters are set equal to their 1999–2010 average. This is the period available since the introduction of the euro in 1999 and it includes the years of economic crisis; scenario 2 is less favourable both in terms of growth and interest rates on debt rollover. Projections are plotted in Figure 2 (values are in Cafiso 2011a).5
Projections show that the debt-to-GDP ratio has an increasing trend for Greece and Portugal regardless of the scenario considered. Ireland exhibits a decreasing trend in scenario 1, but an increasing one in scenario 2 with this difference depending on a lower growth rate and a primary deficit in scenario 2 (indeed, scenario 2 includes the crisis years 2008–09). The UK too exhibits an increasing trend in both scenarios; with scenario 2 having a steeper evolution because of lower growth and a larger primary deficit. For Spain the opposite holds true; the strong economic performance of Spain in both 2005–07 and the larger part of 1999–2010 drives its debt-to-GDP ratio downwards in both scenarios (the decreasing trend develops much faster in scenario 1). Italy’s debt-to-GDP ratio evolution is limited under both scenarios, its debt-to-GDP ratio remains constant in scenario 1.
Greece and Portugal exhibit an unsound debt-to-GDP ratio evolution in both scenarios: their previous stance is unsustainable in the future. On the contrary, Ireland’s stance before the crisis was sound (scenario 1) and it would lead to a lower debt-to-GDP ratio. Concern regarding Spain and Italy’s debt sustainability cannot depend on their past stance, which is sound particularly for Spain.
Figure 2. Debt-to-GDP ratio projections under different scenarios, 2012–25
Notes: • debt-to-GDP ratio projec. 1 stands for projections under scenario 1, debt-to-GDP ratio projec. 2 stands for projections under scenario 2. • The projection period is 2012–25 (14 years). Last year is 2011, this works as initial condition.
Concluding remarks
The generalised debt-to-GDP ratio increase in 2008–10 depends on the deterioration of the primary balance; interest payments and economic growth have only worsened its effect so far. However, current spread levels alert us to the possibility of an increasing interest-bill burden in the near future. Italy stands out in the group studied because it is the only country that has maintained a sound fiscal stance throughout (Cafiso 2011a); its debt-to-GDP increase in 2008–10 depends mainly on the burden of its large debt-stock and on low growth.
Projections suggest that some European countries had an unsound fiscal stance (in terms of debt-to-GDP ratio evolution) well before the 2008–09 financial crisis (Greece, Portugal, the UK); on the contrary, others had a sound fiscal stance (Spain, Ireland, Italy).
ECFIN’s forecasts of the 2011 debt-to-GDP ratio level suggest a further increase in the debt-to-GDP ratio in 2011–12 for almost all Eurozone countries (ECFIN 2011). Moreover, a slowdown its expected in 2013. An inversion of the debt-to-GDP evolution based on deficit-cuts is unlikely in the short-run because it is extremely costly (as argued in Cafiso and Cellini 2011) and probably not even effective (Gros 2011).
References
Cafiso G (2011a), Debt Developments and Fiscal Adjustment in the EU, Intereconomics, forthcoming.
Cafiso G (2011b), “A guide to Public Debt equations”, Working paper series, SSRN eLibrary.
Cafiso G and R Cellini (2011), “Consequences of the new EU debt-reduction rule”, VoxEU.org, 3 November.
Cecchetti, S, M Mohanty, and F Zampolli (2011), “The future of public debt: prospects and implications”,BIS Working Papers No 300, Bank for International Settlements.
Cottarelli, C, L Forni, J Gottschalk, and P Mauro (2010), “Default in Today's Advanced Economies: Unnecessary, Undesirable, and Unlikely”, IMF Staff Position Note SPN/10/12, International Monetary Fund.
ECFIN (2011), European Economic Forecasts – Autumn 2011, European Economy 6|2011.
Gros D (2011), “Can Austerity be self-defeating?”, VoxEU.org, 29 November.
Wyplosz, C (2011), “Getting there, slowly though”, VoxEU.org, 9 December.
1 The yearly debt variation is largely driven by the financing needs of the government (net balance including interest, ESA95), but other government’s operations determine the evolution of debt by an amount known as Stock-flow Adjustment (SFA). The SFA amount depends upon operations which either generate debt but not deficit, or vice versa, and which have a more financial, non-budget origin. The weight of SFA on debt-to-GDP ratio variation is not trivial (Table 1).
2 Some components contribute positively, other negatively; to convey the relevance of each with respect to the debt-to-GDP ratio variation we consider percentage shares.
3 As of November 2011, Italy and Spain’s spreads have exceeded 450 basic points with respect to the 10-year German Bund, this will soon affect the primary market and consequently the interest bill.
4 Projections are done using the solution of the debt equation. See section 4 in Cafiso (2011b) about this.
5 The parameters that characterise each scenario are the interest rate on debt rollover (IR), the nominal GDP’s growth rate (NGR), the primary balance (PB) and the stock-flow adjustment (SFA). All are country-specific. It is well to remember that the future debt-to-GDP ratio path will depend also on the evolution of aging population-related expenditures (that is, retirement and health costs). See Cecchetti et al. (2011).


