During the last decade, inflation has become a leading concern for India’s economic policymakers and citizens. Worries have grown as the inflation rate (measured as the 12-month change in the consumer price index) rose from 3.7% to 12.1% between 2001 and 2010. The inflation rate has since fallen, reaching 3.7% in February 2017, leading to a debate about whether it will rise again.
What explains the movements in India’s inflation rate? Economists, policymakers, and journalists have all proposed answers. Many emphasise the increases in food price inflation, especially for staples such as pulses, milk, fruits, and vegetables (Gokarn 2011). Shifting dietary patterns, rising rural wages, government price supports and its rural unemployment guarantee scheme may also have driven these price increases (Rajan 2014). Some have suggested that the monetary and fiscal stimulus following the crisis led to higher inflation, while others cite supply-side constraints from policy bottlenecks.
Headline and core inflation
Raghuram Rajan, the former governor of the Reserve Bank of India, feared that if high levels of inflation became embedded in the expectations of price-setters, it would create a self-sustaining inflationary spiral (Rajan 2014). Recent debates about inflation in India are reminiscent of the discussions about inflation in advanced economies in the 1970s and 1980s, when inflation in the US and Europe reached double digits. These debates created a large body of research on inflation, especially in the US.
We have drawn on this literature to explore inflation in India. Despite differences between the Indian and US economies, the factors that drove inflation were similar in many respects. In our recent paper, we explore the distinction between headline and core inflation, which is a fundamental issue in discussions of inflation (Ball et al. 2016). Core inflation captures the underlying trend, while headline inflation fluctuates around the core because of changes in the relative prices of goods – ‘supply shocks’. We follow the Federal Reserve Bank of Cleveland’s approach to measure core inflation by taking the weighted median of price changes across industries. To implement this approach for India, we examine the inflation rate in the wholesale price index (WPI). Given that WPI inflation is highly disaggregated by sector, we can compute a historical series for median inflation.
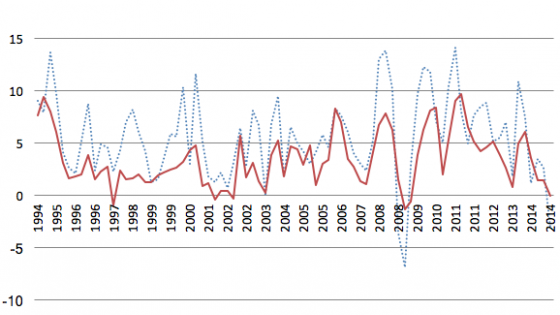
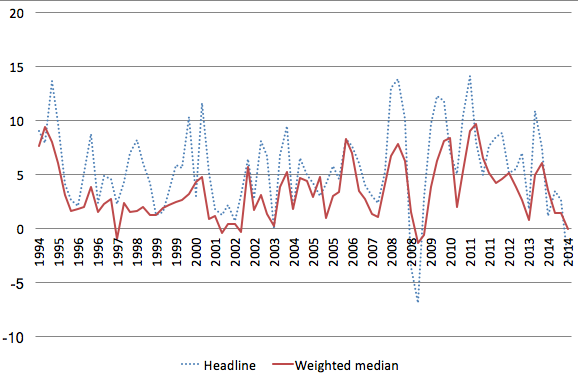
We find that weighted median inflation in India was substantially less volatile at the quarterly frequency than headline inflation, which is consistent with patterns for advanced economies. Unlike these economies, however, we find that the average level of median inflation (about 3.4% per year since 1994) in India was substantially lower than the average level of headline inflation, which was 5.6% (Figure 1).
Figure 1 Quarterly WPI Inflation in India: Headline and weighted median, 1994-2014
This is because the distribution of price changes across industries often skewed to the right – there was a tail of large price increases that raised headline inflation, but were filtered out of the median – and the distribution was rarely skewed to the left. Many of the large price increases that contributed to rising headline WPI inflation (but far from all of them) occurred for different types of food and fuel. This is consistent with the commonly held view that food prices strongly influenced aggregate inflation.
We also explore the determinants of core inflation. To do so, we estimate a Phillips curve, a version of a standard inflation equation used in textbooks and a large body of empirical research. In this equation, core inflation at the quarterly frequency depends on expected inflation – determined by past levels of inflation – and by the level of economic activity captured by the deviation of output from its long-run trend. We use data on weighted median inflation to find a Phillips curve for India and estimated its slope, which we cannot do with headline inflation because of its quarterly volatility. Our estimates of the Phillips curve are somewhat imprecise compared to estimates for advanced economies because the necessary data is available only since 1996, and is noisy, with substantial quarter-to-quarter movements in weighted median inflation. Nonetheless, we can make two conclusions about India’s Phillips curve:
- At any time, core inflation depended on many lags of past inflation with weights that declined slowly. We interpret this finding as reflecting slow adjustment of expected inflation. In particular, we estimate that a one-percentage-point deviation of inflation from its expected level changed expected inflation in the quarter that followed by only 0.1 percentage points. This inertia in expectations is consistent with the view that, once a high level of inflation becomes embedded in expectations, it is not easy to reduce.
- For a given level of expected inflation, there is a positive relationship between inflation and the deviation of output from trend. This effect is central to the textbook Phillips curve, but previous work has questioned the existence of an inflation-output trade-off for India. Alongside our finding about the slow adjustment of expectations, the estimated effect of output implies that monetary policy can reduce inflation, but with a short-run cost in output. In particular, we estimate a sacrifice ratio – the loss in percentage points of annual output needed for a permanent one-point fall in inflation – of approximately 2.7. This is similar in size to sacrifice ratios in other economies.
Finally, we study the dynamic interactions among core inflation, headline inflation, and supply shocks. One finding is that movements in headline inflation appear to influence expected inflation, and hence future levels of core inflation. As a result, a one-time supply shock, such as a large spike in food prices, can have a persistent effect on inflation. Like other aspects of India’s inflation, this finding is much like inflation in advanced economies during the 1970s and 80s.
In advanced economies, the nature of the Phillips curve has changed since the 1980s. Inflation expectations have become anchored at the inflation targets announced by central banks, and so one-time shocks no longer appear to have persistent effects on inflation. It has become easier for central banks to maintain stable inflation with less cost to output stability. Motivated by this experience in other countries, the Reserve Bank of India announced an inflation target of 4% from 2015. Time will tell how this policy change will affect inflation behaviour.
Core inflation and policy
Although we emphasise the usefulness of the weighted median inflation rate as a measure of core inflation, we still believe that conventional measures of headline inflation should have a central role in monetary policy. One reason is communication with the public. Another reason is our finding that headline inflation feeds into expected inflation, and hence future core inflation. At the same time, be believe it is vital for the Reserve Bank of India to examine core inflation to understand policy trade-offs.
References
Ball, L, A Chari, and P Mishra (2015), “Understanding Inflation in India”, Brookings-NCAER India Policy Forum, NBER WP No. w22948.
Gokarn, S (1997), “Economic reforms and relative price movements in India: a 'supply shock' approach”, The Journal of International Trade & Economic Development 6(2): 299-324.
Rajan, R (2014), “Fighting Inflation”, Inaugural speech, Governor, Reserve Bank of India at FIMMDA-PDAI Annual Conference 2014, Mumbai, February 26.


