A new, flourishing literature uses historical data to study the development of regions, cities, and neighbourhoods. For instance, the literature has provided novel insights into the role of agricultural productivity on urban growth (Nunn and Qian 2011), the long-run determinants of city structure (Brooks and Lutz 2019), the role of transportation on the spatial distribution of economic activity (Donaldson 2018), or the role of communication in sustaining trade (Steinwender 2018).
The reliance on historical experiments to understand drivers of the spatial distribution of activity is explained by the recent and systematic scanning of historical documents by libraries and archives. Some historical documents, such as maps, have the potential to capture a comprehensive, changing image of a city or a country over the very long run. However, a scanned document is not yet a proper data repository as it lacks a consistent data structure, such as well-identified observations, consistent identifiers across data sets, or harmonised variables. The digitisation of historical data, involving the recognition, encoding, and labelling of variables/observations in scanned archives, was often a labour-intensive task. The costs of research assistance were sometimes prohibitive due to the wealth of data. In a recent paper (Combes et al. 2020), we argue that it is time to exploit the recent developments in machine learning and substitute the labour-intensive approaches with an algorithm-based approach.
Research topics
There are numerous research questions in urban economics that could benefit from the systematic digitisation of historical archives, including the four below in particular.
First, the relationship between agricultural productivity and urbanisation is likely to depend on transport costs (Matsuyama 1992). When these costs are high, regions with high agricultural productivity urbanise – high productivity in agriculture releases labour into the manufacturing sector and into cities. When these costs are low, regions with high agricultural productivity rather specialise in agriculture and export their agricultural products to benefit from comparative advantages. These regions may grow at a slower pace as they benefit less from agglomeration economies in manufacturing. This literature would hugely benefit from the information on urbanisation and transport networks that can be extracted from historical maps.
Second, the long-run evolution of city structure may shed light on the underlying forces shaping land use in cities, for instance the changes in commuting patterns or the emergence of residential segregation. In particular, the development of the steam railway allowed the separation of workplace and residence in large cities such as London (Heblich et al. forthcoming-a). The location of polluting manufacturing industries and the prevailing direction in the dispersion of toxic fumes induced a residential sorting along income, which persisted over a long period (Heblich et al. forthcoming-b). Many different factors may underlie these neighbourhood dynamics – for example, city residents (including migrants) care about exposure to environmental amenities to different degrees and have different means of escaping it, the cost of land in different areas can lead to factories increasingly concentrating in (cheaper) low-amenity areas, or people who work in these industries may want to live nearby due to a lack of commuting options despite the worse amenities. The analysis of commuting patterns and segregation dynamics would gain tremendously from the extraction of city amenities, the geo-referencing of production units, and the digitisation of the different transportation modes. While the main data sources are historical maps, information on residents and firms may also be retrieved from the encoding of Census records or (usually manuscript) trade directories.
Third, interestingly, a growing literature uses archaeological information from ancient history to study the impact of trade and communication on economic activity. Barjamovic et al. (2019) extract administrative and commercial information written by Assyrian merchants on clay tablets to identify the structure of economic interactions between cities. They use the inferred gravity structure to predict the location of lost cities. A more systematic use of manuscript records of the Bronze Age could involve character recognition and text analysis algorithms, both based on recent developments in machine learning.
Finally, another growing literature studies the movement of workers across space during the Age of Mass Migration, its determinants, and its long-run impact (Boustan et al. 2010). Identifying such movements necessitates the exploitation of historical archives such as censuses, conscription lists, immigration cards, and ship passenger arrival lists. The main challenge is to link observations across individual census records, or with other sources, to study mobility within and across countries. Machine learning can be used to recognise individuals across censuses, based on a set of invariant characteristics. This is an area of research where machine-learning algorithms are already implemented, most notably on US data from 1850 onward (Abramitzky et al. 2019).
How to turn maps into data
Maps are a collection of highly unorganised information in which irregular writings, symbols, lines, or coloured surfaces must be interpreted and converted into data. Some map features can complicate this conversion, such as damage to the original map, imperfect junction of map tiles, information overlay, small changes symbols, or the drawing of different objects with same colours.
We use here the digitisation of a series of coloured maps - the 'Etat-Major' maps, circa 1860, covering the French territory – to illustrate the power of one method often used in visual recognition, called ‘random forest’, which is a (random) collection of decision trees. The objective is to label the large number of image pixels constituting each map tile across pre-defined categories (e.g., built-up, forest, field, water) in order to study land use at a very precise level (Gorin et al. 2020).
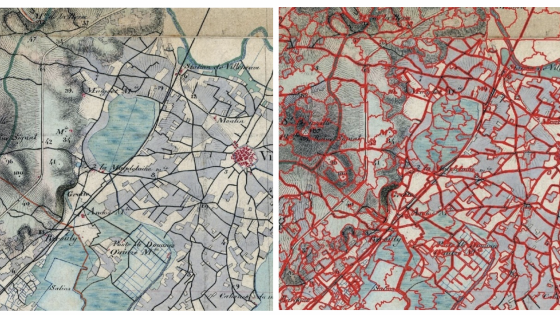
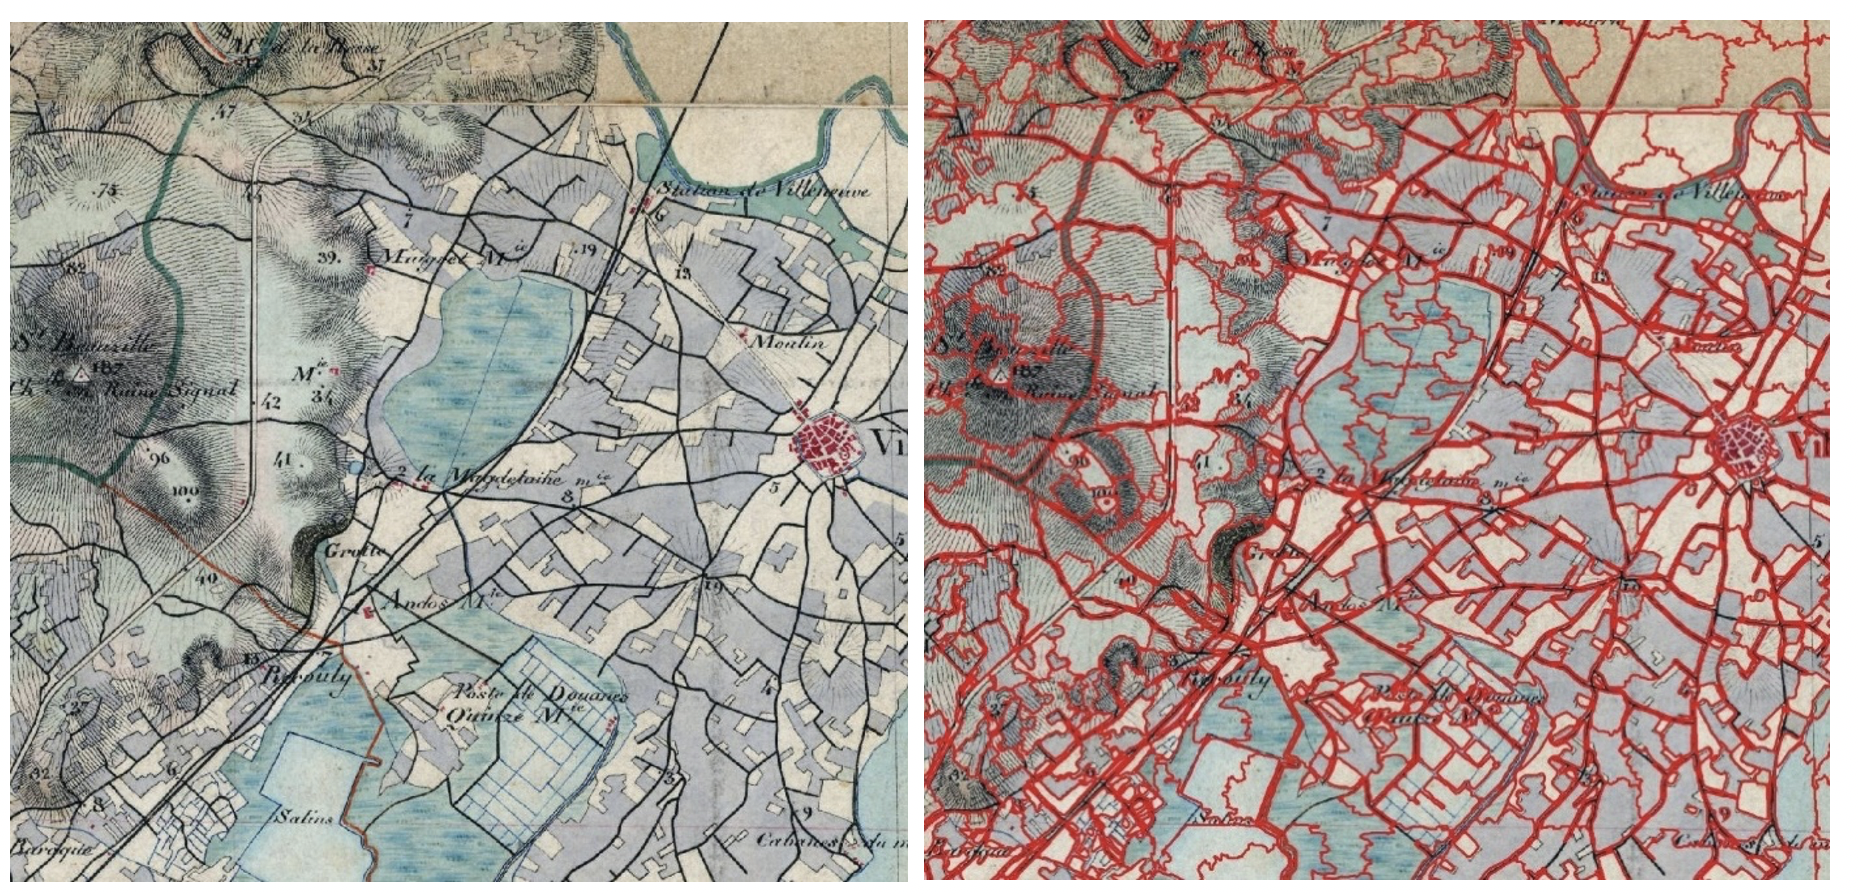
The random forest may directly be applied on pixels themselves. Pixels can also be collapsed into larger 'superpixels' in a preliminary step to reduce the dimensionality of the problem and mitigate the measurement error induced by small-scale noise (for example, due to contour levels or writings). This transformation is particularly relevant when the objects of interest are large (e.g. fields). The Quickshift algorithm allows pixels to be grouped into superpixels of irregular shape, but homogenous in colour, as illustrated in Figure 1.
Figure 1 Raw map (left panel) and superpixels (right panel)
The random forest procedure requires a training set, i.e. a set of pixels that have been manually classified and labelled. The training set does not need to be large (a few millions of observations) and may only represent a tiny fraction of the pixels to be eventually classified (several billions). One decision tree consists of a sequence of successive binary splits of pixels. Each split is based on a variable chosen among those characterising the pixels (at the very least their RGB colour bands, but also, for instance, the local variations of those, called ‘texture variables’), and a threshold chosen such as to minimise heterogeneity within the two resulting groups. Each decision tree stops when the final groups are considered as sufficiently homogenous – for example, they are composed of pixels that all have the same land use. A random forest is a (random) collection of decision trees – the observations on which each tree is trained/calibrated is only a random sub-sample of the whole training set and the variables used for each split are randomly drawn. For a given pixel, the prediction for the land use class is chosen as the predominant one across all decision trees (which constitute the random forest). The accuracy of the prediction arises from using a large number of different trees even though each is calibrated on a small number of pixels.
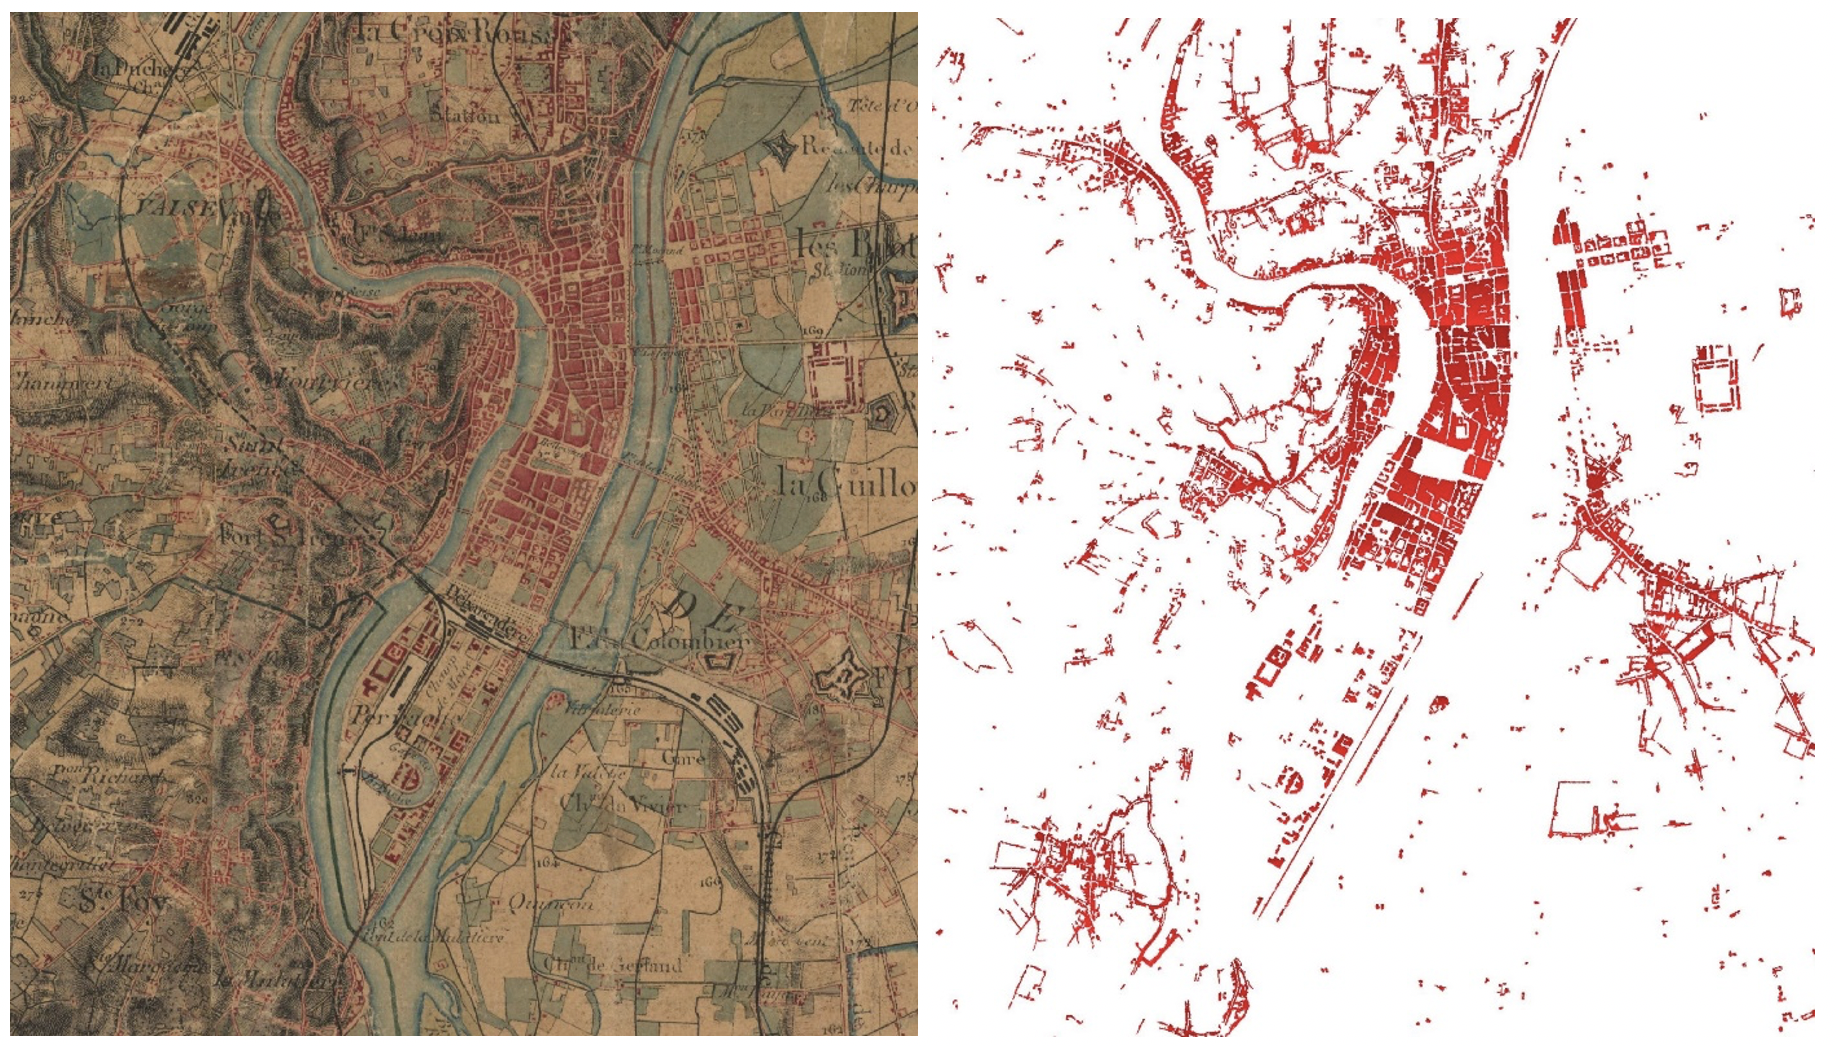
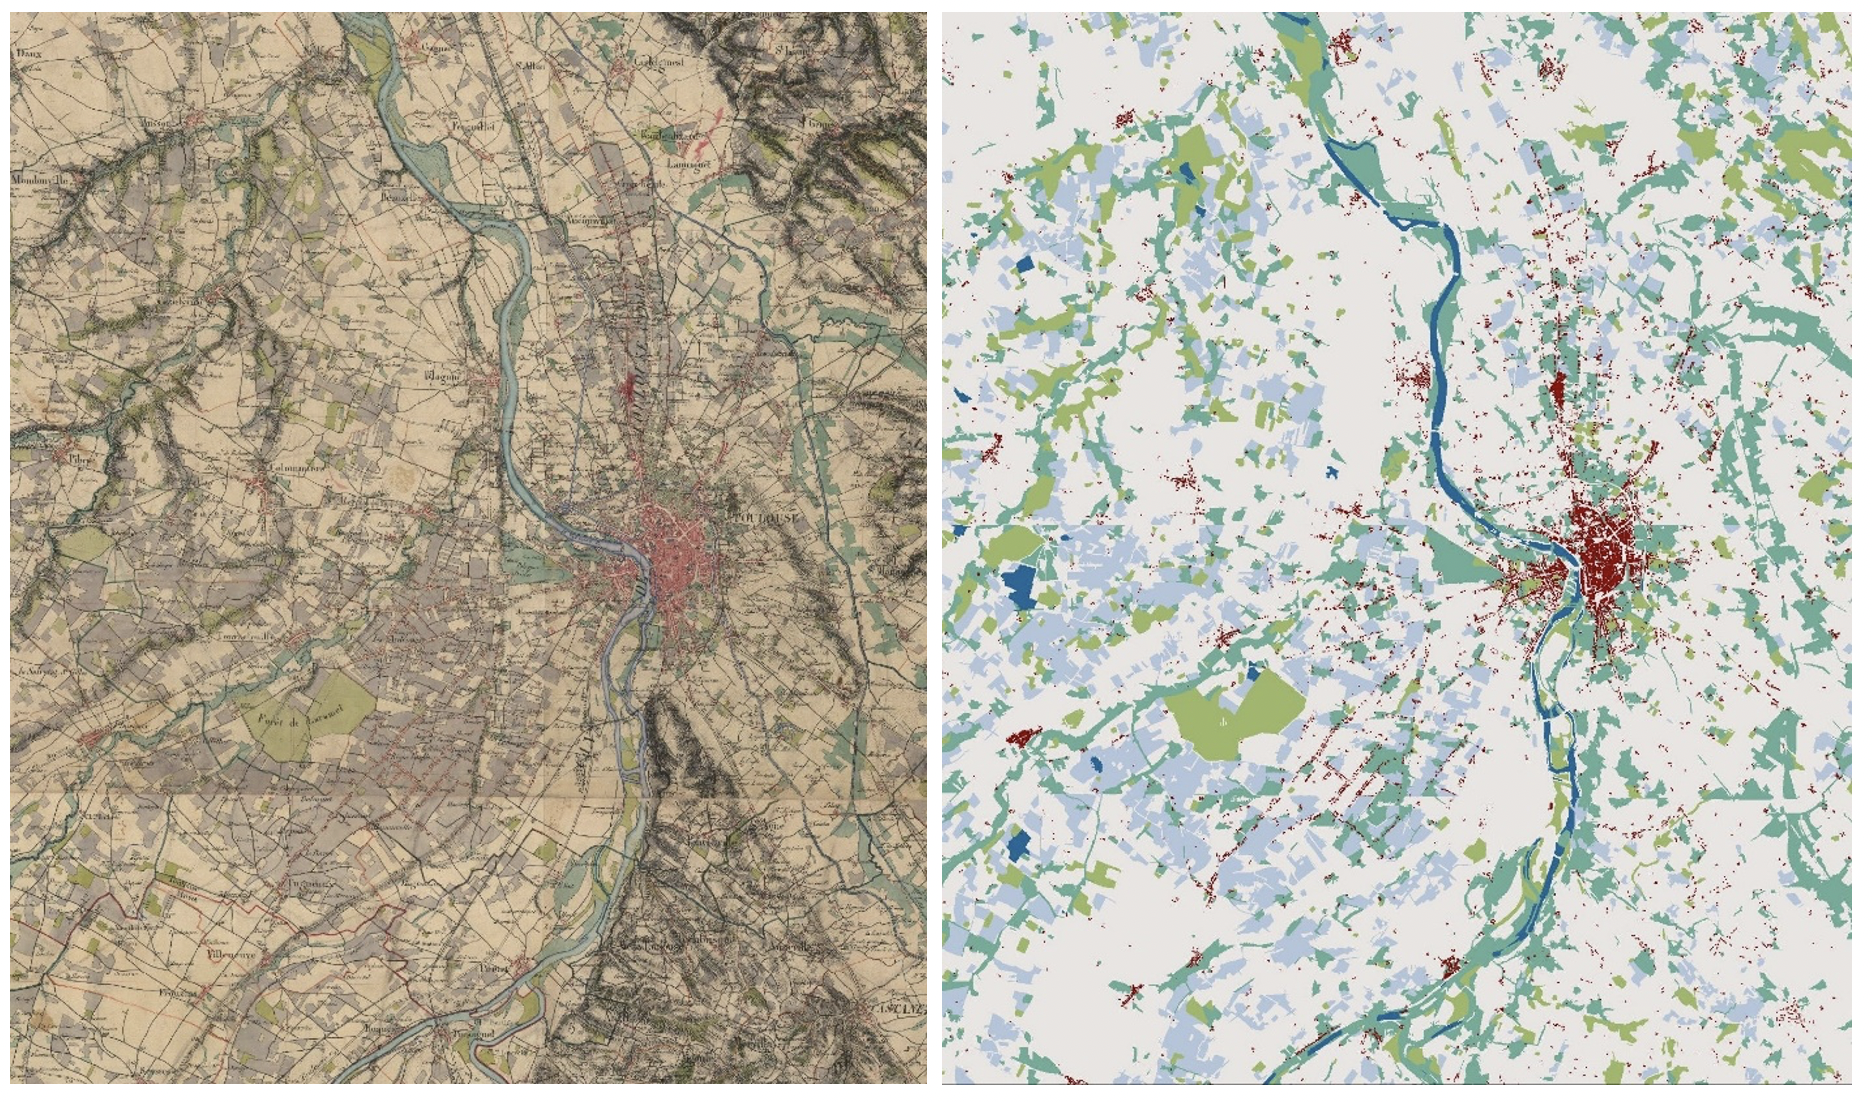
Figures 2 and 3 illustrate the output of such procedure when extracting, at the pixel level, built-up areas only (see Figure 2) and a more exhaustive land use classification using superpixels (see Figure 3). One advantage of such procedure is that it only requires a small training set. Within the set of initially labelled pixels, a validation sample can be isolated from the proper training set and the predictions can be validated on such a validation sample. Accuracy rates appear to be very high.
Figure 2 Original map (left panel) and built-up areas (right panel) for the city of Lyon
Figure 3 Original map (left panel) and land classification (right panel) on the outskirts of Toulouse
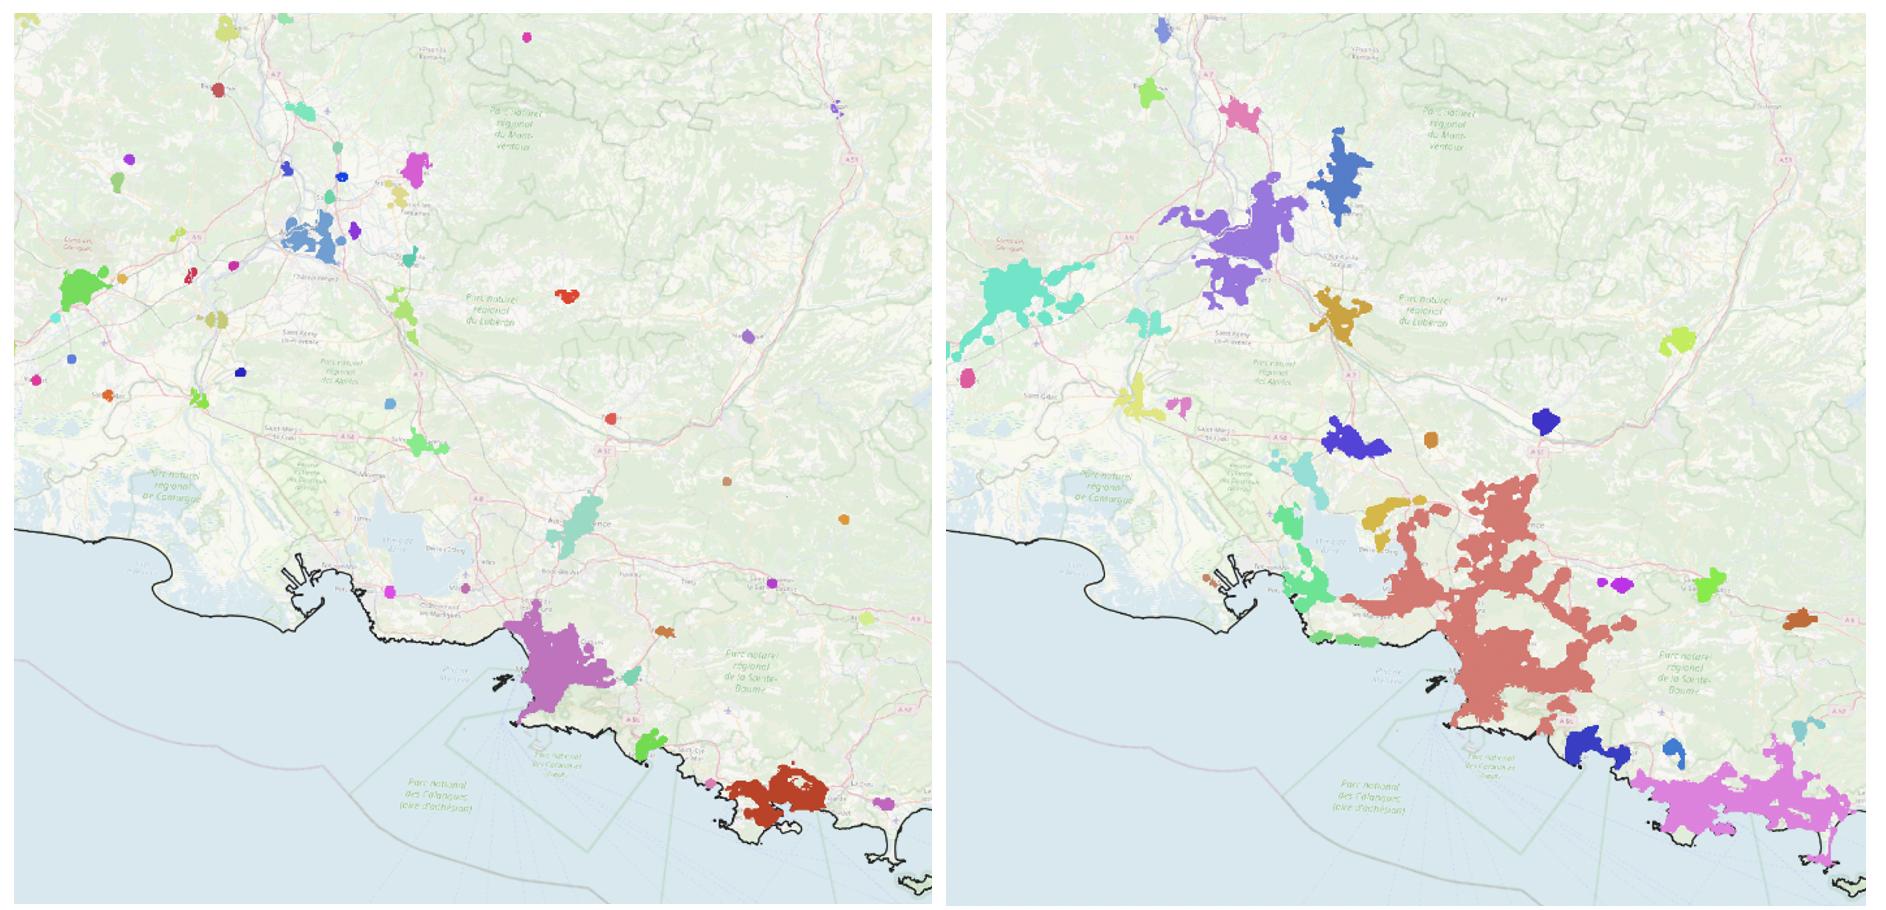
The output of this procedure can be used to better understand urban growth in the long run. Relying on a statistical tool developed by de Bellefon et al. (2020) to identify city borders, Figure 4 displays urban development between 1860 and 2015 around the large city of Marseille in the South of France. The figure makes salient two stylised facts: (1) smaller cities disappear; and (2) larger cities grow, sometimes absorbing former neighbouring cities into a large metropolitan area.
Figure 4 Urban development around Marseille between 1860 (left panel) and 2015 (right panel)
The previous example illustrates the power of machine learning approaches for the visual recognition of coloured patterns and its subsequent use to study urbanisation. Another challenge consists in recognising objects through their shapes or their surroundings, as when trying to identify buildings versus roads or agricultural parcels, or when trying to recognise text. Neural networks – often referred to as deep learning – are then powerful tools (Combes et al. 2020). These approaches are also very efficient for the transcription of manuscript documents or census records, but also for linking individual entries across such sources (see Abramitzky et al. 2019).
References
Abramitzky, R, L Platt Boustan, K Eriksson, J J Feigenbaum, and S Pérez (2019), “Automated linking of historical data”, NBER Working Paper no. 25825.
Barjamovic, G, T Chaney, K Cosar, and A Hortacsu (2019), “Trade, merchants, and the lost cities of the bronze age”, Quarterly Journal of Economics 134(3): 1455–1503.
Boustan Platt, L, P V Fishback, and S Kantor (2010), “The effect of internal migration on local labor markets: American cities during the great depression”, Journal of Labor Economics 28(4): 719–746.
Brooks, L, and B Lutz (2019), “Vestiges of transit: Urban persistence at a microscale”, Review of Economics and Statistics 101(3): 385–399.
Combes, P-P, L Gobillon, and Y Zylberberg (2020), “Urban economics in a historical perspective: Recovering data with machine learning”, CEPR Discussion Paper 15308.
Donaldson, D (2018), “Railroads of the raj: Estimating the impact of transportation infrastructure”, American Economic Review 108(4-5): 899–934.
Gorin, C, P-P Combes, G Duranton, and L Gobillon (2020), “Land use from historical maps by machine learning”, ongoing work (mimeograph in progress).
Heblich, S, S J Redding, and D M Sturm (forthcoming-a), “The making of the modern metropolis: evidence from London”, Quarterly Journal of Economics.
Heblich, S, A Trew, and Y Zylberberg (forthcoming-b), “East side story: Historical pollution and persistent neighborhood sorting”, Journal of Political Economy.
Matsuyama, K (1992), “Agricultural productivity, comparative advantage, and economic growth”, Journal of Economic Theory 58(2): 317–334.
Nunn, N, and N Qian (2011), “The potato’s contribution to population and urbanization: Evidence from a historical experiment”, Quarterly Journal of Economics 126(2): 593–650.
Steinwender, C (2018), “Real effects of information frictions: When the states and the kingdom became united”, American Economic Review 108(3): 657–96.
