A rise in market power is often interpreted to mean that firms can increase their markups over marginal cost without sacrificing profitability. However, markups are unobservable, which helps explain why studies don’t agree on whether aggregate markups have risen or not (Basu 2019). Our interpretation of market power relies on a large class of international trade models, where firms with a higher market share set higher markups (e.g. Amiti et al. 2019). Through the lens of these models, as market concentration rises, aggregate markups increase.
Data
Our analysis draws (Amiti and Heise 2021) on confidential firm-level data from the US Census Bureau from 1992 to 2012 for industries in the manufacturing sector.1 Importantly, it includes sales data for all firms selling in the US market, both domestic and foreign firms. Foreign firms’ sales are available from customs forms collected by US Customs and Border Protection and available through the Census. Usually, the sales of foreign firms to the US market are not included in analyses of market concentration as publicly available data only comprise US firms’ sales. However, in order to get an accurate picture of market concentration, it is critical to also include the sales of foreign competitors in the market. For example, a car manufacturer in the US not only competes with domestic car manufacturers but also with imported cars. We use the market share of the top 20 firms in an industry as our measure of market concentration.
Trends in market concentration in US manufacturing
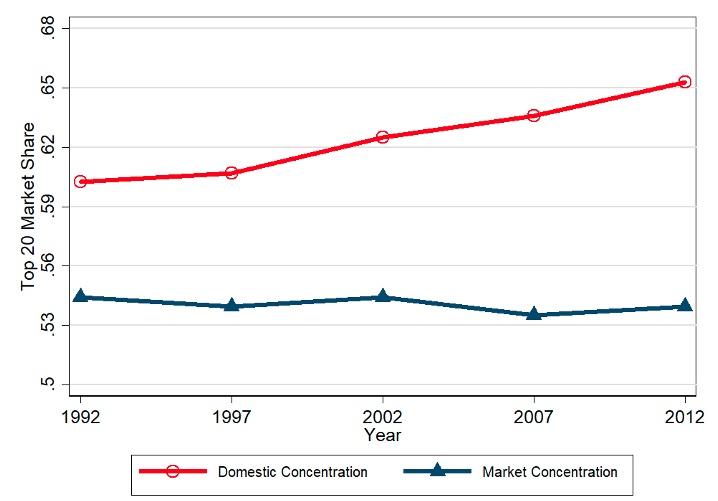
In Figure 1, we plot the market concentration, averaged across all industries within US manufacturing. The solid red line depicts domestic concentration, computed using US firms’ total shipments – that is, the market share of the top 20 US firms relative to other US firms. As in earlier studies (e.g. Autor et al 2020), we find that this measure of domestic market concentration has increased. However, once we compute market concentration using all firms selling in the US, inclusive of foreign firms, we find that market concentration has in fact remained stable (blue line). This finding suggests that aggregate markups computed using both foreign and domestic firms have remained stable.
Figure 1 Top 20 concentration over time
Sources: US Census Bureau; authors’ calculations.
Note: Concentration measures are simple averages across 169 industries at the five-digit North American Industry Classification (NAICS). The “Domestic Concentration” line measures concentration using U.S. firms’ total shipments. The “Market Concentration” line constructs market shares for all firms selling in the U.S. irrespective of where the firm is located.
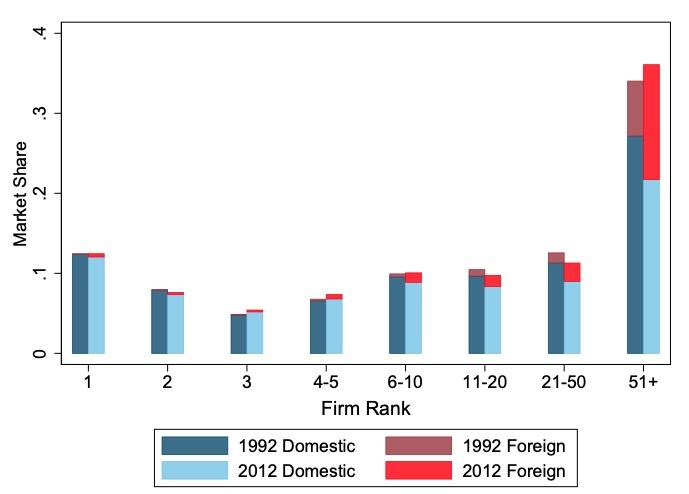
Figure 1 suggests that the fall in the market share of the top US firms is exactly offset by the rise in the share of the foreign firms. To delve into these patterns further, we plot the total share of the market that is accounted for by firms of a given ranking within an industry, summed across industries, in Figure 2 for 1992 with darker colours and for 2012 with lighter colours. We split each bar into the market share accounted for by domestic firms in blue and by foreign firms in red. The chart shows that in 1992 domestic firms with rank 1 within an industry had a market share of 12.4%, which fell to 12.0% in 2012. At the same time, foreign firms with rank 1 increased their market share from virtually zero to 0.4% of manufacturing sales. We see that the largest gain in foreign firms’ market shares has been in the lower part of the distribution. The market share of foreign firms ranked higher than fiftieth within an industry rose from 6.9% to 14.4%. There is very little gain by foreign firms in the top part of the market share distribution.
Figure 2 Average market shares by firm rank within an industry
Sources: US Census Bureau; authors’ calculations.
Note: Each set of bars plots the weighted average market share across industries of the firms with the rank noted on the x-axis, where we weight the market shares by each industry's absorption in 1992. The blue bars represent the market share of domestic firms with a given rank and the red bars are the market share of foreign firms with that rank.
Market concentration and import competition
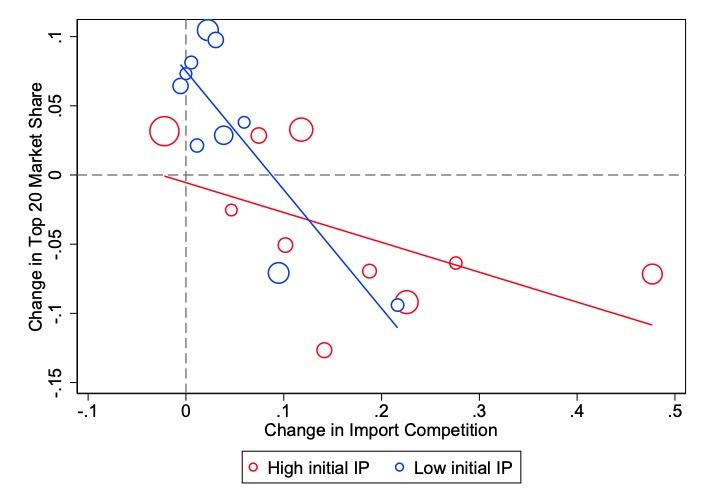
Market concentration fell mostly in those industries that experienced the fastest growth in import competition since 1992. In contrast, concentration grew in industries with low import competition. Figure 3 plots an industry’s change in import penetration between 1992 and 2012 against the change in concentration over the same period. Import penetration is defined as an industry’s imports divided by domestic sales – that is, shipments minus exports plus imports. Each circle is a group of industries, ranked by their change in import competition, where the size of each circle is proportional to domestic sales in 1992. The dashed line depicts the linear fit of these circles. We split the set of industries into those with above-median import penetration in 1992 (red) and below-median import penetration (blue). The figure shows that most industries with above-median import penetration in 1992 experienced a further increase in imports in the following years but almost no change or even a decline in concentration. In contrast, industries with low initial import penetration did not see an increase in foreign competition and experienced an increase in market concentration. Based on publicly available Census data, industries with high growth in import competition include for example audio and video manufacturing, while industries with low import competition include for example concrete industries.
Figure 3 Change in market concentration and import penetration
Sources: US Census Bureau; authors’ calculations.
Notes: Each circle is a group of industries, ranked by their change in import competition, where the size of each circle is proportional to domestic sales in 1992. The “High initial IP” dots are for industries with an above-median level of import penetration in 1992. The “Low initial IP” dots are for industries with a below-median level of import penetration in 1992.
How do we reconcile the different trends in domestic concentration and overall market concentration? According to trade theory, tougher import competition leads to the exit of smaller, inefficient US firms and reduces US firms’ domestic sales. At the same time, large US firms gain because trade liberalisation allows them to export more. Consistent with these predictions, our analysis shows that import competition caused the exit of domestic firms, and thus the large US firms gained market share relative to total sales of US firms. However, once we consider the total sales in the US market, inclusive of imports, we find that import competition caused the market share of the largest US firms to fall, as foreign firms gained some of the domestic firms’ market share. Our results, based on regression analysis, suggest that import competition reduced the market share of the top 20 US firms by an average of about 0.8 percentage point since 1997, accounting for about half of the actual decline in their market shares.
Conclusion
In sum, our analysis suggests that the increasing concentration among US firms themselves is entirely consistent with lower markups of these firms because of tougher import competition. Once the growing market shares of foreign firms are taken into account, US market concentration did not rise but remained flat between 1992 and 2012. These results imply that the market power of US firms fell while the market power of foreign firms rose, resulting in overall stable aggregate markups.
Authors’ note: The views expressed in this column are those of the authors and do not necessarily reflect the position of the Federal Reserve Bank of New York, the Federal Reserve System or the views of the U.S. Census Bureau. The Census Bureau's Disclosure Review Board and Disclosure Avoidance Officers have reviewed this information product for unauthorized disclosure of confidential information and have approved the disclosure avoidance practices applied to this release. This research was performed at a Federal Statistical Research Data Center under FSRDC Project Number 1883 (CBDRB-FY21-P1883-R8915). Any errors or omissions are the responsibility of the authors.
References
Amiti, M and S Heise (2021), “U.S Market Concentration and Import Competition,” CEPR Discussion Paper 16126.
Amiti, M, O Itskhoki and J Konings (2019). “International Shocks, Variable Markups, and Domestic Prices,” Review of Economic Studies 86(6): 2356-402.
Autor, D, D Dorn, L F. Katz, C Patterson, and J Van Reenen (2020). “The Fall of the Labor Share and the Rise of Superstar Firms,” Quarterly Journal of Economics 135(2): 645-709.
Basu, S (2019). “Are Price-Cost Markups Rising in the United States? A Discussion of the Evidence,” Journal of Economic Perspectives 33(2).
Bonfiglioli, R C and G Gancia (2019), “International competition and national concentration”, VoxEU.org, 8 May.
Cavalleri, M C, A Ellet, P McAdam, F Petroulakis and A Soares (2019), “Concentration, market power, and dynamism in the euro area,” VoxEU.org, 24 August.
Endnotes
1 Recent Vox columns have looked at market concentration trends in the EU (Cavalleri et al. 2019) and international trends (Bonfiglioli et al. 2019).

