How high might inflation rise in the US in the coming years? Blanchard (2021) and Summers (2021) caution that the recent $1.9 trillion American Rescue Plan Act (ARPA), together with the fiscal expansion passed in 2020, may push unemployment low enough to cause overheating and surging inflation. Others, such as Gopinath (2021), see a persistent surge in price pressures as unlikely, and Powell (2021) argues that the rise in inflation will be “neither particularly large nor persistent”.
The purpose of this column is two-fold. First, to re-assess how strongly US inflation responds to the unemployment rate, including since the start of the COVID-19 crisis, with a focus on underlying (core) inflation. Second, to predict how high inflation might rise depending on how low unemployment falls with the government spending expansion.
US inflation: Puzzle during the COVID-19 crisis?
To understand recent inflation behaviour, we separate it into two components: (1) underlying inflation that reflects macroeconomic conditions (the Phillips curve); and (2) a transitory component arising from changes in relative prices due to microeconomic factors. We measure underlying inflation using weighted median CPI inflation data from the Federal Reserve Bank of Cleveland, which indicate the price change at the 50th percentile (in terms of consumption basket weights) of the distribution of price changes in a given month. This approach filters out extreme price movements from various components such as, for example, the record 84% fall in cell phone service prices in March 2017 (annualised) which prompted commentary by then Fed Chair Yellen.1
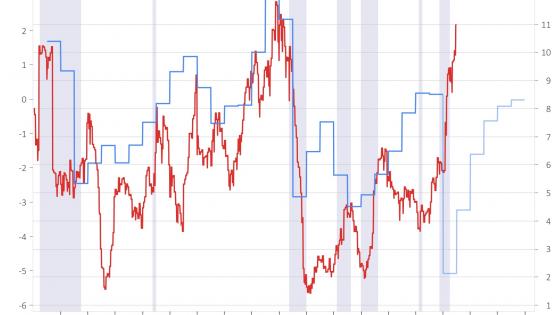
Underlying (median CPI) inflation has moved closely with macroeconomic conditions in recent years (Figure 1). During 2017-19 when unemployment declined well below Congressional Budget Office (CBO) estimates of its natural rate, median CPI inflation rose above 2.5% (quarter-over-quarter). In 2020, when unemployment sharply increased, median CPI inflation steadily declined, reaching a low of 1.6% in 2021Q1.
Figure 1 US inflation fell in 2020 as unemployment rose
Note: Quarterly data. Long-term forecast = SPF 10-year-ahead forecast. Natural rate from CBO.
By contrast, an often-used simpler measure of core inflation based on the CPI excluding food and energy prices has not reliably reflected macroeconomic conditions. During the 2017-19 expansion, it was on average below the long-term expected level for CPI inflation based on the Survey of Professional Forecasters (SPF). During the COVID-19 crisis, it fluctuated widely from -1.1% in 2020Q2 – the largest fall in the series’ history – with record drops in airline fares, lodging, apparel, and motor vehicle insurance prices, to a rise of 3.9% in 2020Q3, when several of these one-off price drops rebounded, providing a noisy signal of underlying inflation. The CPI excluding food and energy will probably rise sharply in 2021Q2 on a year-over-year basis, but this will reflect base effects from the record 2020Q2 drop rather than a rise in underlying inflation.
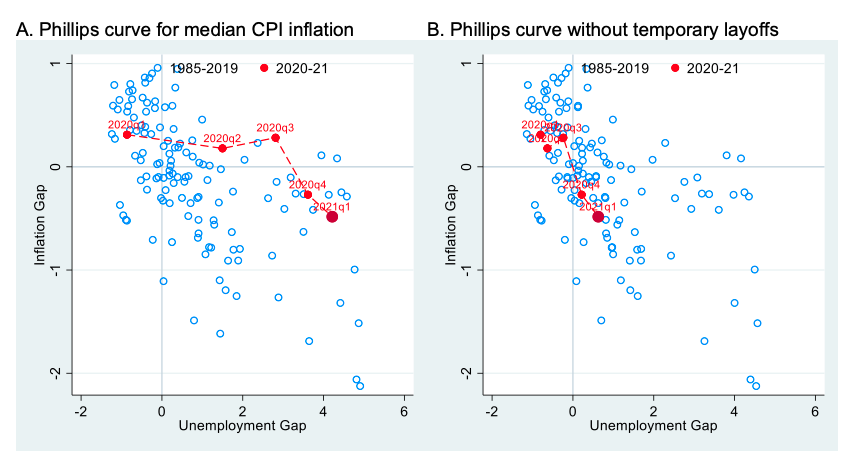
We examine if, during the COVID-19 crisis, median CPI inflation has moved in line with its pre-pandemic relation with unemployment – the Phillips curve – and at first there is a puzzle. As Figure 2 (left panel) illustrates, inflation was higher above its long-term forecasted level than could have been expected given the rise in unemployment. However, the labour market was very unusual in 2020, with a large share of job losers on temporary layoff due to lockdown measures, and, with prospects of regaining employment, having arguably little effect on wage bargaining and price dynamics. When we exclude job losers on temporary layoffs from the unemployment rate (right panel), the puzzle fades and inflation is broadly in line with its pre-pandemic Phillips curve relation.
Figure 2 US inflation: No puzzle in COVID-19 crisis
Note: Inflation gap = inflation – long-term SPF forecast. Unemployment gap = unemployment – CBO natural rate, 4-quarter average.
Our Phillips curve estimates based on quarterly data for 1985-2019 imply that a 1 percentage point fall in the unemployment rate should raise median CPI inflation by 0.24 percentage points (the 95% confidence interval is 0.17–0.31 percentage points). We find little evidence of non-linearity with inflation rising faster at lower rates of unemployment so far, despite the sample including times of low unemployment.2 Our Phillips curve slope estimate is similar to that of Blanchard et al. (2015) (about 0.2) and of Hazell and others (2020) (0.25 for median CPI inflation).
How high might inflation rise?
Based on our Phillips curve estimates, we investigate how high inflation might rise under two unemployment scenarios.
First, we consider the April 2021 IMF World Economic Outlook baseline, which reflects the IMF staff’s assessment of the ARPA and earlier fiscal packages, with the unemployment rate falling to 3.6% by 2023, about 0.8pp below the CBO natural rate (Figure 3). Based on our estimated Phillips curve, median CPI inflation would then rise to 2.4% (quarter-over-quarter) by 2023.
Second, we consider Blanchard’s (2021) scenario where the unemployment rate falls to 1.5%, reflecting larger assumed fiscal multipliers calibrated on the basis of conditions that prevailed after the global financial crisis – although such large multipliers might not apply now with the rapid recovery. A substantial fall in unemployment could also occur with smaller multipliers but with additional fiscal stimulus beyond the ARPA. In this case, our estimates imply that median CPI inflation would rise to 2.9% by 2023. To investigate this scenario further, we consider a steeper Phillips curve slope – the upper bound of our aforementioned confidence band, a slope of 0.31. In this case, median CPI inflation reaches 3.1%.
Figure 3 US inflation could rise to 2.5% or more by 2023
Note: WEO = IMF World Economic Outlook. ARPA = American Rescue Plan Act. PC = Phillips curve.
Overall, our estimates imply median CPI inflation rising to about 2.5–3.0% by 2023. PCE inflation, on which the Federal Reserve focuses, and which has averaged about 0.2 percentage points below CPI inflation over the past decade due to methodological differences, would reach 2.3–2.8% on a median basis. Inflation of the PCE excluding food and energy, which has averaged below median PCE inflation by about 0.5 percentage points reflecting disinflationary relative price changes, could, if these persist, be in the 1.8–2.3% range. Such outcomes would be broadly consistent with the Fed’s average inflation targeting strategy with inflation modestly overshooting its long-term level following a number of years of undershooting it.
Upside risks
Inflation could rise higher than we envisage if expectations de-anchor and rise with actual inflation, resulting in a self-fulfilling inflationary spiral. How likely is such a scenario – which has not materialised for several decades – to occur with the temporary pandemic relief package currently being implemented?
Blanchard (2021) concurs that current Phillips curve estimates do not yield predictions of high inflation but emphasises that the aforementioned sharp fall in unemployment could de-anchor expectations and steepen the Phillips curve, resulting in a self-perpetuating rise in inflation and costly policy trade-offs. He cites the example of the 1960s, when unemployment persisted below its natural rate and inflation rose from below 2% in 1961 to nearly 6% by 1969.
At the same time, the rise in government spending in the 1960s was not, as Gagnon (2021) underscores, a one-time relief bill along the lines of ARPA but rather reflected longer-term commitments to finance the Vietnam War and Great Society programmes. A more appropriate reference for today is the temporary government spending and inflation during the Korean War in the early 1950s.
Moreover, the Fed’s communication and policy framework are now more credible and consistent with explicit policy goals than they were in the 1960s and 1970s, which further limits de-anchoring risks. Inflation has undershot its long-term expected level for much of the past decade – sometimes by more than the inflation overshoot we now predict – with little evidence of de-anchoring. Also, the structure of the economy is now more open to foreign competition and labour markets are more flexible, which would further dampen price pressures.
Finally, a period of low unemployment could have positive supply-side effects, further mitigating inflationary pressure and reducing scarring from the COVID-19 crisis. Positive supply-side effects could arise, as Ball (2015), Blanchard (2018), Powell (2018) and Yellen (2016) discuss, as more (discouraged) workers re-enter the labour force and efficiency-enhancing job switches increase as labour markets tighten, enhancing human capital through on-the-job training, and prompting investment as well as research and development.
Overall, we see little risk that the current temporary government spending for pandemic relief causes an inflationary spiral. We expect instead a rise in inflation that is modest and temporary. We have focused in this column on the impact of the ARPA. The recently unveiled American Jobs Plan proposal, still under discussion, would further reduce unemployment, but the spending is likely to be spread over a longer period, be partially offset by tax measures, and raise potential output through increased infrastructure investment. These factors could limit overheating concerns. Nonetheless, as the plan is being firmed up it is important to keep in mind the lessons from the past. More persistent and unfunded long-term commitments with limited supply-side benefits could pose greater inflationary risks. Should such upside risks to inflation arise, they would complicate the exit from the Fed’s very accommodative monetary policy stance.
Authors’ note: The views expressed in this column are the sole responsibility of the authors and should not be attributed to the International Monetary Fund, its Executive Board, or its management. Swapnil Agarwal and Mattia Coppo provided excellent research assistance.
References
Ball, L (2015), “Monetary Policy for a High-Pressure Economy”, Center on Budget and Policy Priorities. Policy Futures. March 30, 2015.
Ball, L and S Mazumder (2019), “The Nonpuzzling Behavior of Median Inflation”, NBER Working Paper No. 25512.
Blanchard, O, E Cerutti, and L Summers (2015), “Inflation and Activity: Two Explorations and their Monetary Policy Implications”, IMF Working Paper No. 15/230.
Blanchard, O (2018), “Should We Reject the Natural Rate Hypothesis?”, Journal of Economic Perspectives 32(1): 97–120.
Blanchard, O (2021), “In defense of concerns over the $1.9 trillion relief plan”, Peterson Institute for International Economics Realtime Economic Issues Watch, 18 February.
Gagnon, J (2021), “Inflation fears and the Biden stimulus: Look to the Korean War, not Vietnam”, Peterson Institute for International Economics Realtime Economic Issues Watch, 25 February.
Gopinath, G (2021), “Structural Factors and Central Bank Credibility Limit Inflation Risks”, IMFBlog. 29 February.
Hazell, J, J Herreño, E Nakamura, and J Steinson (2020), “The Slope of the Phillips Curve: Evidence from U.S. States”, NBER Working Paper No. 28005.
Powell, J (2018) “Monetary Policy at a Time of Uncertainty and Tight Labor Markets”, Remarks at “Price and Wage-Setting in Advanced Economies”, ECB Forum on Central Banking, Sintra, 20 June.
Powell, J (2021), Virtual Hearing - Oversight of the Treasury Department’s and Federal Reserve’s Pandemic Response, 23 March.
Summers, L H (2021), “The Biden stimulus is admirably ambitious. But it brings some big risks, too”, Opinion, The Washington Post, 4 February.
Yellen, J (2016), “Macroeconomic Research After the Crisis”, speech at 60th annual economic conference “The Elusive ‘Great’ Recovery: Causes and Implications for Future Business Cycle Dynamics”, sponsored by the Federal Reserve Bank of Boston.
Endnotes
1 We derive quarterly inflation rates from the Cleveland Fed’s monthly median CPI inflation data using the methodology of Ball and Mazumder (2019) who convert monthly inflation to monthly price levels, average over three months to get quarterly price levels, compute the percentage change from the previous to the current quarter, and multiply by four.
2 Our baseline Phillips curve equation is: πt - Etπt+h = α + βxt + εt, where πt = weighted median CPI (Q/Q SAAR) inflation; Etπt+h = 10-year-ahead SPF inflation expectations; and xt = 4-quarter average gap between unemployment and its CBO natural rate. The sample is 1985Q1 – 2019Q4. The estimate of the slope, β is -0.240 (s.e. = 0.036); the estimate of α is 0.075 (s.e. = 0.045); the R-squared is 37%. When adding a xt squared term to the equation, we fail to reject the null of linearity (p-value = 26%).


