Real effective exchange rates (REERs) are widely used to gauge competitiveness. Yet conventional REERs, based on gross trade flows and consumer price indexes (CPIs), are not well suited to that role when imports are used to produce exports – i.e., with vertical specialisation in trade.
The problem is that the conventional REER is based on an outdated assumption regarding how countries compete with one another. Namely, the conventional REER assumes that countries compete against each other to sell ‘products’ that they produce entirely at home, using only domestic inputs1. This is clearly at odds with the pervasive use of imports to produce exports in today’s global economy2.
The iPhone’s supply chain
To illustrate the problem, consider the iPhone3. The conventional approach classifies the iPhone as China's ‘product’, and supposes that China competes against other suppliers of smart phones in foreign markets. Given this definition, a rise in the price of an iPhone would imply a loss of competitiveness for China. In reality, China is the final assembly point for the iPhone, one link in a production chain spread over many countries. Therefore, China competes directly against other possible assemblers of iPhones, not suppliers of smart phones per se. What REER should be measuring is how demand for assembly services (i.e. Chinese value added) responds to changes in the price of those services (i.e. cost of labor and capital in China). Put differently, we should re-define China's ‘product’ to be the fragment of iPhone value added actually produced in China.
This example points to a general idea: with the spread of global supply chains, countries increasingly compete over supplying value added to foreign markets, not to final goods or even gross exports. Therefore, we need to measure the effects of price changes on demand for value added, since demand for value added translates into demand for workers and capital (i.e. jobs and investment)4.
A more appropriate index is possible
In our recent paper (Bems and Johnson 2012) we extend the conventional REER framework to include vertical specialisation in trade and apply the framework to construct a ‘Value-Added REER’ for 42 countries over the 1970-2009 period5. We show that the basic intuition behind the REER index remains valid: it summarises relative price developments weighted by (direct and indirect) trade exposure.
Using different data
The key new insight concerns the types of data required to build the index. To measure relative prices and trade links, the Value-Added REER uses different data to the conventional REER:
- GDP deflators to measure changes in relative prices.
They are the most direct summary measure for factor (capital and labor) costs. GDP deflators are available at quarterly frequency for a large set of countries:
- Bilateral trade in value added to construct country trade weights.
What matters for a country’s competitiveness is demand for its value added, rather than for its gross output. We use estimates of bilateral trade flows in value-added terms for 1970-2009 from Johnson and Noguera (2012a)6.
We compare the new REER with the conventional REER. The latter typically uses CPI data to capture relative price developments and gross trade flows to construct country trade weights7.
Benefits of the Value-Added REER index
The new Value-Added REER index can differ substantially from the conventional REER.
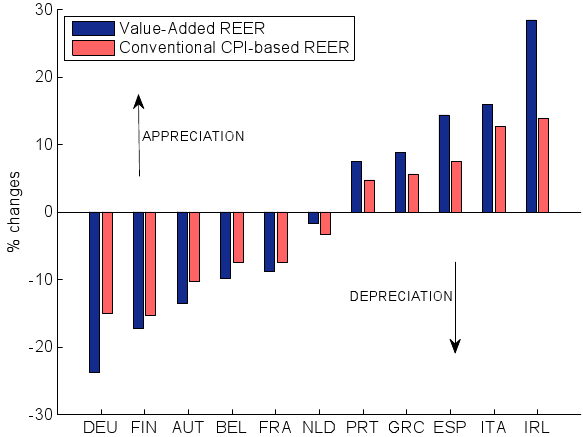
For example, looking at countries in the Eurozone, we see significant differences between Value-Added and conventional REERs in the post-1995 period (see Figure 1). The Value-Added REER for Germany depreciates more strongly over the 1995-2007 period than does the conventional REER, and appreciates more strongly than the conventional REER in Portugal, Italy, Ireland, Greece, and Spain. Among these countries, the Value-Added REER moves more strongly in directions that are consistent with the widening of current account imbalances prior to the onset of the crisis.
Figure 1. Eurozone, movements of Value-Added and conventional REERs, 1995 to 2007
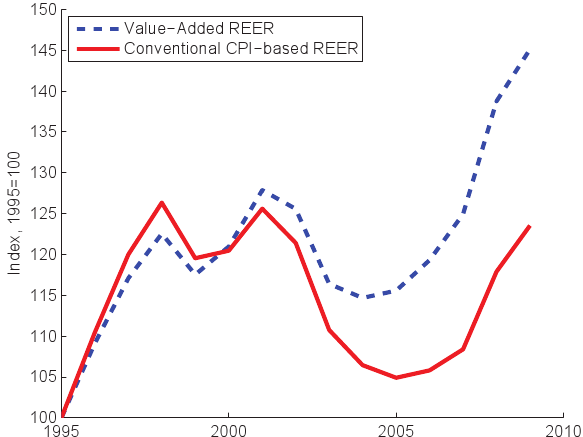
Another interesting case is China (see Figure 2), where there are sizeable fluctuations in the conventional REER during the 2000s, but no obvious trend. In contrast, the Value-Added REER registers a 20 percentage point appreciation from 2000 to 2009.
Figure 2. China, comparison of Value-Added and conventional REERs
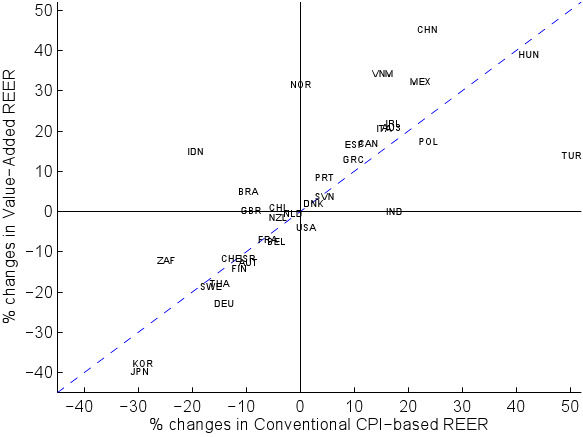
These examples are representative of our broader findings. While changes in the Value-Added REER are positively correlated with changes in the conventional REER, there are often substantial and persistent differences between the two. Figure 3 illustrates this for our full set of 42 countries from 1995 to 2009, where we plot changes in the conventional REER on the horizontal axis and changes in the Value-Added REER on the vertical axis. Points off the 45-degree line indicate deviations between the Value-Added and conventional REER. We see especially large differences for Brazil, China, India, Indonesia, Japan, Korea, Norway, South Africa, Turkey and Vietnam.
Figure 3. Comparing movements in alternative REERs for 1995-2009
Conclusions
We have updated the conceptual underpinnings of the REER index and constructed a new dataset of Value-Added REERs for a large set of countries.
The new index:
- Takes global value chains into account in assessing competitiveness.
It is therefore likely to give a more accurate picture than conventional REER measures.
- It is feasible to build such an index, using currently available data.
It can be constructed at quarterly frequency and can be as up to date as real GDP data.
We suggest that analysts and policymakers concerned with competitiveness developments include the Value-Added REER in their toolbox, and consider de-emphasising the use of the increasingly outdated conventional REER measures.
Authors' note: The views expressed in this column are those of the authors and not necessarily those of the institutions to which they are affiliated.
References
Bayoumi, Tamim, Sarma Jayanthi and Jaewoo Lee (2006), “New Rates from New Weights”, IMF Staff Papers, 53(2), 272-305.
Bems, Rudolfs and Robert C Johnson (2012), “Value-Added Exchange Rates”, NBER Working Paper, 18498.
Escaith, Hubert and Marcel Timmer (2012), “The new World Input-Output Database”, VoxEU.org, 13 May.
Evenett, Simon J. and Joseph Francois (2010), “Will Chinese Revaluation Create American Jobs?”, VoxEU.org, 23 April.
Johnson, Robert C and Guillermo Noguera (2012a), “Fragmentation and Trade in Value Added over Four Decades”, NBER Working Paper, 18186.
Johnson, Robert C and Guillermo Noguera (2012b), “How Much Value Added is Traded?”, VoxEU.org, 22 July.
McGuirk, Anne (1987), “Measuring Price Competitiveness for Industrial Country Trade in Manufactures,”, IMF Working Paper, 87/34.
Xing, Yuqing (2012), “How the iPhone Widens the US trade deficit with China”, VoxEU.org, 10 April.
1 See McGuirk (1987) and Bayoumi, Jayanthi and Lee (2006).
2 Vertical specialisation in trade is estimated to account for around ¼ of gross trade flows globally.
3 Cf. Xing (2012).
4 Cf. Evenett and Francois (2010) for discussion of competitiveness and jobs when trade in parts and components is important.
5 Value-Added REER index data are available on our homepages.
6 Cf. Johnson and Noguera (2012b) for a brief description of that value-added trade data. For an alternative dataset that can be used to compute value-added trade for 1995-2009, see Escaith and Timmer (2012).
7 We construct both the Value-Added and conventional CPI-based REERs using time-varying country trade weights.


