From the early 1990s to the late 2000s, production processes have become increasingly fragmented and international due to reductions in trade costs spurred by technological developments and trade liberalisation (Baldwin 2011). This reorganisation of many production processes at a global scale is widely referred to as the emergence of global value chains (GVCs). Despite a slowdown in GVC expansion in recent years, their current extent calls for a detailed mapping to shed light on their influence on competitiveness and value creation.
Input-output based mapping of global value chains
From a macroeconomic perspective, global multi-country input-output tables (IOTs) have been used extensively to show that GVCs and value added in trade have expanded rapidly between the mid-1990’s and the late 2000’s (OECD 2018). The integration of countries and industries into GVCs and their contributions to domestic value creation are captured through IOT based indicators such as the domestic value added and import content of exports (Hummels et al. 2001, Koopman et al. 2014). Moreover, the distance to final demand (‘upstreamness’) and the number of embodied production stages (Antras et al. 2014) serve as measures of an industry’s or country’s position within GVCs.
Within-industry firm heterogeneity in input-output tables
As emphasised by various authors (e.g. Ahmad et al. 2013, Los 2017), the granularity of the underlying data poses a further challenge for such input-output based GVC mapping. In standard input-output tables, firms are grouped into industries according to the type of goods and services they produce. Within these industries defined in terms of product similarity, technological homogeneity has been taken for granted. However, as value chains have become increasingly fragmented and global, within-industry patterns of specialisation have developed, which do not depend on the types of products delivered by firms, but are related to other firm characteristics such as size, ownership, or exporter status.1 This has been largely documented in empirical research on firm heterogeneity and trade, based on firm data (e.g. Bernard et al. 2009). Initiatives have been taken in several countries to incorporate such within-industry firm heterogeneity into IOTs for an enhanced value chain analysis – for example, Ito et al. (2017) isolate exporters in Japanese manufacturing industries, and Fetzer et al. (2018) split industries according to ownership in tables for the US.
In recent work that looks at Belgium, we develop and apply a method for a micro-data based breakdown of 57 detailed manufacturing industries in the 2010 Belgian IOTs into export-oriented and domestic market firms (Michel et al. 2018). The former are defined as those firms for which exports represent at least 25% of turnover. The disaggregation of industries is based on the firm-level data used in the construction of the official IOTs. Therefore, the estimation of the output, input, and import structures of export-oriented and domestic market firms are data-based rather than just proportional, as in most prior contributions.
Technological differences between export-oriented and domestic market manufacturers
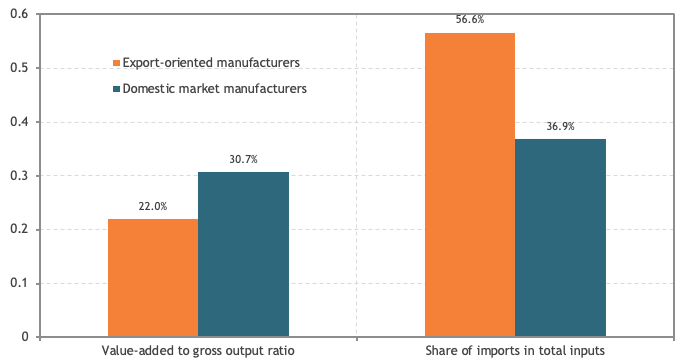
The comparison of direct cost structures in the IOTs reveals technological differences between export-oriented and domestic market manufacturers. The left-hand bar chart of Figure 1 illustrates that export-oriented manufacturers have a lower value added to gross output ratio than manufacturing firms that mainly serve the domestic market – that is, they purchase proportionally more intermediate inputs. Moreover, they also import proportionally more of the intermediate inputs they use (right-hand bar chart in Figure 1) – that is, export-oriented manufacturing firms engage in more offshoring, which reflects the greater cross-border fragmentation of their production processes. These results confirm prior firm-level data based findings on technological differences between exporters and non-exporters.
Figure 1 Direct production cost structures in manufacturing, 2010 (percentages)
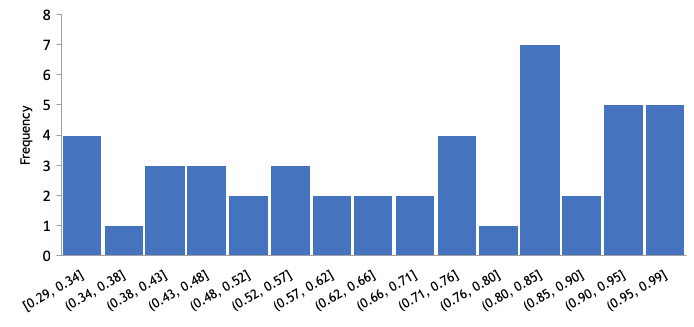
The export-heterogeneous IOTs for Belgium also allow us to test for similarity of input structures at a more detailed level, by calculating for each manufacturing industry the correlation between the technical coefficients of export-oriented firms and the technical coefficients of domestic market firms.2 The histogram in Figure 2 shows the distribution of these correlation coefficients. The average correlation between the intermediate input structures of export-oriented and domestic market firms in the same industry is 0.71.
Figure 2 Distribution of the industry-level correlations between technical coefficients of export-oriented and domestic market manufacturers
Export-heterogeneity and domestic value added in trade
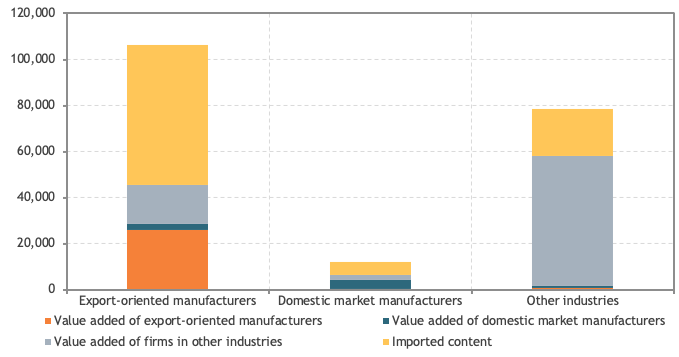
Further insights can be gained from export-heterogeneous IOTs in terms of domestic value creation from exports. Taking into account linkages between industries through purchases of intermediates, gross exports can be split into different sources of content – imports and domestic value added of export-oriented manufacturers, of domestic market manufacturers and of firms in other industries. Figure 3 shows these sources of content in the gross exports of these three categories of firms.3 Imported content makes up most of the gross exports of export-oriented manufacturers. Moreover, their exports also generate domestic value added, not only in the group of export-oriented manufacturers itself but also in other firms, in particular in other (service) industries. The picture is rather different for the exports of firms in other industries – they mainly generate domestic value added within their group.
Figure 3 Source of content in gross exports by industry and firm type, 2010 (millions of euros)
Overall, export-oriented manufacturers account for more than half of Belgium’s total gross exports (54%) but only for a quarter of the domestic value added generated by gross exports (24%). Most of the domestic value added in exports is generated in other industries – that is, service industries (69%), although the share of these industries in gross exports is only 40%.
Contribution of export-oriented and domestic market firms to global value chain participation
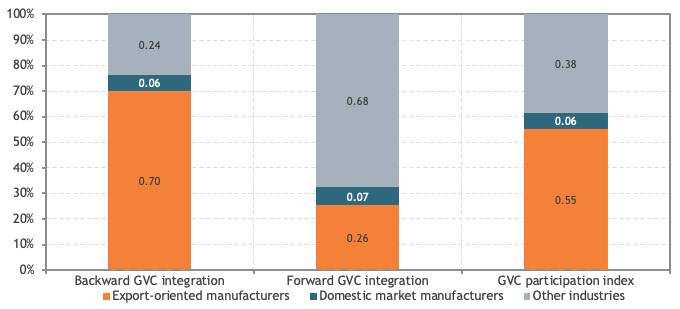
The integration of the 2010 export-heterogeneous IOTs for Belgium into the global multi-country IOTs from the World Input-Output Database (WIOD) project4 allows us to determine the contributions to Belgium’s GVC participation. Figure 4 illustrates these contributions by different categories of firms for the overall GVC participation index (Koopman et al. 2014), which is the sum of backward GVC integration (the use of imports in the production of exports) and forward GVC integration (exports of intermediates used in the production of other countries’ exports). There is a clear distribution of roles – export-oriented manufacturers drive Belgium’s GVC participation essentially through their purchases of imported intermediate inputs for producing exports (backward integration), while firms in other (service) industries contribute mainly through exports of intermediates for export production abroad (forward integration).
Figure 4 Contributions to Belgium’s global value chain participation, 2010 (shares in total)
Moreover, further analysis in terms of indicators of GVC position reveals that export-oriented manufacturers participate in value chains that comprise, on average, a greater number of upstream and downstream production stages and of which a greater share is located abroad.
Policy relevance and implications
These results indicate that taking into account export heterogeneity in input-output tables and GVC indicators provides valuable insights on technological differences between export-oriented and domestic market manufacturers and their respective contributions to a country’s GVC participation. Export-oriented manufacturers generate a substantial amount of value added of other firms, in particular providers of services. Hence, policies aimed at fostering competitiveness should take the entire value chain for the production of exports into account. From a statistical point of view, it must be emphasised that the disaggregation of industries should be based on microdata with detailed information on inputs by product category to yield meaningful results. The high policy relevance of these results and of those in related contributions (Ito et al. 2017, Fetzer et al. 2018) calls for further work on firm heterogeneity in input-output tables for additional countries, for other dimensions of heterogeneity and for more recent years.
References
Ahmad N, S Araújo, A Lo Turco and D Maggioni (2013), “Using trade microdata to improve trade in value-added measures: Proof of concept using Turkish data,” in A Mattoo, Z Wang and S–J Wei (eds), Trade in Value Added: Developing New Measures of Cross-Border Trade, World Bank: 187–220.
Antras, P, D Chor, T Fally and R Hillberry (2012), “Measuring the upstreamness of production and trade flows,” American Economic Review 102(3): 412–416.
Baldwin, R (2011), “Trade and industrialisation after globalisation’s 2nd unbundling: How building and joining a supply chain are different and why it matters,” CEPR Discussion paper 8768.
Bernard, A, J Jensen and P Schott (2009), “Importers, exporters and multinationals: A portrait of firms in the US that trade goods,” Chapter 14 in T Dunne, J Jensen and M Roberts (eds), Producer Dynamics: New Evidence from Micro Data, NBER, University of Chicago Press: 513–552.
Fetzer, J J, T Highfill, K Hossiso, T F Howells III, E H Strassner and J A Young (2018), “Accounting for firm heterogeneity within US industries: Extended supply-use tables and trade in value added using enterprise and establishment level data,” Paper presented at the CRIW Conference on the Challenges of Globalization in the Measurement of National Accounts, Washington DC, 9-10 March.
Hummels, D, J Ishii and K–M Yi (2001), “The nature and growth of vertical specialization in world trade,” Journal of International Economics 54: 75–96.
Ito, K, I Deseatnicov and K Fukao (2017), “Japanese plants’ heterogeneity in sales, factor inputs, and participation in global value chains,” RIETI, Discussion Paper 17-E-117.
Koopman, R, Z Wang and S–J Wei (2014), “Tracing value added and double counting in gross exports,” American Economic Review 104(2): 459–94.
Los, B (2017), “Input-output analysis of international trade,” Chapter 8 in T Ten Raa (ed), Handbook of Input-Output Analysis, Edward Elgar.
Michel, B, C Hambÿe and B Hertveldt (2018), “The role of exporters and domestic producers in GVCs: Evidence for Belgium based on extended national supply-and-use tables integrated into a global multiregional input-output table,” NBER, Working paper 25155; forthcoming in N Ahmad, B Moulton, J Richardson and P van de Ven, The Challenges of Globalization in the Measurement of National Accounts, NBER.
OECD (2018), “The changing nature of international production: Insights from Trade in Value Added and related indicators,” TiVA Indicators, 2018 Update, Paris.


