Despite the intuitive appeal of the idea that good economic outcomes such as sustained rapid growth should help incumbents win elections, evidence on it has been scant, especially from developing countries. In one notable exception, Brender and Drazen (2008) use a comprehensive cross-country dataset spanning over 74 developed and developing democratic countries and 350 election episodes to examine whether GDP growth during the term in office or in the election year helps incumbents win elections. They find that on average, growth helps incumbents win elections in developing countries, but not in developed ones.
We contribute to this literature by studying the link between growth and electoral success in India using data on the 2009 parliamentary elections. We consider the effects on election outcomes of candidate characteristics, party affiliation, and the economic performance of the incumbent government. We find growth in a state to be by far the most important determinant of the fortunes of the candidates nominated by the party ruling in that state. The higher the growth rate in the state, the larger is the proportion of the ruling party’s candidates winning their seats. While candidate characteristics and their party affiliations matter as well, these turn out to be quantitatively less significant.
Personal characteristics
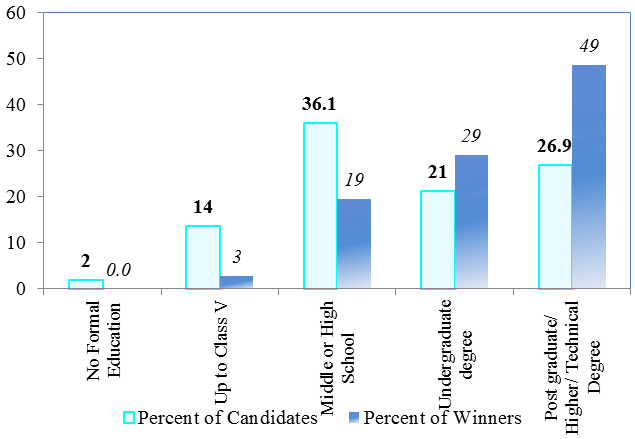
Looking at their personal characteristics first, there is a strong pattern of a larger proportion of more educated candidates winning than less educated candidates (Figure 1). Out of 543 elected members in the lower house of the parliament (Lok Sabha), 260 had a postgraduate or higher degree or a technical degree (several of the parliamentarians had a law degree); an additional 157 had an undergraduate degree.
Figure 1. % of candidates and winning candidates in each education group
Source: Gupta and Panagariya (2011).
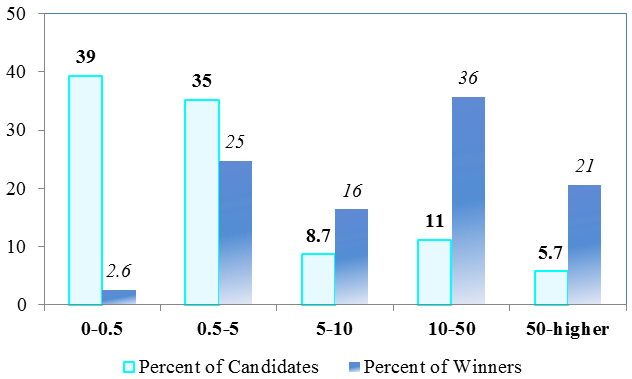
The winning candidates are also wealthy compared to those losing the election. Based on officially acknowledged wealth, one in five members is a dollar millionaire. Almost another two in five claimed wealth of 10 million or more Indian rupees. The unconditional probability of victory rises with wealth (Figure 2).
Figure 2. % of candidates and winning candidates in each wealth group (wealth in million rupees)
Source: Gupta and Panagariya (2011).
Being a woman increases the unconditional probability of winning, even though only a small percentage of the elected representatives were women. While 7% of all the candidates who contested were women, they represented 11% of the winning candidates.
The most disconcerting feature of the current Lok Sabha is the presence of a large number of members with criminal cases pending against them. The proportion of those with one or more criminal cases registered against them is 14% among candidates, and 30% among the elected members. Thus, the victory rate is higher among the accused than ‘clean’ candidates. Indeed, detailed data show a steadily rising trend of victory rates as we move from groups of candidates with no charges to those with larger and larger numbers of cases registered against them.
Why do the candidates with criminal charges do well in elections? The most promising explanation is that the candidates with criminal charges are wealthy. Dutta and Gupta (2014) show that while voters tend to penalise candidates with criminal charges, they also vote for wealthier candidates. The positive effect of wealth on the vote share is higher for candidates with criminal charges. In addition, a large number of these ‘tainted’ candidates are affiliated with a large party, and some of them may be incumbents, enjoying the associated benefits of name recognition, patronage, and access to the official machinery.
Figure 3. A comparison of candidates with and without criminal charges
Note: Candidates with charges are those who faced at least two charges.
Source: Dutta and Gupta (2014).
Party affiliation
A total of 8,071 candidates contested the election for 543 seats in the lower house of the parliament in 2009. Thirty percent of the candidates were affiliated with national or regional parties, 3,825 candidates had no party affiliation, and the rest belonged to the smaller (unrecognised) parties. In all, 372 parties fielded one or more candidates.1 How can one explain the better performance of the candidates of the larger parties? It could simply be that the larger parties field candidates with better electoral prospects; or it could be that voters are more familiar with larger parties’ candidates since they have a longer track record, or prefer them because of their ideology or caste identity; or that the larger parties have a stronger network of party workers to help campaign, and more resources at their disposal to spend on election campaigns – all of which can influence the voters in their favour.
Comparing various observable characteristics of the candidates of the larger parties with those of the other candidates in Figure 4 below, we see that the candidates fielded by larger parties are proportionately older, more educated, wealthier, and include more incumbents, women, and criminally charged.
Figure 4. Comparing the characteristics of the candidates of larger parties and other candidates (averages)
Source: Authors’ calculations using the data from the Association for Democratic Reforms (http://myneta.info).
Based on the information above, if one were to construct a winning candidate with the average characteristics, he would be a wealthy male in his mid-fifties, with at least an undergraduate degree. He would come from one of the larger political parties. There is a 30% chance that he would have at least one criminal case against him, a 15% chance that he would have two or more criminal cases pending against him, and a 14% chance that he would have at least one serious criminal case registered against him. There is also a 34% probability that he would have served as a member of the previous parliament.
Economic performance and incumbency advantage
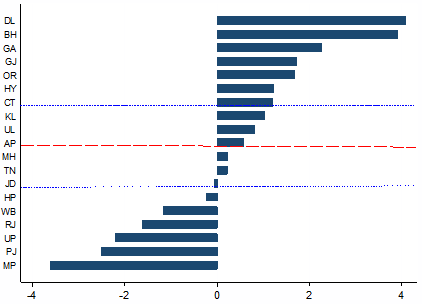
In Gupta and Panagariya (2011), we measure performance by the average economic growth in the states from the beginning of the fiscal year 2004–05 to the end of 2008–09. In Figure 5, we depict the deviation of the average growth in the state domestic product from the national GDP growth for each of the 19 states we analyse, with the states stacked in declining order of their growth rates.
Figure 5. Difference between the average growth rate of state domestic product and the GDP growth rate (2004–2008)
Source: Gupta and Panagariya (2011).
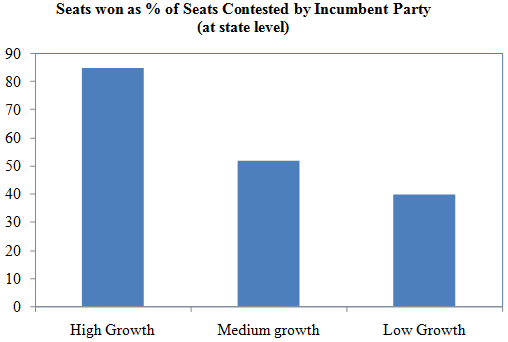
The key question we ask is: What proportion of the candidates fielded by the state incumbent party won the national election? The outcome is depicted in Figure 6. The average proportion of the incumbent party’s candidates winning the election in high-growth states was an impressive 85%. In contrast, those in medium- and low-growth states on average won only 52% and 40% of the seats contested, respectively. In Gupta and Panagariya (2014), we obtain this strong relationship between growth performance and election outcomes in systematic econometric analysis. Quantitatively, the effect of growth is much larger than the effect of candidates’ personal characteristics or their party affiliations.
Figure 6. Proportion of the candidates of the incumbent party in the state winning the national election (sorted by states’ growth rates)
Source: Gupta and Panagariya (2011).
Conclusion
In this column, we have discussed the factors that influenced election outcomes in the 2009 parliamentary elections in India. Drawing on our recent research, we find that even though individual characteristics matter, the incumbent party’s performance, measured by economic growth, has the largest effect on election outcomes. The incumbents who deliver high growth in states are rewarded in parliamentary elections as well. We also touched upon the reasons candidates with criminal charges fare well in elections, and pointed to the wealth advantage that they enjoy. Our view is that reducing their presence would require a consensus among parties – since they are widespread across all parties – to eliminate their wealth advantage, and make their conviction speedier.
What does our analysis imply for the parliamentary elections due in April–May 2014? If this election were to play out like the 2009 election, the outcome would once again be the aggregate of the state-level outcomes, with the latter influenced the most by the economic performance of the state. But some factors are likely to ameliorate this effect this time round. First, there now appears to be a ‘wave’ factor at work in the election. Opinion polls suggest that many voters in northern India are attracted to the prime ministerial candidate of the opposition BJP party, and therefore may vote for the BJP candidates regardless of the performance of the state. Second, in the recent subnational elections concluded in December 2013, a new party known as the ‘Aam Admi Party’ (AAP) has emerged on the scene. This party has put the fight against corruption at the forefront of the national agenda, and has acquired some national prominence. Whether this party takes away votes from the Congress, the BJP, or some of the regional parties may have a determining influence on the outcome. In an election with three or more serious candidates, even a shift of 1% or 2% of voters can alter the outcome in a major way.
Our concluding thought is that as a result of the challenge posed by the AAP, we might see fewer candidates with criminal charges contesting the upcoming elections. The AAP has emphasised that it would only field candidates with a clean image, and this is likely to induce other parties to also shun candidates with a tainted image. A corollary is that wealth might play a smaller role as well.
References
Brender, Adi and Allan Drazen (2008), “How Do Budget Deficits and Economic Growth Affect Reelection Prospects? Evidence from a Large Panel of Countries”, The American Economic Review, 98(5): 2203–2220.
Dutta, Bhaskar and Poonam Gupta (2014), “How Indian Voters Respond to Candidates with Criminal Charges: Evidence from the 2009 Lok Sabha Elections”, Economic and Political Weekly, 49(4), 25 January.
Gupta, Poonam and Arvind Panagariya (2011), “Economic reforms and Election Outcomes”, in Jagdish Bhagwati and Arvind Panagariya (eds.), India: Trade, Poverty, Inequality and Democracy, New York: Oxford University Press.
Gupta, Poonam and Arvind Panagariya (2014), “Growth and Election Outcomes in a Developing Country”, Economics and Politics, forthcoming.
1 The Election Commission confers the status of state party on any party that meets certain thresholds in terms of votes received and seats won in a prior election. A party qualifying as a state party in four states gets the national status. A party loses its national or state status if it loses the necessary qualifications. Registered parties with neither state nor national status are called unrecognised parties.


