The media coverage surrounding the 2013 papal conclave revealed Italy held about a fifth of the votes and the US about a tenth – figures that seem somehow large relative to the global billion of Catholics. Indeed, the Catholic church has been criticised for failing to give an adequate voice to the global south, which now garners a majority of Catholics.
The Italian stronghold on the conclave is very old and explained by the immersion of the Vatican in Italy at a time when communication and transportation were slow and difficult. During the last century, cardinals from the English offshoots regularly missed the conclaves, arriving in Rome after the election of the new pope.
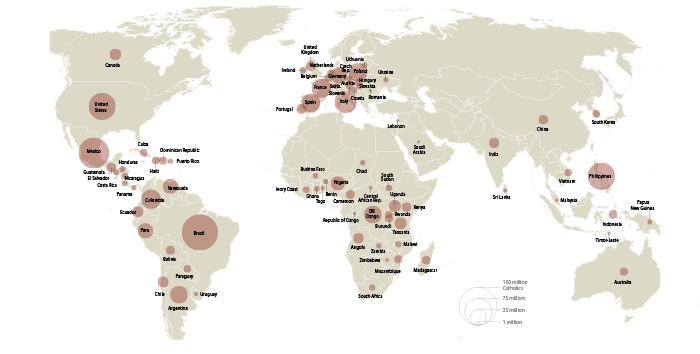
With modern technology at our service today, there does not seem to be any reason left to justify Italian pre-eminence. Regarding the US, it turns out that it was until recently under represented. This means that change can happen. Yet this is a northern country and, as the Pew Research Center map shows below, the Tropic of Cancer neatly divides the Catholic population.
Figure 1. Catholic populations
Voting theory and vote allocation
Using math to analyse formal decision-making procedures has a long precedent (e.g. Buchanan and Tullock 1962, Hirschman 1970, Olsen 1965, Downs 1957, and Felsenthal and Machover 1998). The recent conclave gives us an opportunity to apply concepts from voting theory and apportionment and inquire whether the south and the north are equal in the eye of the church. We focus on proportional representation as the implementation of the equality principle so dear to Catholics (and democrats). We use a recent PEW study on Christian faith, population from the World Bank and citizenship of voting-age cardinals in the conclaves since 1963 to find out more about representativeness.
In my calculations, the north gathers Europe and its offshoots (US, Canada, Australia, New Zealand), Catholics figures are in millions, cardinals are those having attended the last conclave and Weight is the ratio of the later to the former i.e., how many Catholics are needed to be awarded an elector.
Currently, there are 9.3 million Catholics per cardinal of voting age. If we follow the proportionality principle, which is at work in the constitution of democratic countries, every country that hosts more than 9.3 million Catholics 'should' be awarded a cardinal.
Obviously some local variation is to be expected:
- North and south regions aggregate many countries, so these differences should average out to produce similar weights.
- As can be seen from the tables below, this is far from being the case.
Table 1. Cardinals and Catholics in north and south countries
Source: Data for all the calculations can be found here.
The underlying Catholic population has doubled since 1963 and likewise the conclave has increased in size. The share of cardinals from the north first receded but has remained constant since 1978 at two thirds while the northern Catholic population has fallen from one half to one third of the world total. There was thus an imbalance 50 years ago and it has not been reduced. To assess the distortion of representation across time, we compute the ratio of weights, namely Wsouth over Wnorth. Inequality, as measured by the Q ratio, was initially reduced from 3.3 to 2.2 but then severely amplified to 3.8.
We now offer some more detailed country statistics.
Table 2 shows current weights (population over cardinals). The ratio of largest to lowest is 542 but this extremely large figure should be treated with caution since it susceptible to large changes upon the renewal of cardinals. Removing extremes, the ratio would fall to approximately 80 which is still quite large compare to other systems of apportionment. Indeed, it is typically between four and five in the apportionment of parliamentary seats among the regions of a country e.g., France, Canada, Spain, the UK, Japan (close to unity in Sweden). This presentation also misses out on the large Catholic countries currently without a voting cardinal. We thus move to an axiomatic framework.
Table 2. Catholic populations over cardinals
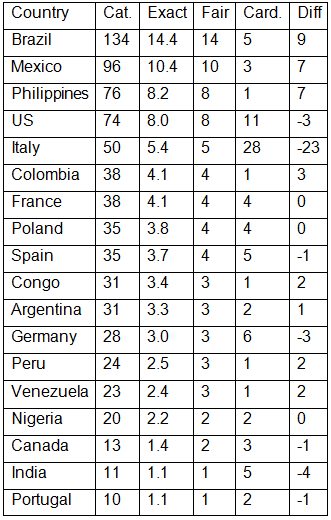
Table 3 below orders countries by decreasing number of Catholics, the exact proportion of cardinals each deserves based on the current conclave size of 117, the fair rounding using the largest remainder method, the actual number of cardinals and the difference. In a fair world, Mexico and the Philippines should each get seven more cardinals. Italy should get 23 fewer.
Table 3. The fair number of cardinals
The source of our computation is available here.
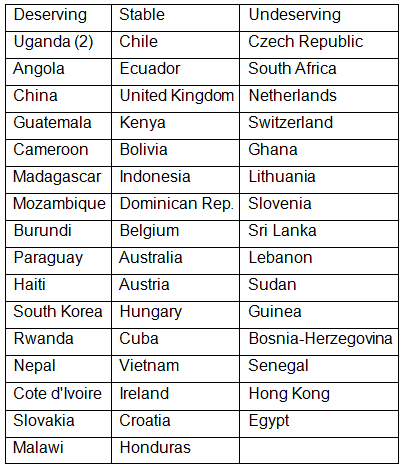
Table 4 presents countries that deserve one cardinal (two for Uganda) but have none, those who have one and would keep one under the current rounding method and the undeserving ones whose cardinal should not be renewed.
Table 4. Which countries deserve a cardinal?
Conclusion
The sole logical explanation lies with the church hierarchy, who seem unwilling to relinquish power to those representing the greater mass of Catholics. The southern origins of the new pope may then be interpreted as an opportunity for righteous change.
References
Buchanan J M and G Tullock, The Calculus of Consent, 1962.
Hirschman A O, Exit, Voice and Loyalty, 1970.
Olsen M, The Logic of Collective Action, 1965.
Downs A, An Economic Theory of Democracy, 1957.
Felsenthal D S and M Machover, The Measurement of Voting Power, 1998.


