A large literature has studied the historical evolution of wealth accumulation and wealth distribution in Western countries (e.g. Atkinson and Harrison 1978, Goldsmith 1985, Lindert 2000, Soltow and Van Zanden 2001, Roine and Waldenström 2015, Scheidel 2018). Particularly notable contributions are Piketty (2014) and Piketty and Zucman (2014), which document and interpret trends in aggregate wealth-income ratios and top wealth shares since the industrialisation era. According to their interpretation, wealth accumulation and wealth concentration reached extreme levels during the era of unfettered capitalism in the 19th century. In the 20th century, world wars and capital taxation equalised wealth until the 1980s, when market-friendly reforms resurrected capital values and led to higher wealth inequality and capital shares.
Recent studies, however, have revised some of the historical series of Piketty and Zucman, adding more country observations. In a new paper (Waldenström 2021), I discuss the credibility of these new data and analyse how they affect the historical wealth trends and our understanding of the drivers behind them.
Revised historical wealth-income ratios
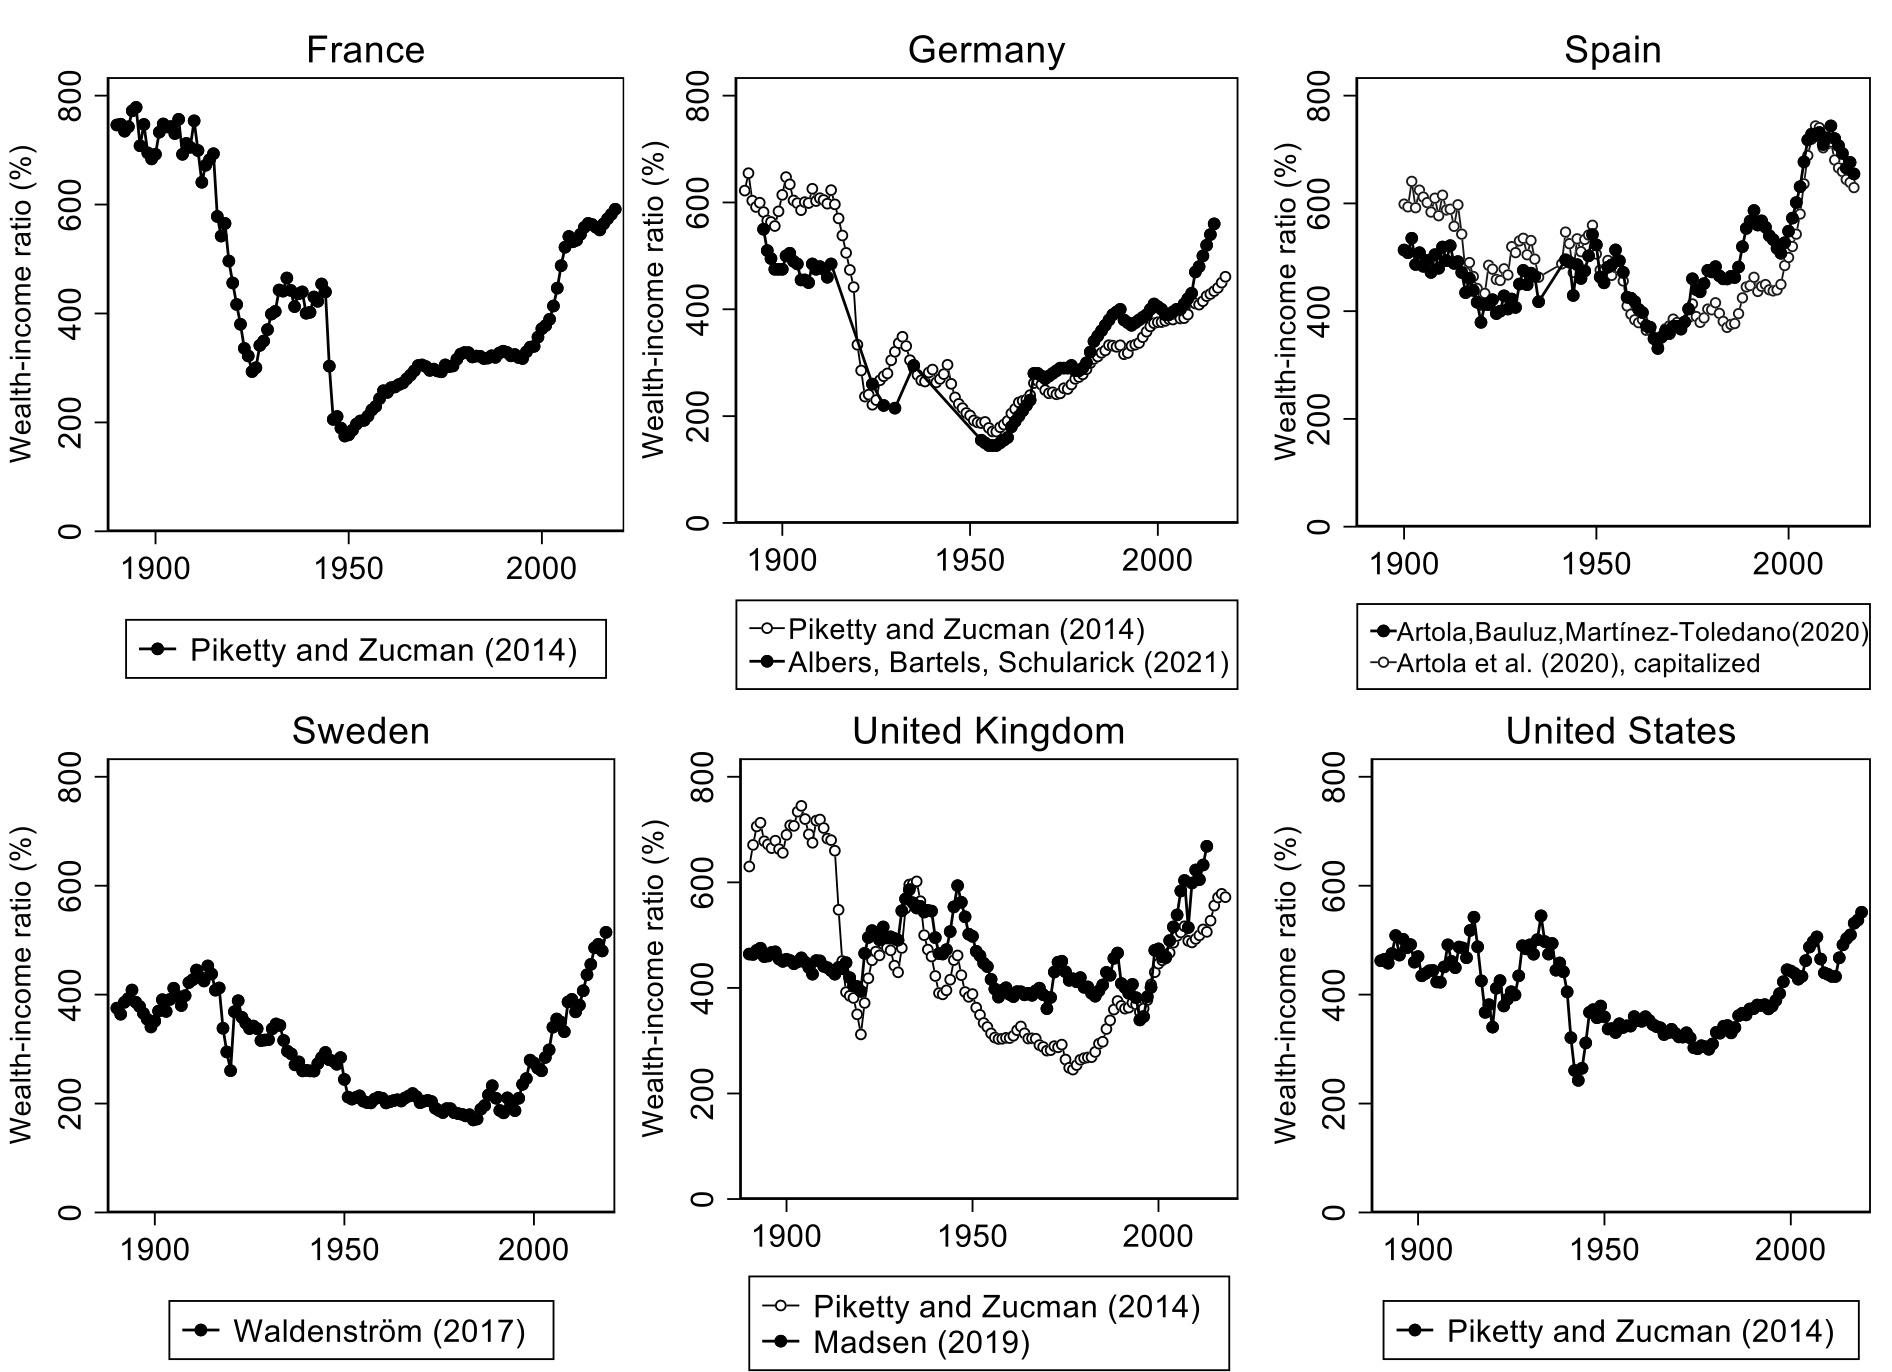
Figure 1 shows aggregate private wealth-income ratios in six countries for which consistent, long-run evidence is available: France, Germany, Spain, Sweden, the UK, and the US. The series of Piketty and Zucman show wealth-income ratios being historically high in 19th century Europe, around 600–800% of national income, and dramatic drops during the world wars after which they stayed low until the 1980s when they increased substantially.
The revised and new country series for Europe produces a different picture, especially for the pre-WWI period. The new German series has a wealth-income ratio of 500% instead of 600%, and the new UK series shows 450% instead of 700%. For newly added Spain and Sweden, pre-WWI wealth-income ratios are around 450–500% of national income (the series of France and the US have not been re-examined). The main reasons that the revised German and UK series differ from those of Piketty and Zucman is the use of new sources and adjusted computational assumptions (see Waldenström 2021 for further discussion). Looking at the 20th century, the new series present a less volatile trend, with some variation around the world wars but without any lasting trend breaks (except for Germany). The post-1990 increases are observed in both older and newer series.
Figure 1 Wealth-income ratios in history
Note: See Waldenström (2021) for definitions and sources.
A particular finding of Piketty and Zucman is the remarkable pre-WWI divide between Europe and the US, shown in the left panel of Figure 2. Their explanation is that wealth accumulated to high levels in pre-democratic, low-tax Europe whereas the US was a younger country with less time to build up capital and an abundance of land making capital less valuable. However, the new series for Europe in Figure 2’s right panel shows no such continental divide.
Figure 2 Europe-US wealth-income ratios: A pre-WWI divide?
Note: Left panel: Piketty-Zucman “Europe” consists of France, Germany, and the UK. Right panel: Revised and extended “Europe” consists of France, Germany, Spain, Sweden, and the UK, with revised series for Germany and the UK. All European series are unweighted averages. See Waldenström (2021) for population-weighted European averages, and for definitions and sources.
The post-war rise of popular wealth
Since 1950, private wealth-income ratios have grown steadily around the Western world, accelerating after 1990. Figure 3 examines this development by decomposing private wealth into three asset groups: housing wealth, pension wealth, and other wealth.
The main result is that private wealth underwent a structural shift over the 20th century. Around 1900, wealth was dominated by agricultural estates and corporate wealth, assets predominantly held by the rich. During the post-war period, wealth accumulation came mainly in housing and funded pensions, which are assets held by ordinary people. This compositional trend had important distributional implications.
Figure 3 Decomposing aggregate wealth-income ratios since 1890
Note: ‘Housing wealth’ includes buildings and land under 1-2 family homes, apartment buildings (including financial shares in tenant-owned apartments, national accounts item AF.519). ‘Pension wealth’ includes all insurance savings assets in AF.6. See Waldenström (2021) for further information about definitions and sources.
Wealth concentration: Long-term equalisation and then stabilisation
The distribution of wealth among households is a central dimension in the analysis of private wealth in society. Figure 4 shows the evolution of top-percentile wealth shares, which is the most commonly used distributional measure in the historical literature.
Wealth concentration was exceptionally high a century ago, with the richest percentile owning between 50% and 70% of all private wealth. From the 1920s to the 1970s, wealth concentration fell dramatically in the Western world. Country studies confirm the importance of homeownership and pension savings for this equalisation trend. In the 1970s, wealth equalisation stopped, but then Europe and the US follow separate paths. In Europe, top wealth shares stabilise at historically low levels, perhaps with a slight increasing tendency, while in the US, top wealth shares have increased (exactly by how much is currently debated).
This stability of post-1970 top wealth shares may seem contradictory to the large increases in aggregate wealth-income ratios (Figure 1). However, it is consistent with most aggregate wealth today being in housing and pensions, which are assets predominantly held by low- and middle-wealth households, implying a more equal distribution of wealth than a century ago.
Some studies have examined whether adding social security wealth – defined as the net present value of future pension incomes in unfunded pension schemes – or offshore wealth would influence long-run wealth concentration trends. In Waldenström (2021), I present available historical evidence on these additional assets and their distributional impact. The bottom line is that they do influence the top wealth shares in the modern era, but not enough to alter the main result in Figure 4 that wealth today is much more equally distributed than it was during the early part of the 20th century.
Figure 4 Top 1% wealth share in six countries, 1896–2019
Note: See Waldenström (2021) for definitions and sources.
Conclusions
The historical analysis of capital’s role in Western market economies is being revised. New and revised series suggest that aggregate wealth-income ratios were lower before WWI than previously thought, and that private wealth has changed from being mainly held by the rich to being mainly held by the middle class. This would explain why the dramatic historical wealth equalisation over the past century has not been reversed in recent years, despite rapidly increasing aggregate wealth-income ratios.
The new results influence our understanding of the long-run evolution of wealth. They question the view that unfettered capitalism generates extreme levels of capital accumulation. They also cast doubt on the explanation that wars, crises, and capital taxation are necessary for wealth equalisation. Instead, the historical evidence emphasises the vast accumulation of widely dispersed household assets in housing and pension savings when accounting for the observed trends in the growth distribution of wealth over the past century.
A promising next step would be to study the institutional changes underlying the accumulation of popular wealth. Among these changes are reforms promoting democratic change, broadened educational attainment, and improved labour rights, which contributed to lifting the earnings of workers and offering them opportunities to invest in their own future.
References
Atkinson, A B and A Harrison (1978), The Distribution of Personal Wealth in Britain, Cambridge University Press.
Goldsmith, R W (1985), Comparative National Balance Sheets: A Study of Twenty Countries, 1688–1978, University of Chicago Press.
Piketty, T (2014), Capital in the Twenty-First Century, Belknap of Harvard University Press.
Piketty, T and G Zucman (2014), “Capital is Back: Wealth-Income Ratios in Rich Countries 1700–2010”, Quarterly Journal of Economics 129(3): 1255–1310.
Piketty, T and G Zucman (2013), “Rising wealth-to-income ratios, inequality, and growth”, VoxEU.org, 26 September.
Roine, J and D Waldenström (2015), “Long-Run Trends in the Distribution of Income and Wealth”, Handbook of Income Distribution, Volume 2A, North-Holland.
Scheidel, W (2018), The Great Leveler: Violence and the History of Inequality from the Stone Age to the Twenty-First Century, Princeton University Press.
Scheidel, W (2019), “Inequality: Total war as a great leveller”, VoxEU.org, 02 September.
Soltow, L and J L Van Zanden (2001), Income and Wealth Inequality in the Netherlands, 16th–20th Century, Het Spinhuis.
Waldenström, D (2021), “Wealth and History: An Update”, CEPR Discussion Paper 16631.


