Assessing fiscal policy support to companies during the Covid-19 crisis raises many challenges. First, the nature of the shock was unprecedented. The Covid-19 shock had a strong supply-side dimension due to economic and social restrictions; it first hit customer-facing services and industries linked to international movements of people, such as airlines and tourism, then propagated across sectors and value chains. This calls for an approach that captures firm-level heterogeneity across industries, size, and geographical location. Second, the policy response was unprecedented both in magnitude and scope, with strong complementarity between monetary and fiscal responses and across a broad array of fiscal instruments, making it difficult to identify the causal impact of any one factor. Third, many government schemes had a broad scope and limited conditionality, preventing causal identification. Fourth, important data, such as financial statements for 2020 and 2021, are not yet available and uncertainty remains high. Covid-19 variants are casting a shadow on the recovery, and the vaccination gap is wide open in the emerging and developing world. The crisis is not over, and we know little about its long-term consequences.
Today, we know more about the impact of Covid-19 on firms’ cash flow and risk of bankruptcy, but most studies do not have firm-level data on government support and therefore must calibrate it (e.g. Gourinchas et al. 2021). Our French evaluation bridges this gap (Committee on the Monitoring and Evaluation of Financial Support Measures for Companies Confronted with the Covid-19 Epidemic 2021). It focused on four main support schemes: job retention (or furlough), the Solidarity Fund (a subsidy scheme for smaller companies), state-guaranteed loans, and deferral of social security contributions during the first two waves of the pandemic (March to July 2020, and October 2020 to March 2021). Disbursements under these four schemes amounted to €69 billion in subsidies (job retention and Solidarity Fund) and €161 billion in loans (state-guaranteed loans and contributions deferral) at the end of June 2021, totalling almost 10% of French GDP.
We matched firm-level data on the take-up of the measures with structural data on firms and their balance sheets. We analysed firms’ individual trajectories in terms of compensations, headcount, and turnover after the first wave of the pandemic until March 2021, depending on their individual and sectoral characteristics and their use of the support schemes. In total, 3.5 million French firms had recourse to the schemes, employing 16.1 million employees. The complete database, including non-recourse firms, covers 6.6 million firms.
Firm-level data helped us answer some of the key questions raised by the support schemes. Did money go to firms most in need? Did firms use ‘too many’ schemes or ‘too few’, and in the latter case, was that a voluntary decision? How much did government support offset the Covid-19 shock, and how much did it differ across industries and firms? Finally, did firms perform better after receiving government support?
Support schemes were rolled out swiftly and adapted when needed
In addition to data-based analysis, we asked 600 business leaders for feedback. Government responsiveness and the ease of using the measures were favourably assessed. During the first wave of the pandemic, the schemes were rolled out swiftly and the refusal rate of state-guaranteed loans, a significant focal point for businesses, proved very low. During the second wave, access to the Solidarity Fund was made considerably easier and additional schemes were introduced to cover needs that appeared as the crisis developed. This uncovered a trade-off: although support was better designed, schemes became more complex, and payment took longer due to more stringent audits.
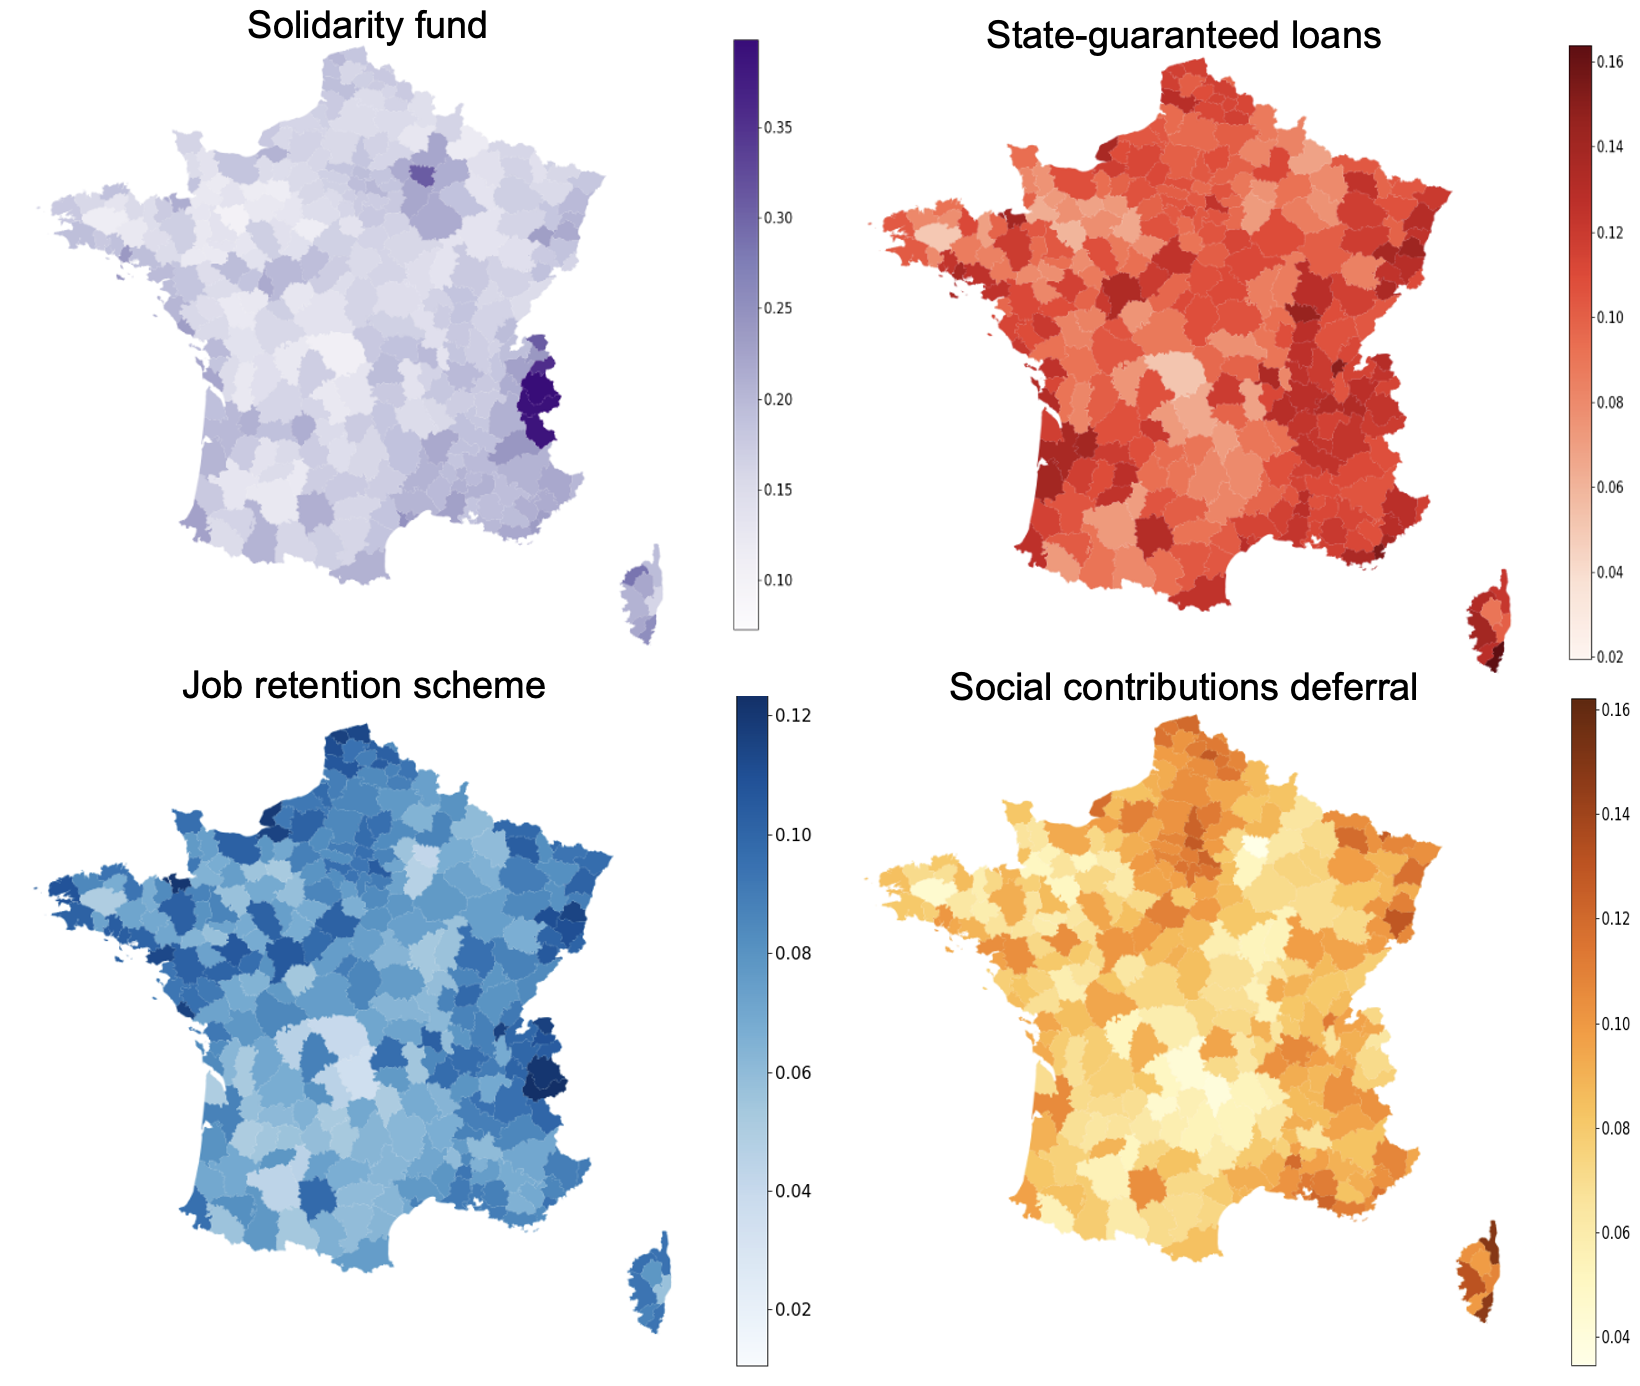
In terms of sectors, hospitality (i.e. hotels and restaurants) had the highest take-up of the subsidy measures during both waves and particularly during the second. Figure 1 shows the geographical distribution of the take-up rate. Provence-Alpes-Côte d’Azur and Corsica were the only two regions whose share in each measure was markedly greater than their share of GDP. Further analysis found significant local fixed effects, with regional differences in sectoral structures and company characteristics (e.g. tourism in the Alps region) only partially explaining the variance in the recourse to measures (Barrot 2021).
Figure 1 Take-up rate by measure and by employment area
The main subsidy schemes have offset 45% of the fall in gross operating surplus during the first wave, and 100% during the second wave
The gross operating surplus of market economy industries was €45 billion lower over the first four quarters of the crisis than its pre-crisis level, a 4% drop.2 Figure 2 provides details by industry. This drop occurred mainly during the first wave of the pandemic.
By simulating firm-level gross operating surplus using data on VAT payments (as a predictor of turnover) and compensations, we found that the main subsidy schemes – the Solidarity Fund and job retention – offset 45% of the drop in gross operating surplus during the first wave, and 100% during the second wave. Combined disbursements were unchanged between the two waves (with the ramp-up of the Solidarity Fund making up for a lesser recourse to job retention) even though the decrease in gross operating surplus was halved between the first and second waves.
Among all sectors, hospitality received the most support. Subsidies amounted to 99% of its pre-Covid gross operating surplus, which decreased by only 30%, in line with transport and construction, which received much less support. Transport equipment manufacturing is the sector where the gross operating surplus dropped the most (-54%), with subsidies representing 25% of its pre-crisis gross operating surplus. Gross operating surplus increased in three sectors: agriculture, IT and communications, and household services. The first two sectors were hardly hit by the crisis, while the third was massively subsidised (44% of its pre-crisis gross operating surplus).
Figure 2 Support provided by subsidy measures to gross operating surplus, by industry
To use or not to use? The intensity of use decreases with business size, joint use of several measures was not systematic, and non-use appears to be mostly voluntary
Digging into firm-level data helps us understand which companies have accessed the schemes, which have not, and why.
- Small businesses’ share of the amounts paid out was higher than their share of employment
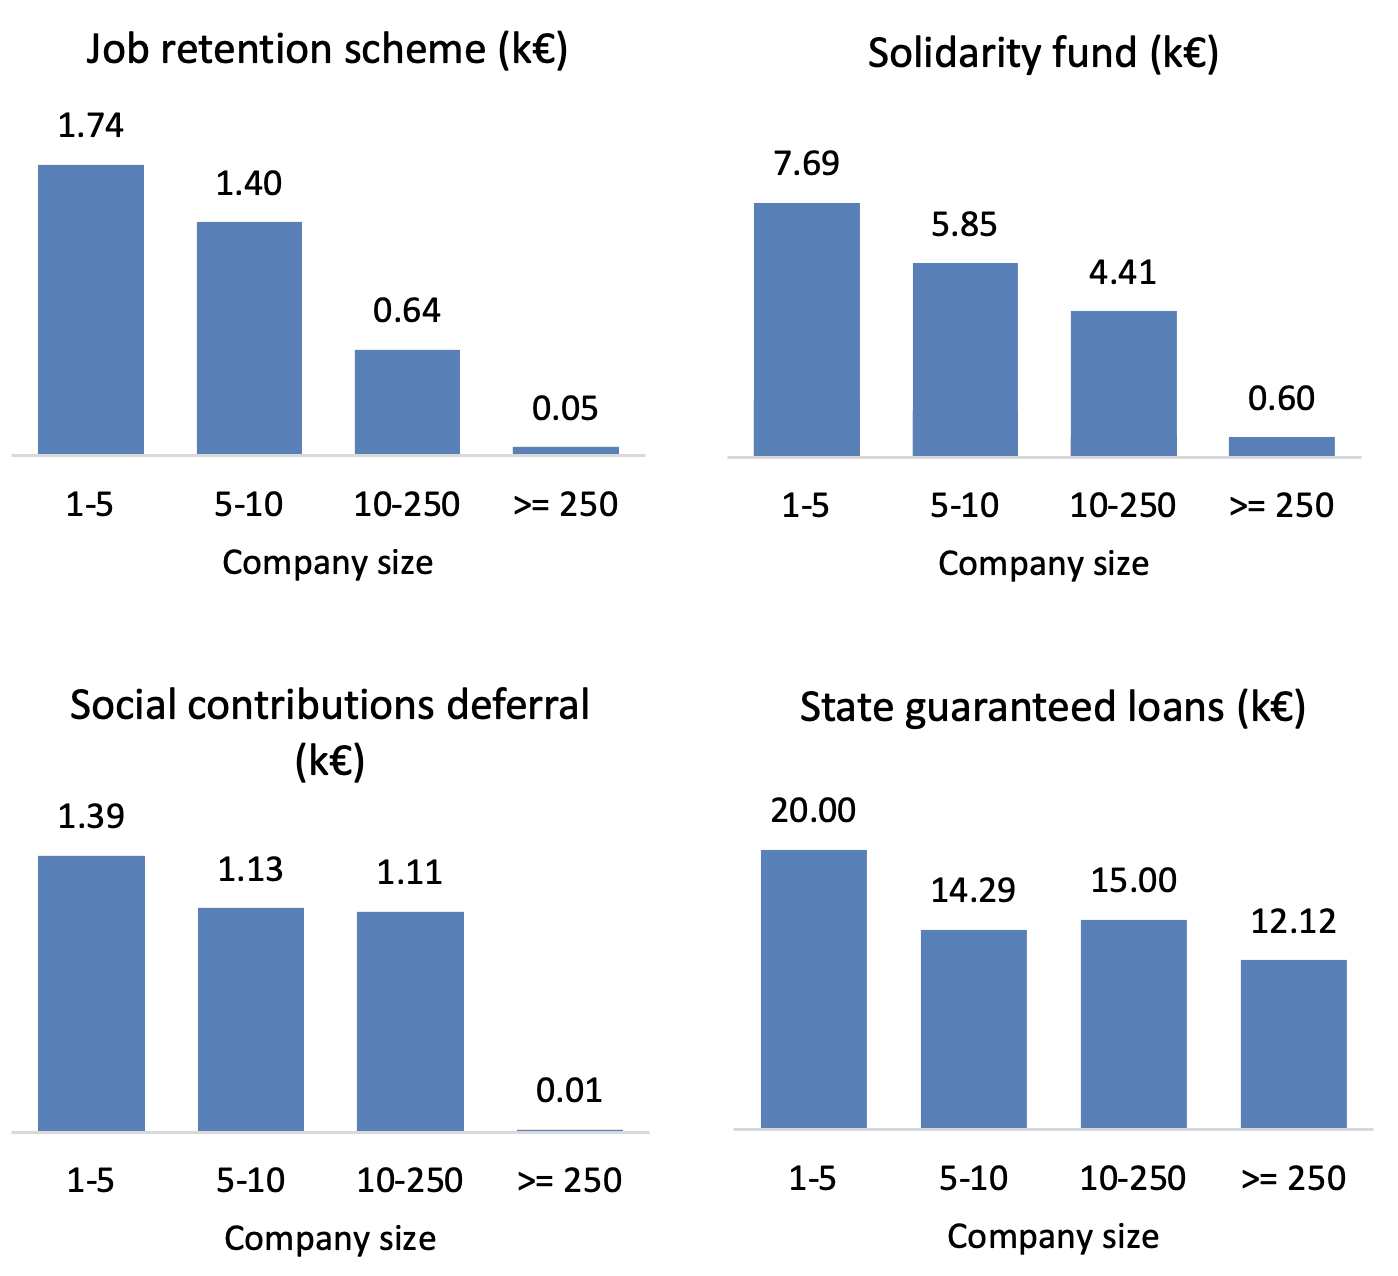
As can be seen in Figure 3, the median amount received by employees sharply decreased with firm size. Very small businesses account for around 18% of French private jobs and 99% of disbursements of the Solidarity Fund (which was specifically designed to support SMEs) during the first wave, 63% during the second wave. They accounted for around 30% of job retention and state-guaranteed loans volume, and around half of social contributions deferrals during both waves.
Figure 3 Median amount received by employee, by firm size, and by support measure
- Use of the schemes as a function of firms’ financial health followed an inverted-U curve
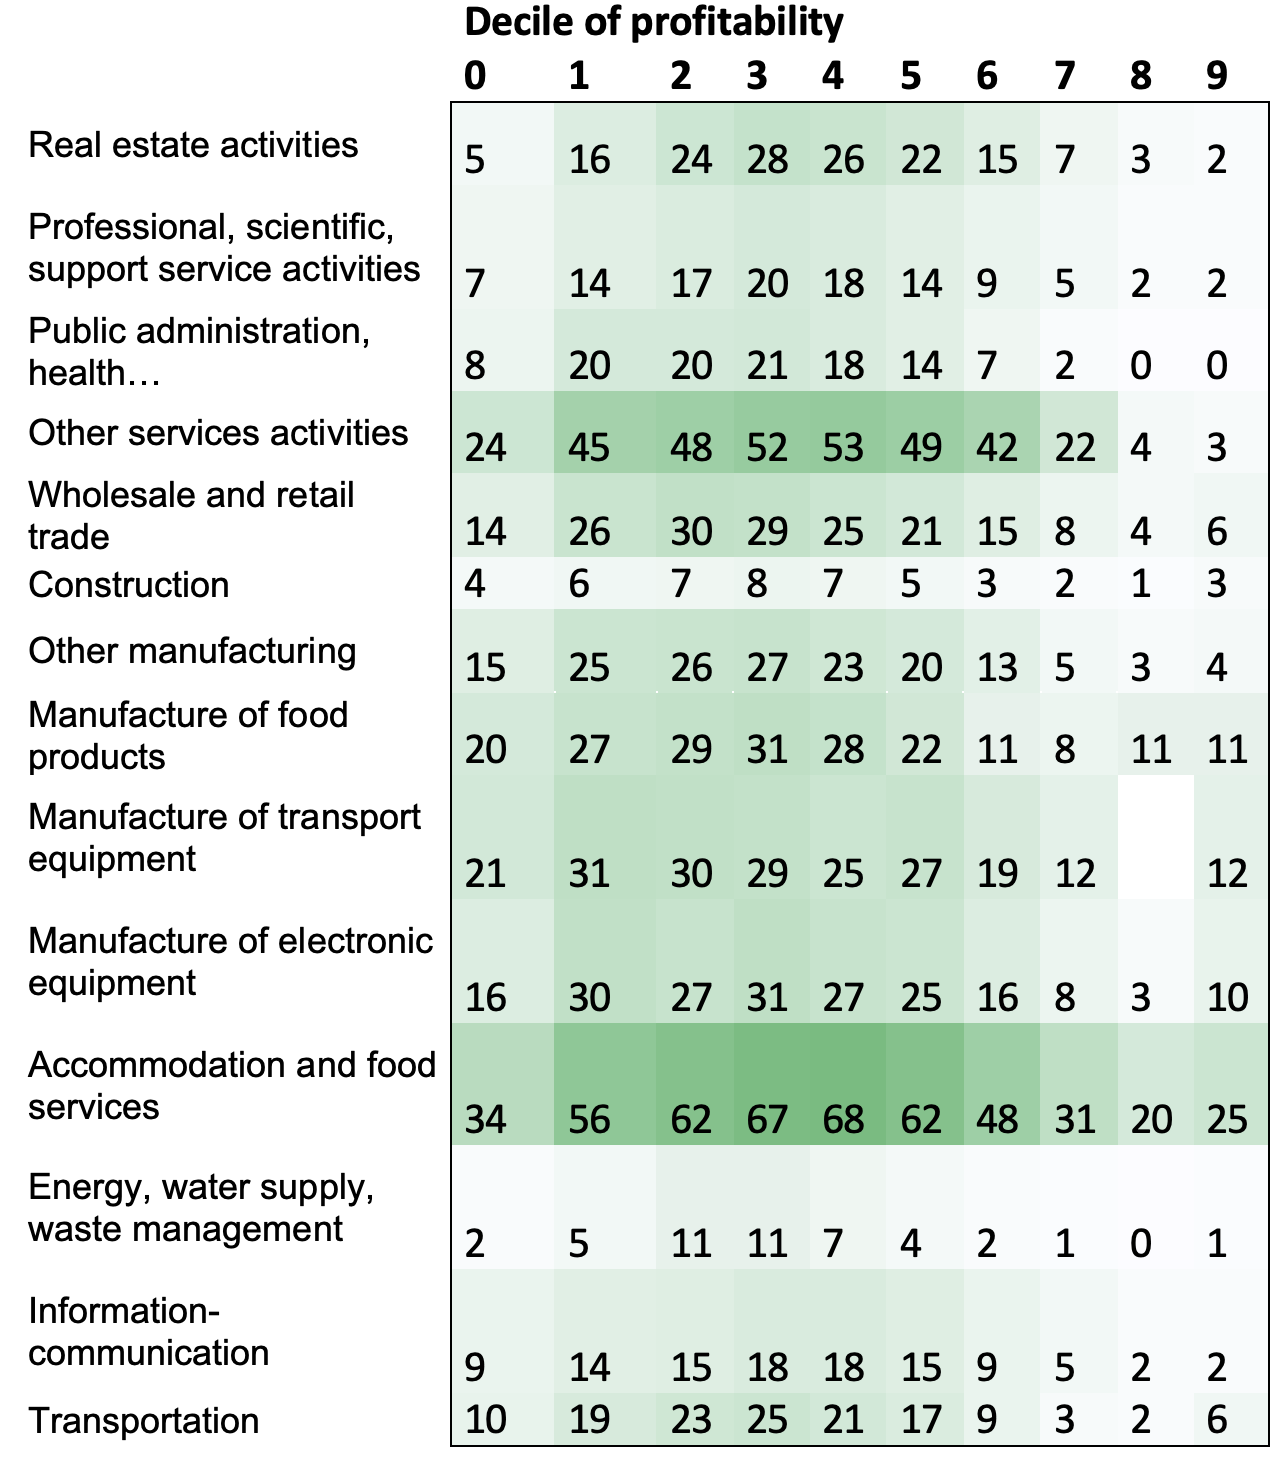
As can be seen in Table 1, in the case of job retention, the use of the measures was particularly low for the first and last three deciles of profitability, peaking around the fourth decile for each of the economy’s 17 sectors. The take-up rate of job retention in the hospitality sector during the second wave was 67% in the fourth decile against 34% in the first decile and 25% in the last decile. This inverted U-curve is observed regardless of the measure analysed or the financial health indicator used (Banque de France rating, profitability, liquidity, interest cost, working capital), and during both waves of the pandemic.
Table 1 Take-up rate of job retention, by industry and by deciles of profitability
While it doesn’t come as a surprise that financially strong firms made less use of the support schemes, lower take-up by weaker firms is puzzling. Computing the intensity of take-up, defined as the amount of support compared to turnover, helps explain why. Unlike the take-up rate, the intensity of take-up does not follow an inverted-U curve as a function of profitability. It culminates in the first decile of profitability, particularly for job retention and the deferral of social contributions. Fewer firms in the first decile made use of the measures, but they received more money, and the latter effect dominates.
Finally, firms identified as ‘zombies’ before the crisis did not mobilise the schemes beyond their share of the economy (that is, 7.5% of employees and 4% of value added) in either the second or first wave, which sheds empirical light on policy discussions of zombie firms (Demmou et al. 2020, Laeven et al. 2020).
- Although broadly scoped ex-ante, government support was channelled ex-post to firms most affected by the crisis, particularly during the second wave of the pandemic
We wanted to know whether government money went to the right place. We found, first, that firms which increased their turnover didn’t receive as much. Starting with the first wave, firms reporting a higher turnover in Q2 2020 than in Q2 2019 accounted for 27% of employment and received only 14% of subsidies paid out by the Solidarity Fund and job retention scheme by the end of September 2020. Conversely, firms reporting a 40%+ turnover decrease represented 25% of jobs and received 48% of subsidies paid out at the end of September 2020. Disbursements were even better targeted during the second wave. Firms reporting a higher turnover in Q4 2020 than in Q4 2019 accounted for 47% of employment and received 10% of subsidies from October 2020 to March 2021. Conversely, firms reporting a 40%+ turnover decrease accounted for 11% of employment and received 67% of subsidies paid out at the end of September 2020.
Microsimulation based on VAT (as a predictor of turnover) and compensation data suggests that 59% of French companies experienced a drop in their gross operating surplus in 2020. This number would have been 72% without the support schemes. Support was larger at the lower end of the cash flow distribution: government subsidies amounted to nine points of 2019 value-added in the most impacted quintile against less than two points in the less impacted quintile.
- Joint use of several schemes was limited, while non-use was significant and largely voluntary
Figure 4 presents a Venn diagram of the joint take-up of one or several schemes, by company size. Companies that took up government money very often took it from only one scheme. Job retention was the preferred scheme during the first wave. During the second wave, it remained preferred by large companies (>250 employees), while smaller companies (<10 employees) and medium-sized companies (10-250 employees) preferred to ask for deferrals of social security contributions and for state-guaranteed loans, respectively. Among companies having used at least one scheme, the share of companies using at least three schemes decreased sharply with size.
In sum, the joint use of several schemes was limited, even though most companies were eligible to use all. Unsurprisingly, the share of firms using at least three schemes was markedly higher in the hospitality sector.
Since access to the four schemes was largely unconditional, one might have expected most firms to use at least one. In fact, non-use accounted for 11% of the total workforce and decreased with firm size, from 20% of the workforce in firms with one to five employees down to 8% in firms with 250+ employees.
Unsurprisingly, non-use was inversely related to the intensity of the economic shock. It was one-third lower than average in hospitality, 25% lower in other service activities and in transport and storage, and 20% lower in transport equipment and food processing. Symmetrically, it was 30% higher than average in information and communication, 50% in finance and insurance, and 90% in agriculture.
Non-use followed a U-shaped curve as a function of pre-crisis financial health, particularly profitability. One might assume that it was ‘voluntary’ for more profitable firms and “non-voluntary” for less profitable firms, but in fact, ‘voluntary’ non-use appears to prevail. Indeed, firms that increased their turnover between Q1 2019 and Q2 2020, or were among the 25% most profitable or 25% most liquid before the crisis, accounted for more than two-thirds of non-use. Failing and ‘zombie’ firms accounted for 0.5% and 1.4% of non-use, respectively. The hospitality industry stands out, with only half of non-use being ‘voluntary’, while zombie and failing firms account for 9% and 8% of non-use.
Figure 4 Joint use of the four main support measures, by firm size
Government support sharply reduced the number of insolvent or failing companies, but we cannot yet identify an impact on firms’ subsequent performance
Whereas economists expected a significant increase in business bankruptcies, not only did these not materialise, but in Q2 2021 they were at markedly lower levels than before the crisis (Cros et al. 2021). Moreover, based on 200,000 balance sheets and income statements closed between 30 June 2020 and early 2021, the Banque de France found that only 14% of companies with turnover in excess of €750,000 had both a higher debt and a lower cash flow after the Covid-19 shock (Doucinet et al. 2021).
Microsimulations based on our database have shed additional light on the impact of the support schemes on the cash flow and solvency of French firms. According to Bénassy-Quéré et al. (2021), the share of newly insolvent firms increased from 3.6% to 6.6% from March to December 2020, while it would have increased to 11.9% in the absence of the measures. The effect is particularly strong in the hospitality sector. Bureau et al. (2021) estimate that the support schemes (not including state-guaranteed loans) brought the share of firms facing a negative cash flow shock back to previously observed levels (47% of firms in 2020 against 50% in 2018), and have reduced the dispersion of shocks, with 13% of firms experiencing a very large negative cash flow shock in 2018 (defined as larger than one month of turnover) against 21% in 2020. Again, the hospitality sector stands out as more impacted.
Finally, we analysed how firms’ payrolls, workforce, turnover, and business failures evolved in 2020–2021 depending on their recourse to support measures during the first wave. Even when controlling for pre-crisis profitability, the magnitude of the shock or the industry, no clear conclusion can be drawn. Firms that haven’t used the measures seem to have been more dynamic in Q1 2021; but as discussed above, these include companies little affected by the crisis and companies already in poor financial health before it began.
Conclusion
Our judgment on fiscal support to French firms in the Covid-19 crisis is tentatively positive. It is confirmed by the most recent macroeconomic data and by early individual data on net financial positions. Windfall effects were to be expected from measures that were largely unconditional, but those effects seem to have been limited. To sum up: few firms have requested the full support to which they were entitled; zombie firms haven’t been disproportionately supported; and support was channelled ex post to firms most impacted by the crisis, particularly during the pandemic’s second wave. A major value added of our work is our firm-level database. The report can thus be seen as a stepping stone for future empirical research.
Author’s note: The author is with the Bank for International Settlements and is also Chairman of the French Committee on the Monitoring and Evaluation of Financial Support Measures for Companies Confronted with the Covid-19 Epidemic. The Committee report was prepared in particular by Cédric Audenis, Vincent Aussilloux and Haithem Ben Hassine (France Stratégie), and Alice Schoenauer-Sebag, Julien Senèze and Paul-Armand Veillon (Inspection Générale des Finances). The views expressed here do not commit the Bank for International Settlements.
References
Bach L, N Ghio, A Guillouzouic, and C Malgouyres (2021), “Rapport d’évaluation de la contrainte pour les entreprises du remboursement des prêts garantis par l’État”, rapport IPP n° 32, April.
Barrot, JN (2021), “Accélérer le rebond économique des territoires”, report to the French Prime Minister, June.
Bénassy-Quéré, A, B Hadjibeyli, and G Roulleau (2021), “French firms through the COVID storm: Evidence from firm-level data”, VoxEU.org, 27 April.
Bureau, B, A Duquerroy, J Giorgi, M Lé, S Scott and F Vinas (2021), “Health crisis: (very) heterogeneous cash flow shocks”, Bloc-Notes Eco, Billet No. 225, Banque de France, 30 July.
Committee on the Monitoring and Evaluation of Financial Support Measures for Companies Confronted with the Covid-19 Epidemic (2021), "Summary of the final report", 9 August (full report available in French here).
Cros, M, A Épaulard, and P Martin (2021), “Will Schumpeter catch COVID-19? Evidence from France”, VoxEU.org, 4 March.
Demmou, L, G Franco, S Calligaris, and D Dlugosch (2020), “Corporate sector vulnerabilities during the Covid-19 outbreak: Assessment and policy responses”, Tackling coronavirus: contributing to a global effort, OECD, May.
Doucinet, V, D Ly, and G Torre (2021), “The differentiated impact of the crisis on the financial situation of companies”, Eco Notepad, Post 219, Banque de France, 15 June.
Gourinchas, PO, S Kalemli-Ozcan, V Penciakova and N Sander (2021), “Fiscal Policy in the Age of COVID: Does it ‘Get into all the Cracks’?”, Jackson Hole Economic Symposium, 27 August.
Guerini, M, L Nesta, X Ragot, and S Schiavo (2020) “Dynamique des défaillances d’entreprises en France et crise de la Covid-19”, Policy Brief 73, OFCE, June.
Laeven, L, G Schepens, and I Schnabel (2020), “Zombification in Europe in times of pandemic”, VoxEU.org, 11 October.
Schivardi, F and G Romano (2020), “A simple method to compute liquidity shortfalls during the Covid-19 crisis with an application to Italy”, Covid Economics: Vetted and Real-Time Papers 35, July.
Endnotes
1 This number was corrected to account for the reform of the Tax Credit for Competitiveness and Employment (CICE), which resulted in the tax credit being paid twice to companies in 2019.
2 For related work on French data, see Guerini et al. (2020) and Bach et al. (2021); internationally, see Demmou et al. (2020), Schivardi and Romano (2020), and Gourinchas et al. (2021).
