The Eurozone is mired in a recession. In 2013, the GDP of the 17 Eurozone countries fell by an average of 0.5%, and the outlook for 2014 shows considerable risks across the region. To stabilise the common currency area and its (partly insolvent) financial system, a Eurozone banking union is being established. An important part of the banking union is the Single Supervisory Mechanism, which will transfer the oversight of Europe’s largest banks to the ECB (Beck 2013). Before the ECB takes over this responsibility, it plans to conduct an Asset Quality Review (AQR) in 2014, which will identify the capital shortfalls of these banks.1
The banking systems in the Eurozone have been severely under-capitalised since the 2007–2009 financial crisis. As a result, some banks loaded up on risky assets (and risky sovereign debt in particular). The worsening risk profile of these assets destabilised banks even further and resulted in substantial liquidity and solvency problems by the third quarter of 2011 (Acharya and Steffen 2013). Too little capital in the banking system appears to have also caused a misallocation of credit in the Eurozone, especially for small- and medium-sized enterprises, preventing a widespread economic recovery.
A comprehensive and decisive AQR will most likely reveal a substantial lack of capital in many peripheral and core European banks. This study provides estimates of the capital shortfalls of banks that will be stress-tested under the AQR using publicly available data and a series of shortfall measures. We document which banks will most likely need capital, where a public backstop is likely needed, and, as many countries are already highly leveraged, where a EU-wide backstop might be necessary.
Stress test sample
The ECB published a (preliminary) list of 124 Eurozone banks that will be part of the AQR in 2014 and subject to ECB supervision in future.2 We use a sample of 109 of these banks (41 banks are publicly listed) where balance-sheet information is available using SNL Financial data. We use the most recent data (i.e. as of either December 2012 or June 2013).
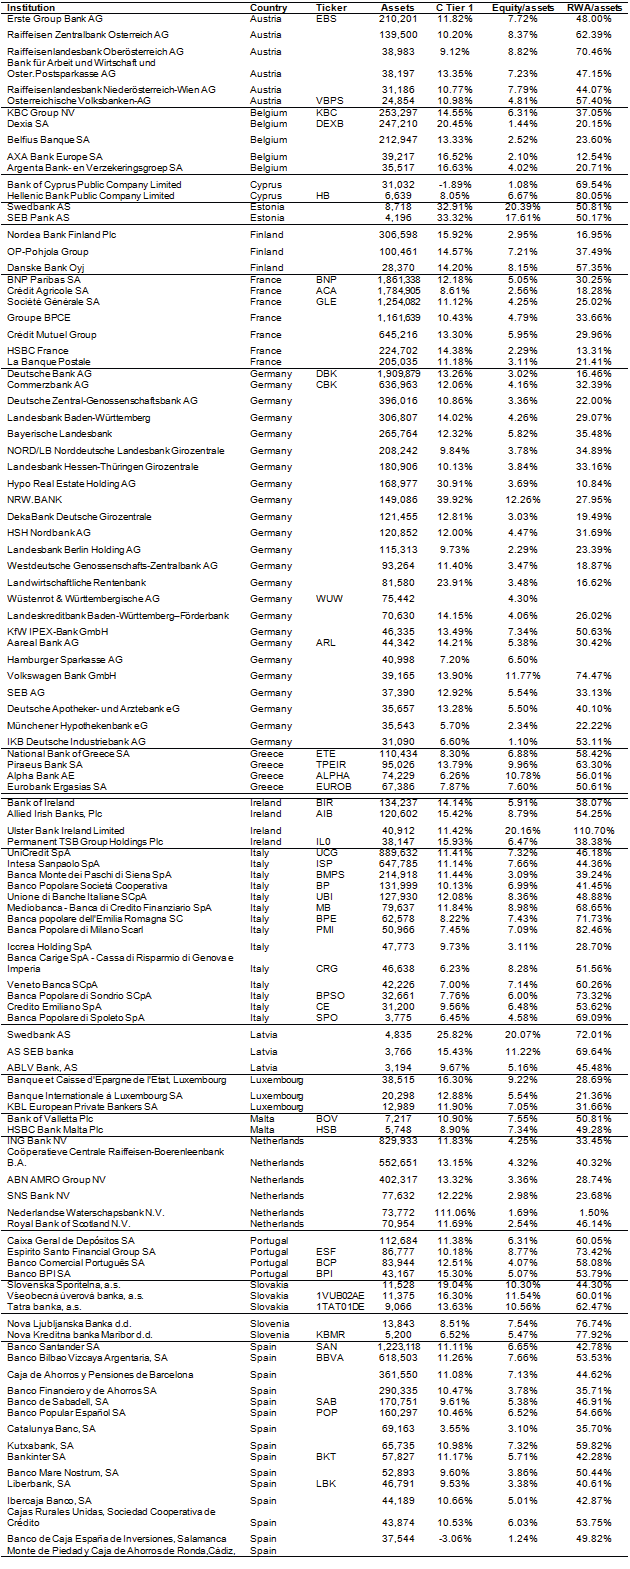
Table 1 shows that the banks in our stress tests have €22.9 trillion in total assets. Table 1 also provides an overview of all banks at the country level, showing mean regulatory capital ratios and bank characteristics. There is substantial cross-sectional heterogeneity in terms of risk-weighted assets among European banks, ranging from 24.5% of total assets (France) to more than 77% (Slovenia), with Deutsche Bank AG (the largest bank in the stress test) reporting that almost 84% of its assets are ‘riskless’ (Table 2 and Annex I). Further, the average market-to-book ratio of 0.66 suggests that the market is heavily discounting banks’ asset portfolios (Table 3), at least in part due to the relatively high risk of some of the ‘riskless’ assets relative to the markdowns taken by banks on these assets against their book equity values.
Table 1. Descriptive statistics
Notes: This table reports descriptive statistics of the banks included in the Asset Quality Review (AQR) conducted by the ECB in 2014 (data are available for 109 out of the 128 banks included in the AQR). C Tier 1 is the Common Tier 1 ratio and is Common Tier 1 capital divided by risk-weighted assets (RWA). Equity/assets is book equity over total assets. IFRS Tier 1 LVG is C Tier 1 capital divided by total assets minus intangible assets minus derivative liabilities. Tangible equity/tangible assets is defined as book equity minus intangible assets divided by total assets minus intangible assets. RWA/assets is RWA divided by total assets. Net impaired loans/C Tier 1 capital is the amount of impaired loans net of reserves over Common Tier 1 capital. Assets are total assets and measured in millions of euros. Banks are the number of banks per country that are included in the AQR and for which data are available. Data are from H1 2013 if available or EOY 2012.
Table 2. Capital shortfall using unstressed book capital measures
Notes: This table reports the banks’ capital shortfall using unstressed capital shortfall measures. The 8% C Tier 1 threshold is used in the AQR. We assume a benchmark capital ratio for other book measures of leverage of 3%. C Tier 1 is the Common Tier 1 ratio and is Common Tier 1 capital over risk-weighted assets (RWA). Equity/assets is book equity divided by total assets. Tangible equity/tangible assets is book equity minus intangible assets divided by total assets minus intangible assets. IFRS Tier 1 LVG is C Tier 1 capital divided by total assets minus intangible assets minus derivative liabilities. Assets are total assets and measured in millions of euros. Shortfalls are reported in millions of euros and are summed over all banks in each country.
Table 3. Descriptive statistics: market capitalisation
Notes: This table reports summary statistics of market based measures of capitalisation on a country level. MES is the co-movement of the banks’ stock return with the market index in a financial crisis over a one-day period. Variance is the daily variance of the equity return. Beta is the beta of the firm with respect to the MSCI World Index. Correlation is correlation of the firm with respect to the MSCI World Index. Market-to-book is market value over book value of equity as of 30 June 2013. Market equity/assets is a market leverage ratio, defined as market equity divided by asset minus book equity plus market equity. Assets are total assets and measured in millions of euros. Market cap is the market value of equity on 30 June 2013 measured in millions of euros. Banks are the number of public banks in each country.
Unstressed capital shortfall measures
The four book capital ratios we employ are: (1) Core Tier 1 ratio (C Tier 1), which is core Tier 1 capital divided by risk-weighted assets (RWA); (2) book equity divided by total assets (equity/assets); (3) tangible equity/tangible assets, which is book equity less intangible assets divided by total assets less intangibles assets; and (4) the International Financial Reporting Standards (IFRS) Tier 1 LVG ratio, which is C Tier 1 capital divided by tangible assets minus derivative liabilities.3
Our unstressed measures calculate the capital shortfall as the gap between the current book capital measure and certain thresholds: (1) the C Tier 1 ratio relative to an 8% threshold as in the AQR;4 (2) the equity/asset ratio relative to a 3% threshold; (3) the tangible equity/tangible asset ratio relative to a 3% threshold; and (4) the IFRS Tier 1 LVG ratio relative to a 3% threshold. These measures are unstressed in that they are capital requirements without accounting for potential losses in future stress scenarios.
Using the four book capital measures and the unstressed thresholds mentioned above, we identify a capital shortfall of between €7.5 billion (using the C Tier 1 ratio and the AQR 8% threshold) and €66.8 billion (using the tangible equity/tangible asset ratio and a 3% threshold) even in the unstressed case (Table 2).
Stressed capital shortfall measures
To account for potential losses in future stress scenarios, we employ four stressed capital shortfall measures. The first two measures raise the level of capital requirements, while the remaining two measures (also) account for losses:
1. Book capital shortfall: Using book values of equity and assets, the less stringent benchmark is a leverage ratio (book equity/assets) of 4% and the more stringent benchmark is a 7% leverage ratio. Haldane (2012) reports that a 4% capital ratio (7% for the largest financial institutions) would have been necessary to guard against bank failure during the recent financial crisis.
2. Market capital shortfall: Similarly, using the market value of equity and assets, the less stringent benchmark is a leverage ratio (market equity/assets) of 4% and the more stringent benchmark is a 7% leverage ratio.
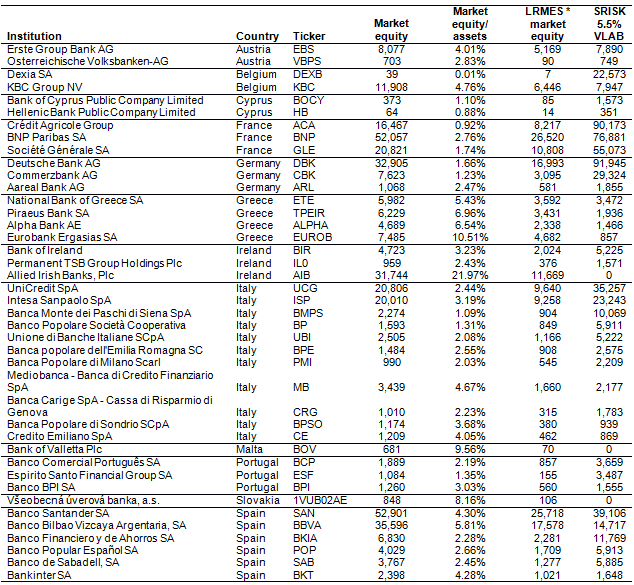
SRISK or capital shortfall in a systemic crisis: We assume a systemic financial crisis with a global stock-market decline of 40%. SRISK 5.5% VLAB is our measure for a bank’s capital shortfall in this scenario, assuming a 5.5% prudential capital ratio with losses estimated using the VLAB methodology to estimate the downside risk of bank stock returns. While this scenario and the resulting SRISK measure uses market data and market equity (instead of book equity) in determining leverage, the approach is conceptually similar to that of the EU stress tests, which is to estimate losses in a stress scenario and determine the capital shortfall between a prudential capital requirement and the remaining equity after losses.
3. Capital shortfall after write-down: We assume that banks have to write down their entire non-performing loan portfolio net of reserves during a severe financial crisis. We account for this write-down when calculating the capital shortfall of the banks using our four book capital measures (which are adjusted for the write-downs) and comparing them to a threshold of 4%. This shortfall measure is motivated by theory that suggests that under-capitalised banks continue to provide funding to unhealthy borrowers to prevent a write-down of their loans (‘zombie lending’) and that a forced write-down can ameliorate the zombie lending problem.
Main results of stressed capital shortfall estimates
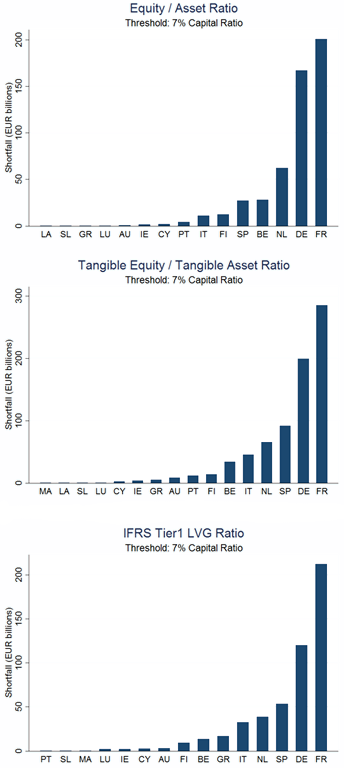
1. The book capital shortfall estimates indicate a capital shortfall for all banks of between €82 billion and €176 billion (4% benchmark capital ratio) or between €509 billion and €767 billion (7% capital ratio – see Table 4 and Figure 1).
Table 4. Book capital shortfall
Notes: This table reports the banks’ capital shortfall under stressed book capital measures. We assume a benchmark capital ratio for other book measures of leverage of 4% as well as 7%. C Tier 1 is the Common Tier 1 ratio and defined as Common Tier 1 capital over risk-weighted assets (RWA). Equity/assets is book equity divided by total assets. Tangible equity/tangible assets is book equity minus intangible assets divided by total assets minus intangible assets. IFRS Tier 1 LVG is C Tier 1 capital divided by total assets minus intangible assets minus derivative liabilities. Assets are total assets and measured in millions of euros. Shortfalls are reported in millions of euros and are summed over all banks in each country.
Figure 1. Capital shortfall using stressed book capital measures
Notes: This figure shows the banks’ capital shortfall using stressed book capital measures of 7%. Equity/assets is book equity over total assets. IFRS Tier 1 LVG is C Tier 1 Capital divided by total assets minus intangible assets minus derivative liabilities. Tangible equity/tangible assets is defined as book equity minus intangible assets divided by total assets minus intangible assets. Shortfalls are reported in millions of euros and are summed over all banks in each country. Countries with zero shortfall under the respective measure are omitted.
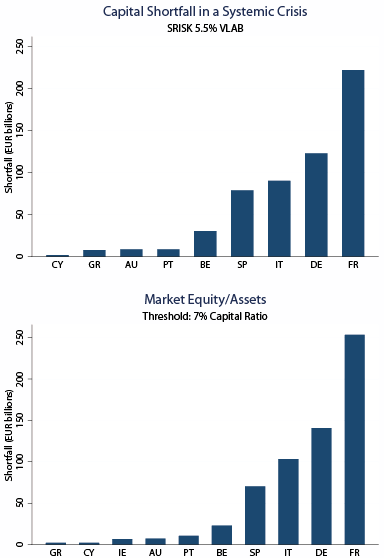
2. The market capital shortfall estimates indicate a capital shortfall of €230 billion (4% benchmark capital ratio) or €620 billion (7% capital ratio) for the 41 publicly listed banks (Table 5 and Figure 2).
Table 5. Book capital vs. market capital based measures
Notes: This table reports the banks’ capital shortfall using stressed book and market measures. Equity/assets is book equity over total assets. Market equity/assets is a market leverage ratio, defined as market equity over asset minus book equity plus market equity. The less stringent benchmark is a leverage ratio of 4%, and the more stringent benchmark is a 7% ratio. For comparison, we report the shortfall using the unstressed capital ratios (equity/assets and market equity/assets) of 3%. Shortfalls are reported in millions of euros and are summed over all banks in each country.
Figure 2. Capital shortfall using stressed market capital measures
Notes: This figure shows the banks’ capital shortfall using two stressed market based measures: (1) SRISK is the shortfall in case of an aggregate market decline of 40% assuming a prudential capital ratio of 5.5%; (2) The second measure is a market leverage ratio (market equity/assets) and a threshold of 7%. Market equity/assets is market equity divided by asset minus book equity plus market equity. Countries with zero shortfall under the respective measure are omitted.
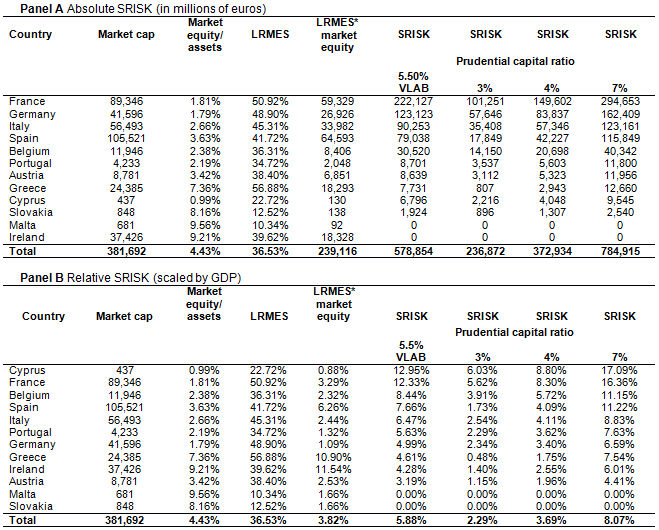
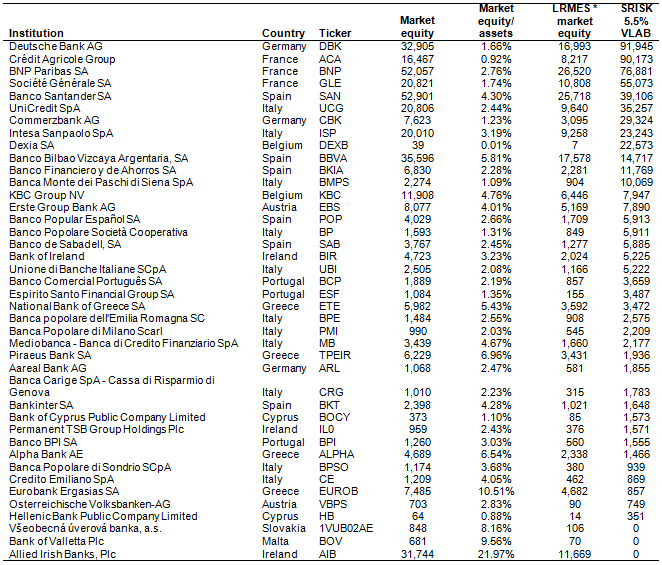
3. Estimates of SRISK or the capital shortfall in a systemic financial crisis (40% market decline over a six-month period) is €579 billion; 41% is due to downside correlation with the market, while 59% is due to the leverage of these institutions (Table 6).
Table 6. SRISK or capital shortfall in a systemic crisis
Notes: This table reports European banks’ capital shortfall if there is a systemic crisis (defined as a 40% drop in the market index over a six-month period). Market equity is the total market capitalisation of publicly listed AQR banks as of 30 June 2013 in millions of euros. Market equity/total assets is market capitalisation over total assets. LRMES is the long-run marginal expected shortfall, which is the percentage loss in market capitalisation in a systemic crisis over a 6-month period. LRMES*market equity is the absolute market value loss in a systemic financial crisis in millions of euros. SRISK is the expected shortfall of a bank in a systemic crisis over a six-month period considering both LRMES and LVG. SRISK 5.5% VLAB is SRISK calculated assuming a 5.5% prudential capital ratio (which is the measure available on the NYU Stern Volatility Lab website). SRISK 3%, 4%, 7% are capital shortfall estimates in a systemic crisis under different prudential capital ratio assumptions. Panel A reports the absolute shortfalls in millions of euros for each country sorted by the largest absolute SRISK 5.5% VLAB value (in bold). Panel B reports the shortfalls scaled by each country’s GDP and sorted by the highest relative SRISK.
4. Capital shortfall estimates when writing down their net non-performing loan portfolios range from €232 billion (using the C Tier 1 ratio and an 8% threshold as in the AQR) and €435 billion (using the tangible equity/tangible assets ratio and a 4% threshold – see Table 7).
Table 7. Write-down of non-performing loan portfolio
Notes: This table reports the banks’ capital shortfall assuming that banks need to write down their net impaired loans. The 8% C Tier 1 scenario as used in the AQR remains unchanged. C Tier 1 is the Common Tier 1 ratio and defined as Common Tier 1 capital over risk-weighted assets (RWA). Equity/assets is book equity over total assets. Tangible equity/tangible assets is defined as book equity minus intangible assets over total assets minus intangible assets. IFRS Tier 1 LVG is C Tier 1 capital over total assets minus intangible assets minus derivative liabilities. We assume a capital threshold of 4% for the equity/assets, tangible equity/assets, and IFRS Tier 1 LVG ratios. Shortfalls are reported in millions of euros and are summed over all banks in each country.
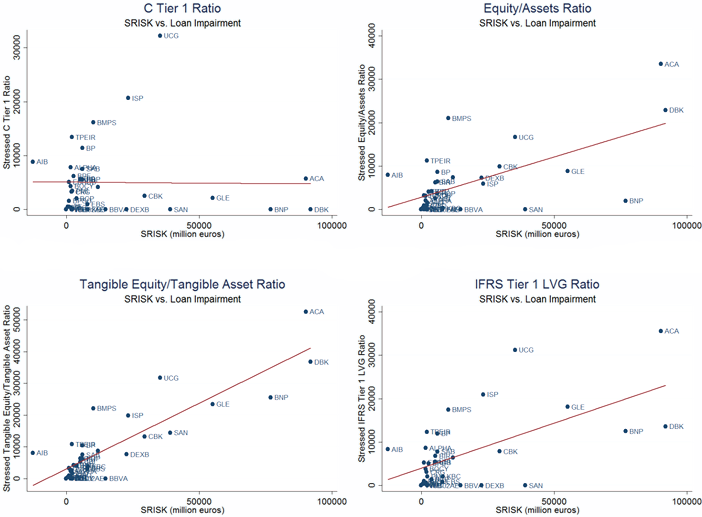
5. There is a high rank correlation between the shortfalls based on book and market capital ratio measures. However, we find no significant correlation between shortfalls calculated using regulatory (i.e. risk-weighted asset-based) capital ratios and shortfalls calculated under market or book capital ratios. Similar to Acharya et al. (2013), this highlights how flawed risk-weighted asset-based measures can be (Table 8 and Figure 3). This is a significant operational risk in that even a well-intentioned AQR can underestimate the true capital shortfall of the banking sector by not addressing the problem of static and out-of-date risk weights, especially for risky sovereign bonds.
Table 8. Rank-correlation
Notes: This table reports the rank-correlation between the shortfalls based on book and market capital ratio measures. Panel A reports the results computing the rank-correlation between the capital shortfall under stressed book capital measures using a 7% threshold and SRISK. Panel B reports the results computing the rank-correlation between the shortfalls after write-down of the non-performing loan portfolios and SRISK. Panel C reports the results computing the rank-correlation between the shortfalls using a stressed book capital measure of 7% (‘7% Capital Ratio’) and assuming that banks need to write down their net impaired loans and a 4% target capital threshold of 4% (‘Impaired Loans’). ** and * indicate significance levels at 1% and 5%, respectively.
Figure 3. Correlation of capital shortfalls
Notes: This figure shows the correlation of banks’ capital shortfall assuming that banks need to write down their net non-performing loans (‘loan impairment’) and SRISK. C Tier 1 is the Common Tier 1 ratio and defined as Common Tier 1 capital over risk-weighted assets (RWA). Equity/assets is book equity over total assets. IFRS Tier 1 LVG is C Tier 1 capital divided by total assets minus intangible assets minus derivative liabilities. Tangible equity/tangible assets is book equity minus intangible assets divided by total assets minus intangible assets. SRISK is the shortfall in case of an aggregate market decline of 40% assuming a prudential capital ratio of 5.5%. Shortfalls are reported in millions of euros and are summed over all banks in each country.
6. Cross-country variation in our capital shortfall estimates indicate that:
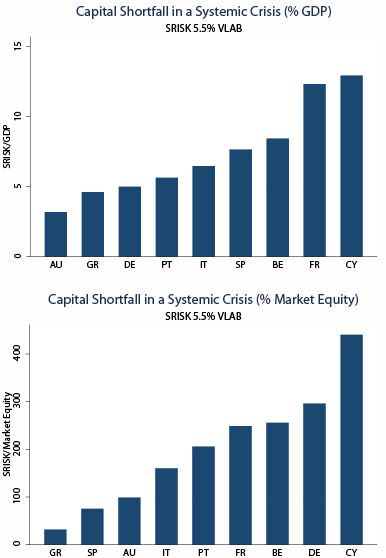
a. French banks are leading each book and market capital shortfall measure, both in absolute euro amounts and relative to national GDP. The capital shortfall ranges from €31 billion (using the equity/asset ratio and a 4% threshold) to €285 billion (using the tangible equity/tangible asset ratio and a 7% threshold – see Table 3). The SRISK stress scenario suggests a shortfall of €222 billion, which corresponds to almost 13% of the country’s GDP (Table 6).
b. German banks are close seconds, although they benefit from a stronger domestic economy with a higher GDP and a greater capacity for public backstops (Table 6 and Figure 4).
c. Spanish and Italian banks appear to have large capital shortfalls when non-performing assets are fully written down. Both countries account for about a third of the total shortfall after write-downs (Table 7). Market-based measures such as SRISK amount to about 6.5%–7.6% of the GDP of both countries (Table 6).
Figure 4. Capital shortfall using stressed market capital measures (scaled by GDP and market equity)
Notes: This figure shows the banks’ capital shortfall using stressed market-based measures. SRISK is the shortfall in case of an aggregate market decline of 40%, assuming a prudential capital ratio of 5.5%. The shortfall is scaled by the country’s GDP and the banks’ total capitalisation. Countries with zero shortfall under the respective measure are omitted.
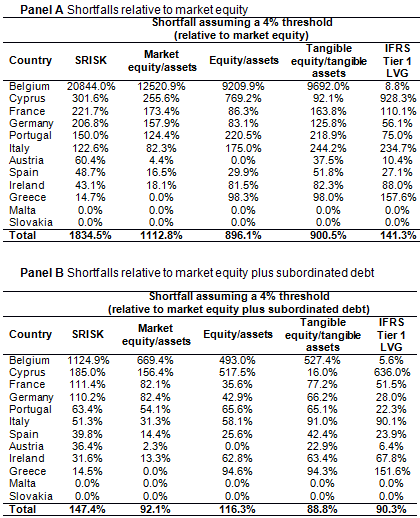
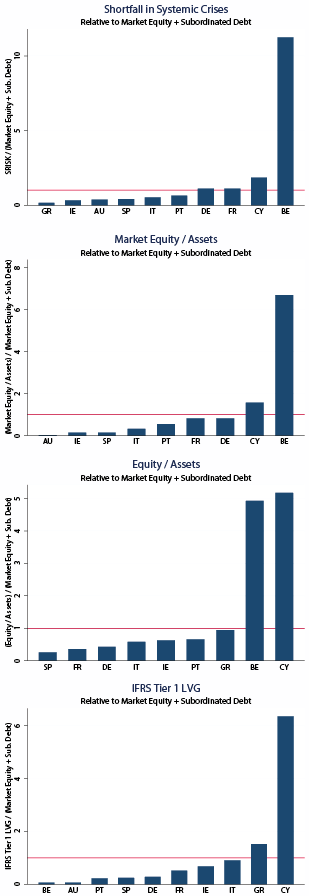
7. The capital shortfalls are large as a multiple of the banks’ market value of equity. In particular, assuming a 4% stressed capital ratio and impairment of the non-performing loan portfolio (Table 9), they range from multiples of 1.4 (IFRS Tier 1 LVG ratio) to 18.2 (SRISK). The market value of equity reflects the maximum amount of capital a bank can raise today in private markets based on the current market valuation of the firm. If we add subordinated debt as the next group of creditors that is going to be bailed in, the shortfalls as a multiple of the banks’ market value of equity and subordinated debt (Table 9 and Figure 5) still range from 0.9 (IFRS Tier 1 LVG ratio) to 1.5 (SRISK).
a. Banks in Belgium, Cyprus, and Greece are leading the group of banks with the largest capital shortfall estimates, with shortfalls as a multiple of the banks’ market value of equity and subordinated debt up to 11 (Belgium, SRISK).
b. France and Germany are among the five countries with the largest capital shortfall estimates for their banks. The shortfall estimates as a multiple of the banks’ market value of equity and subordinated debt range from 0.3 (Germany, IFRS Tier 1 LVG ratio) to 1.1 (France, SRISK).
c. Capital shortfalls for Italian and Spanish banks as a multiple of the banks’ market value of equity and subordinated debt range from 0.1 for Spain (market equity/assets) to 0.91 for Italy (tangible equity/tangible assets).
Table 9. Shortfall and bail-ins
Notes: This table reports the banks’ capital shortfall relative to market equity (Panel A) and market equity plus subordinated debt (Panel B) assuming that banks need to write down their net impaired loans and a 4% capital threshold for each measure. SRISK is the shortfall in case of an aggregate market decline of 40% assuming a prudential capital ratio of 4%. Market equity/assets is defined as market equity over asset minus book equity plus market equity. Equity/assets is book equity over total assets. Tangible equity/tangible assets is defined as book equity minus intangible assets over total assets minus intangible assets. IFRS Tier 1 LVG is C Tier 1 capital over total assets minus intangible assets minus derivative liabilities.
Figure 5. Shortfalls relative to market equity and subordinated debt
Notes: This figure shows the banks’ capital shortfall relative to market equity plus subordinated debt (including hybrid capital) using stressed book-and market-based measures and incorporating a full write-down of the non-performing loan portfolios. For all measures, we assume a 4% target capital threshold. SRISK is the shortfall in case of an aggregate market decline of 40% assuming a prudential capital ratio of 4%. Market equity/assets is market equity divided by asset minus book equity plus market equity. Equity/assets is book equity divided by total assets. IFRS Tier 1 LVG is C Tier 1 capital divided by total assets minus intangible assets minus derivative liabilities. Countries with no capital shortfall are omitted.
Implications
As portfolio (micro-level) data of banks’ individual exposures is not publicly available, our estimates of capital shortfalls employ publicly available book capital and market data, and are motivated by empirical evidence and theory. We believe these estimates provide an interesting benchmark against which the AQR stress tests should be evaluated.
Our results suggest that with common equity issuance (e.g. through deep-discount rights issues) and haircuts on subordinated creditors (e.g. through bail-ins), it should be possible to deal with many banks’ capital needs. Some will, however, require public backstops, especially if bail-ins are difficult to implement without imposing losses on bondholders, who may themselves be other banks and systemically important financial institutions. The banking sectors in Belgium, Cyprus, and Greece seem likely to require backstops.
Our results also suggest large shortfalls in core European countries such as France and Germany – Germany has many government-owned institutions that may require capital issuances and/or bail-ins. Interestingly, market measures of equity imply significantly greater capital shortfalls for France and Germany than book measures do. Moreover, while Italy’s capital shortfalls are much higher relative to the market value of equity than Spain’s, the two look similar when allowing for bail-ins on subordinated debt, due to the greater subordinated bond holdings of Italian banks.
National governments might be inclined to influence the design of the AQR to prevent these banks from being singled out in the stress tests. This raises the difficult question of whether the AQR will eventually live up to expectations and restore confidence and creditability in the ECB as a single supervisor. Objective capital shortfall estimates such as ours can provide a valuable defence mechanism against any such political efforts to blunt the effectiveness of the proposed AQR and the intended recapitalisation of the Eurozone banking system.
Note that on 18 December 2013, EU finance ministers agreed to set up a common resolution fund of €55 billion financed through contributions of banks. This fund becomes fully operational after 10 years, and is supposed to pay for the restructuring or resolution of failing banks after bank shareholders and creditors have been bailed in. Our results suggest that these funds might be insufficient in a severe financial crisis, and public backstops (e.g. through the European Stability Mechanism) might still be necessary.
References
Acharya V, L Pedersen, L Philippon, and M Richardson (2010), “Measuring Systemic Risk”, Working Paper, NYU Stern School of Business.
Acharya V, R Engle, and M Richardson (2012), “Capital Shortfall: A New Approach to Ranking and Regulating Systemic Risks”, American Economic Review Papers & Proceedings, 102(3): 59–64.
Acharya V, R Engle, and D Pierret (2013), “Testing Macro-prudential Stress Tests: The Risk of Regulatory Risk Weights”, Working Paper, NYU Stern School of Business.
Acharya, V and S Steffen (2013), “The ‘Greatest’ Carry Trade Ever? Understanding Eurozone Bank Risks”, Working Paper, NYU Stern School of Business.
Beck, T (2013), “Banking union for Europe – where do we stand?”, VoxEU.org, 23 October.
Brownlees, C and R Engle (2013), “Volatility, Correlation and Tails for Systemic Risk Measurement”, Working Paper, NYU Stern School of Business.
Haldane, A (2012), “The Dog and the Frisbee”, Bank of England speech, 31 August.
Annex I
Annex II: Correlation of capital shortfalls (by banks)
Notes: This figure shows the correlation of banks’ capital shortfall assuming that banks need to write down their net non-performing loans (‘Loan Impairment’) and SRISK. C Tier 1 is the Common Tier 1 ratio and defined as Common Tier 1 capital over risk-weighted assets (RWA). Equity/assets is book equity divided by total assets. IFRS Tier 1 LVG is C Tier 1 capital divided by total assets minus intangible assets minus derivative liabilities. Tangible equity/tangible assets is book equity minus intangible assets divided by total assets minus intangible assets. Shortfalls are reported for each publicly listed bank.
Annex III
Note: This table is a ranking of the public banks in each country sorted by their systemic expected capital shortfall.
Annex IV
Note: This table is a ranking of the public banks sorted by their systemic expected capital shortfall.
1 The AQR is done jointly with a stress test and a supervisory assessment. For brevity, we simply use the abbreviation AQR in our analysis.
2 A list of these banks is provided in Annex I.
3 This ratio accounts for the fact that IFRS (in contrast to the generally accepted accounting principles or GAAP in the US) does not allow netting of derivative securities. This measure of assets is thus most comparable to US financial institutions.
4 The AQR threshold of 8% is comprised of a 4.5% core Tier 1 ratio, a 2.5% capital conservation buffer, and a 1% surcharge at systemically relevant institutions.


