The global pandemic has led to job loss of catastrophic proportions in the United States. From February to April of this year, employment fell by 21 million, or more than 13%. In May, a small recovery occurred, and observers are reasonably confident that the recovery will continue, at least until a possible second round of the pandemic occurs. How will the labour market recover from job loss of such an unprecedented magnitude? We have been studying data from the labour market during recoveries from past recessions, along with the most recent data from the current recovery, to address this important question.
The business cycle involves variations in aggregate slack, and the best measure of slack is the unemployment rate (Romer and Romer 2019). A well-documented property of the unemployment rate – most recently confirmed by Dupraz et al. (2019) – is that unemployment rises rapidly in response to a significant aggregate adverse shock and then gradually recovers, until the next recessionary shock hits, or the unemployment rate reaches about 3.5% of the labour force.
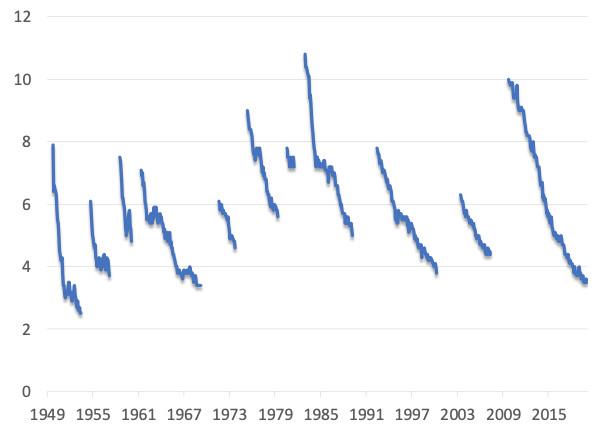
In a recent paper (Hall and Kudlyak 2020), we study data from the labour market during recoveries from the recessions over past 70 years. It is a remarkable fact about the historical US business cycle that, after unemployment reached its peak in a recession and a recovery began, the annual reduction in the unemployment rate was stable at around 0.85 percentage points per year. The economy seems to have had an irresistible force toward restoring full employment.
Uniform near-linear unemployment recovery across recessions
Figure 1 depicts the change of the unemployment rate for individual recoveries, in percentage points. The blue bar shows the annual rate of decline in percentage points of unemployment and the red bar shows the total percentage-point decline during the recovery. The height of the blue bars was lower than earlier for the recoveries beginning in 1992 and 2003, but the annual rate was second highest of all recoveries in the recovery that just ended; and the total recovery from 2010 to 2020 was the greatest over the 70-year history. The uniformity of the annual rates of recovery in this figure is striking.
Figure 1 Average annual rates of decline in unemployment in percentage points, by recovery, and total decline during each recovery
Figure 2 shows the unemployment rate with the recession spells left blank. Our two observations about recoveries are apparent in the data: unemployment declines smoothly but slowly throughout most recoveries most of the time; and unemployment declines along a straight line, not one that curves upward. The actual path is close to linear.
Figure 2 The paths of unemployment during recoveries
Spike in job loss in recessions does not fully account for subsequent lingering unemployment
We document substantial but short-lived spikes of job loss in recessions using four measures of job loss: (1) layoffs from the Job Openings and Labor Turnover Survey, which represent employer-initiated termination of a worker without prejudice, typically because continuing employment has become unprofitable; (2) job destruction in the Business Dynamics Statistics data, which is defined as the sum of all establishment-level reductions in employment (Davis et al. 2013); (3) worker displacement from the Current Population Survey (CPS) Displaced Worker Supplement, which measures job loss among workers with at least three years of tenure at the lost job; and (4) unemployment insurance claims.
We then examine the relationship between the magnitude of the increase in unemployment following a recession shock and the measures of job loss. We conclude, from data on displaced workers collected every two years in the CPS, that the number of workers displaced even in the severe recession starting in 2007 was not enough to explain the volume of excess unemployment present in the US economy during the period from 2009 through 2014. Something happened in the labour market during that period that caused elevated unemployment among workers who were not displaced around 2009.
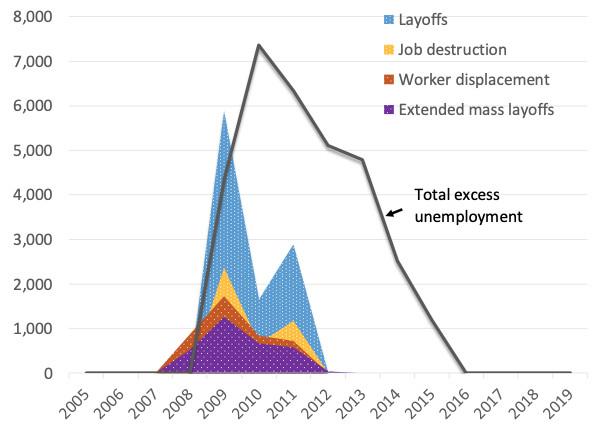
Figure 3 shows that the spike in layoffs more than fully accounts for the spike in unemployment in 2009 but cannot account for all of the excess unemployment afterwards. That is, the excess job loss accounts for the magnitude of the initial increase in unemployment, but not its persistence. The persistence is too large to be explained as reflecting only the personal experiences of the extra job-losers dating from the spike. The direct channel is only part of the story of persistent high unemployment after the crisis.
Figure 3 Unemployment from excess job loss in 2009 and total excess unemployment, by four measures of job loss (in thousands of workers)
Unemployment as a reduction on labour supply
We examine the puzzles of low recovery speed and linear recovery paths in the framework of the Diamond-Mortensen-Pissarides (DMP) model. Our view of the labour market has points in common with Pries (2004) and can be seen as responding to the challenge of Cole and Rogerson (1999) to explain how aggregate unemployment recovers much more slowly than does an individual spell of unemployment.
A typical recession shock permanently destroys firm-worker relationships. The ensuing reemployment process involves multiple short-term employment spells before the unemployed find new permanent jobs. We calculate the effective exit rate from unemployment, which is lower than the individual exit rate from unemployment spells from one month to the next. Those individual exits are frequently temporary departures from the labour force or short-term jobs, and are then followed by additional spells of unemployment, as described in an earlier paper of ours (Hall and Kudlyak 2019).
Observations about the current recovery
We believe our findings are relevant for the recovery that is expected to follow the deep recession triggered by the Covid-19 pandemic, but we do not try to predict how the recovery will evolve. In particular, our work should not be interpreted as a forecast that unemployment will decline as slowly in the coming recovery as it has in past recoveries. Our work is complementary to that of Gregory et al. (2020) in this respect.
A major difference between the current and past recessions is that the overwhelming majority of currently unemployed workers anticipate being recalled to jobs from which they have been temporarily laid off, within the coming six months (Kudlyak and Wolcott 2020). We perceive two polar outcomes resulting from the unusual preponderance of workers on temporary layoff.
In the best outcome, their expectations about recall are fulfilled. They return to their existing jobs rapidly without sacrificing their job-specific human capital (Fujita and Moscarini 2017). Only a small fraction of the large number of people laid off from the pandemic actually enter traditional unemployment. Their unemployment declines at around one percentage point per year, but that results in the correction of the relatively small bulge of non-temporary-layoff unemployment over only a few years.
In the worst outcome, the majority of workers currently on temporary layoff fail to be recalled and therefore become unemployed in the traditional sense. They undergo the same time-consuming process of searching for work, taking short-term jobs, and experiencing spells out of the labour market, that we have described in our work on the slow recovery of unemployment after the recessions from 1948 through 2009. The implications of this outcome are alarming: The US unemployment rate is currently about 14%, say 9 percentage points above normal. It would take 11 years (9 divided by 0.85) to work off the pandemic’s bulge of unemployment as it currently stands.
The coming months will teach us a lot about where the US economy stands between these two polar outcomes. Most observers believe that unemployment will decline in coming months by at least one percentage point per month, or at an annual rate of 12 percentage points per year, far above the historical recovery rate. One study, by Barrero et al. (2020), is pessimistic about the likelihood of successful recalls for a large fraction of those currently on temporary layoff. On the other hand, in the Current Population Survey, between April and May, only a small fraction of those on temporary layoff reported a change to traditional unemployment. Petrosky-Nadeau and Valetta (2020) investigate a number of differences between unemployment dynamics in the pandemic recession and prior recessions.
Conclusions
Our research concludes that the economy has a strong internal force toward recovery. Remarkably consistent recoveries have occurred in the US after every recessionary shock that caused a spike in unemployment. We make the case that the internal force originates in the labour market. Historically, the force has delivered only modest annual declines of unemployment. We have reasons to believe that the recovery from the pandemic shock will be more rapid, because unemployment contains a much larger fraction of workers on temporary layoff than in previous recoveries. But there is a great deal of uncertainty about the forthcoming recovery rate.
Authors’ note: Opinions expressed are the views of the authors and not those of the Federal Reserve Bank of San Francisco, the Federal Reserve Board, or any other institution with which the authors are affiliated.
References
Barrero, J M, N Bloom, and S J Davis (2020), “COVID-19 Is Also a Reallocation Shock”, Becker Friedman Institute Working Paper No. 2020-59.
Cole, H L and R Rogerson (1999), “Can the Mortensen-Pissarides Matching Model Match the Business-Cycle Facts?", International Economic Review 40(4): 933-959.
Davis, S J, R J Faberman, and J C Haltiwanger (2013), “The Establishment-Level Behavior of Vacancies and Hiring,” Quarterly Journal of Economics 128(2): 581-622.
Dupraz, S, E Nakamura, and J Steinsson (2019), “A Plucking Model of Business Cycles,” NBER Working Paper No. 26351.
Gregory, V, G Menzio, and D G Wiczer (2020), “Pandemic Recession: L or V-Shaped?”, NBER Working Paper No. 27105.
Fujita, S, and G Moscarini (2017), “Recall and Unemployment," American Economic Review 107(12): 3875-3916.
Hall, R E and M Kudlyak (2019), “Job-Finding and Job-Losing: A Comprehensive Model of Heterogeneous Individual Labor-Market Dynamics," Federal Reserve Board of San Francisco Working Paper No. 19-05.
Hall, R E and M Kudlyak (2020), “Why Has the US Economy Recovered So Consistently from Every Recession in the Past 70 Years?”, Federal Reserve Board of San Francisco Working Paper No. 20-20.
Kudlyak, M, and E Wolcott (2020), “Pandemic Layoffs,” Middlebury College.
Petrosky-Nadeau, N, and R G Valletta (2020), “Unemployment Paths in a Pandemic Economy”, Federal Reserve Board of San Francisco Working Paper No. 20-18
Pries, M J (2004), “Persistence of Employment Fluctuations: A Model of Recurring Job Loss," Review of Economic Studies 71(1): 193-215.
Romer, C D and D H Romer (2019), “NBER Business Cycle Dating: History and Prospect,” University of California, Berkeley.


