To analyse labour market matching across the EU we have drawn empirical Beveridge curves in the vacancy-unemployment space over a relatively long time span. We used a number of sources to compile long series of quarterly vacancy rates for EU countries.1 Demand shocks are expected to translate mostly as movements along a stable downward sloping relationship between unemployment and vacancies, while structural shifts in the efficiency of the matching process or in the rate at which jobs are being destroyed would imply persistent shifts of this downward-sloping curve.
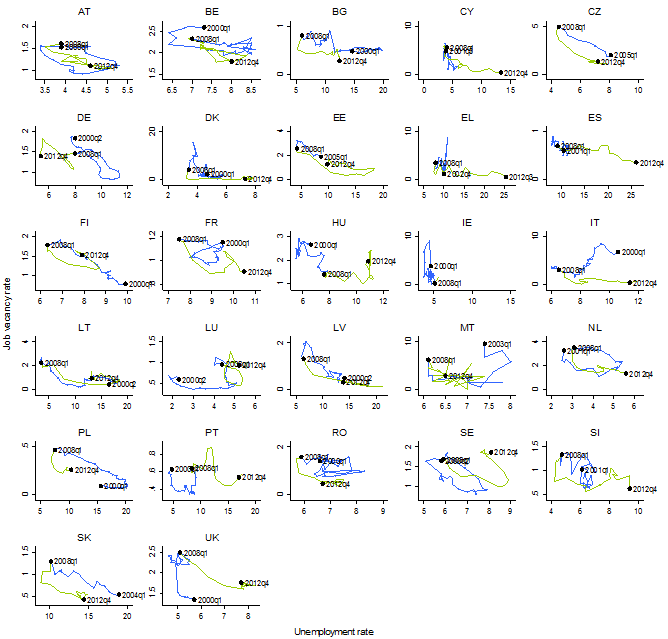
Figure 1 shows that after the 2008 recession, unemployment rose and vacancies fell in most EU countries, consistent with the occurrence of a major negative demand shock. The incipient recovery at the end of 2009 was accompanied by a rise in vacancies in most countries, while unemployment reacted little and with usual lags. A second major demand shock took place in mid-2011 and concerned only countries under the strain of debt crises and severe deleveraging needs. In these countries, unemployment further rose and vacancies fell along a Beveridge curve that was shifted outward compared to the beginning of the crisis. Starting from mid-2013, there are timid signs of a recovery in vacancies in some countries.
Figure 1. Empirical Beveridge curves for EU countries
(1) The job vacancy rate is the ratio between vacant posts reported and the total number of posts (vacant and occupied).
(2) See European Commission 2013 for details on the construction of the vacancies. For Italy, Denmark and Malta, data refer to ECFIN survey indicator "Factors limiting production: labour".
(3) The vacancy series of Spain has been adjusted for a change in methodology.
Source: Own calculations based on Eurostat and OECD data.
Despite these common movements, there is a great deal of heterogeneity in Beveridge curve dynamics across the EU. While the evidence points to a neat outward shift after the crisis in a number of countries, notably those concerned by current account reversals and debt crises (e.g., Greece, Portugal, Spain), in other countries the evidence suggests an inward shift of the Beveridge curve (e.g., Germany) or the typical counter-clockwise loop in the vacancy-unemployment space observed after demand shocks (in countries like Sweden or Estonia; see Blanchard and Diamond 1989).
Outward shifts in Beveridge curves are not sufficient to identify a permanent decline in the efficiency of labour-market matching, because such shifts could be temporary, and linked to the relatively slow adjustment of unemployment to changes in labour demand. To better gauge persistent changes in the degree of efficiency of the labour-market matching process, we constructed indicators of matching efficiency by purging data on job finding rates from cyclical variations.2 Job finding rates were constructed following the methodology described in Arpaia and Curci (2011). The cyclical component of job finding rates was computed separately for each country via the estimation of the elasticity of job finding rates with respect to labour-market tightness (i.e., the ratio of the vacancy on the unemployment rate) over the pre-crisis period. A time-varying estimation of matching efficiency was obtained by adding the additional requirement of stable unemployment, i.e., that the labour market lies on the Beveridge curve.3
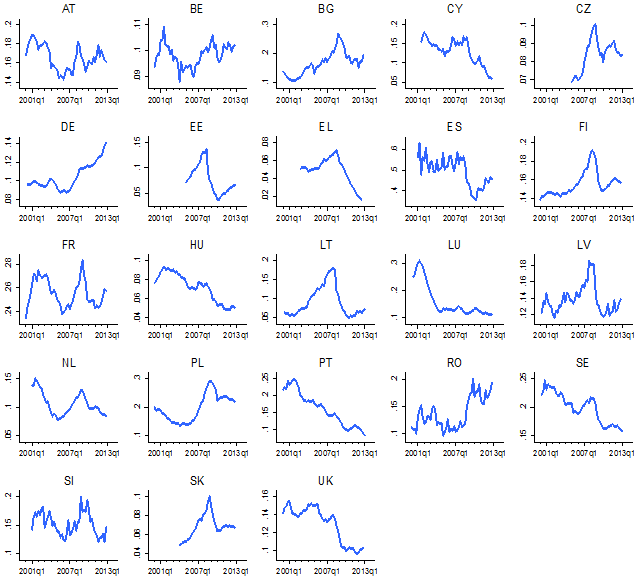
Figure 2 shows that while matching efficiency remained relatively stable before the crisis, a major drop in matching efficiency was recorded in 2009 in most countries. Unsurprisingly, matching efficiency has been falling mostly in the countries that witnessed a marked outward shift in the Beveridge curve, although some signs of stabilisation or even recovery are visible by 2013Q1, notably in most Eastern EU countries, France, Finland, UK, Spain.
Figure 2. Matching efficiency estimates
Source: European Commission 2013.
At the roots of mismatch
What factors can explain the observed dynamics of matching efficiency? To shed light on this issue we constructed indicators of mismatch across three dimensions: skill, industry, regions.4 We used these indicators of mismatch, together with other explanatory variables (the incidence of long-term unemployment, and spending on Active Labour Market Policy per jobseeker relative to per capita income) to explain the evolution of matching efficiency across the panel of available EU countries.
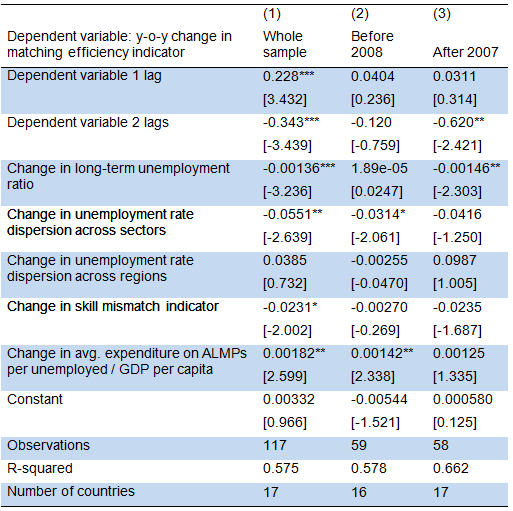
Regression analysis across a sample of EU countries identifies a number of drivers of matching efficiency dynamics: the share of long-term unemployment of total unemployment, skill mismatch, sectoral mismatch, spending on labour market policies per jobseeker.5
Table 1. Determinants of matching efficiency, 17 EU countries, 2003-2011
*, **, *** stand for statistical significance at the 10%, 5% and 1% level.
Estimates are obtained from fixed effect panel regressions, standard errors robust with respect to heteroskedasticity and non-independence within countries. All specifications, regressions include country and year effects. The panel is unbalanced: data are not available for some year in some countries.
The skill mismatch indicator used in the regressions is obtained as the weighted sum of the absolute value of the difference between the share of employment and population across education levels (primary, secondary, tertiary).
Source: Computations on AMECO, Eurostat LFS, Eurostat Labour Market Policies database.
Long-term unemployment appears to be the most significant determinant of matching efficiency over the whole sample, and its significance is linked to the high explanatory power that this variable exhibits after the crisis, in light of the sudden and marked increase in the average duration of unemployment spells.
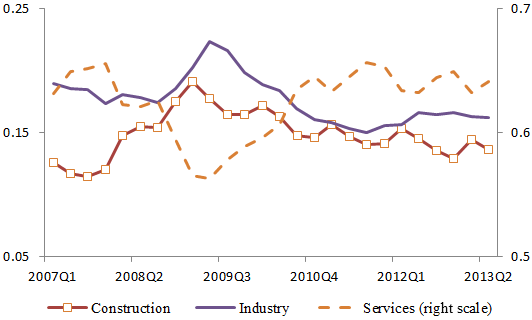
Sectoral mismatch exhibits a high explanatory power, but became a somewhat weaker determinant in the post-crisis period. Growing sectoral mismatch was relatively broad-based across countries, concentrated in the 2009-2010 period, and mostly linked to the sudden increase of layoffs from the industry and construction sectors. Figure 3 displays the evolution of the share of unemployed originating from the main economic sectors for the euro-area aggregate. It appears that although the vast majority of unemployment normally originates from services, in the aftermath of the crisis there was a sudden increase in the share of unemployed previously working in industry and construction. It also appears that by the end of 2010 the distribution of unemployment across main sectors of origin is broadly similar to the one prevailing before the crisis.6
Figure 3. Unemployment by sector of origin, Eurozone
Source: Eurostat, LFS.
Skill mismatch is a significant explanatory factor across the whole sample, and its explanatory power has increased after the crisis.7
Active Labour Market Policies have a significant explanatory power in enhancing matching efficiency, but become insignificant when restricting the sample to post-crisis years.
Finally, regional mismatch does not appear to play any significant role in driving matching efficiency. Actually, the sign appears to be contrary to expectations when restricting the sample to the post-crisis period. The reason is that the dispersion of unemployment regions across regions actually fell in many EU countries after the crisis, a phenomenon that often accompanies major recessions and that is compatible with the lack of explanatory power in driving matching efficiency (Layard, Nickell, and Jackman 2005).
Some implications for policy
Overall, the above evidence conveys a number of messages with relevant policy implications. Not only the level, but also the structure of unemployment (and the extent to which it is structural) differs widely across EU countries. It follows that policy responses across the board for the EU or the Eurozone would work only to a certain extent, since the magnitude and type of challenges are largely country-specific.
Fighting long-term unemployment appears to be the priority to reduce the risk of unemployment hysteresis in most countries, while the evidence indicates that industry mismatch is gradually reducing after the spike during the 2009 recession. Moreover, the analysis corroborates the view that active labour market policies may help raising the efficiency of the job-matching process.
References
Blanchard, O and P Diamond (1989), “The Beveridge Curve.” Brookings papers on economic activity, 1989 (1), 1-76.
European Commission (2013). “Labour Market Developments in Europe, 2013”, European Economy No.6, Directorate General for Economic and Financial Affairs.
Layard P R G, S J Nickell and R Jackman (2005), Unemployment: Macroeconomic Performance and the Labour Market, Oxford University Press, Oxford.
Sahin A, J Song, G Topa and G L Violante (2012). “Mismatch Unemployment,” NBER Working Paper 18265.
1 The job vacancy rate is the ratio of job vacancies on the total number of occupied and vacant posts. Eurostat and OECD sources have been used to construct long series for all EU countries. In some cases, vacancy data have been extrapolated backward using European Commission Business survey data (replies to the question on “factors limiting production: labour”, which are strongly correlated with actual vacancy data).
2 Job finding rates were constructed following the methodology described in Arpaia and Curci (2011). The cyclical component of job finding rates was computed separately for each country via the estimation of the elasticity of job finding rates to labour market tightness. A time-varying estimation of matching efficiency was obtained by adding the additional requirement of stable unemployment, i.e., that the labour market lies on the Beveridge curve.
3 Estimates were possible only for 22 EU countries with sufficiently long time series to allow estimating the elasticity of job finding rates on labour market tightness.
4 The skill mismatch indicator is obtained as the weighted sum of the absolute value of the difference between the share in employment and in population by education level (primary, secondary, tertiary). Industry mismatch indicator is measured, analogously, using differences in the share in vacancies and in unemployment across 5 economic sectors. Alternatively, to obtain a larger sample, industry mismatch is measured as the dispersion of unemployment across sectors of origin of the unemployed. The regional mismatch indicator is the standard deviation of unemployment across regions.
5 see Table 1 in appendum and paper for details.
6 This evidence is broadly in line with what is found for the US: the 2008 crisis was followed by major sectoral reallocation, but the extent of sectoral mismatch was not highly persistent (e.g. Sahin et al 2012).
7 However, the evidence shows that while skill mismatch has risen considerably in Southern EU countries such as Greece, Portugal, and Spain, it fell (e.g., the Baltics and other Eastern EU countries) or remained broadly flat (e.g., France, Italy) in other countries (see European Commission 2013).


