“Don’t put all your eggs in one basket” is probably amongst the oldest pieces of advice for investors. Many investors try to reduce risk by diversifying across industries, asset classes, or borders. The success of this strategy depends on the co-movement between different asset prices – higher comovements limit the possible gains from diversification. But what would happen if the very act of chasing these diversification opportunities destroyed them?
The idea that financial globalisation and diversification opportunities may be negatively correlated is not new. Goetzmann, Li and Rouwenhorst (2005) show that international diversification opportunities have declined markedly since the 1960s. In recent research, we examine how much of the rise in stock market correlations during the last decades reflects the simple fact that funds can today easily be invested across borders (Quinn and Voth 2008).
Hardly a day goes by without stock markets fluctuating in parallel. Tokyo’s performance sets the tone for the European opening of trading. Then, European bourses rise or fall, influencing the direction of trading in New York. It was not always so. Pairs of countries’ stock markets often showed low correlations as recently as 20 years ago. Today, countries’ equity markets can be 80% or more correlated.1
Using a new, long-run data set on the world’s most developed economies between 1890 and 2001, we examine what has driven the rise in co-movements. Increasing synchronisation of economic fundamentals played some role in the rise of equity market correlations: rising interest rate correlations, bilateral trade, and greater similarity of GDP growth rates. The key factor, however, has been the opening of capital accounts. In a panel of countries of the last 100 years, we show how increasing the freedom of capital movement across borders drove up correlations. The implications for equity investors are anything but benign – as soon as investing in other countries becomes possible, the very diversification benefits that investors seek decline markedly.
The rise of openness
How open is a country’s capital account? At first glance, it may seem that a myriad of factors needs to be considered. Can firms raise equity abroad? Can foreigners easily buy bonds and shares? Is it possible to repatriate investment capital? While the data requirements for a comprehensive measure of capital account openness seem daunting, there is an established indicator that has been widely used in the literature (Quinn-Toyoda 2008). Based on a detailed reading of the IMF’s Annual Report on Exchange Restrictions, the Quinn-Toyoda measure of openness offers a continuous measure of capital account liberalisation. It varies from 0 to 100.
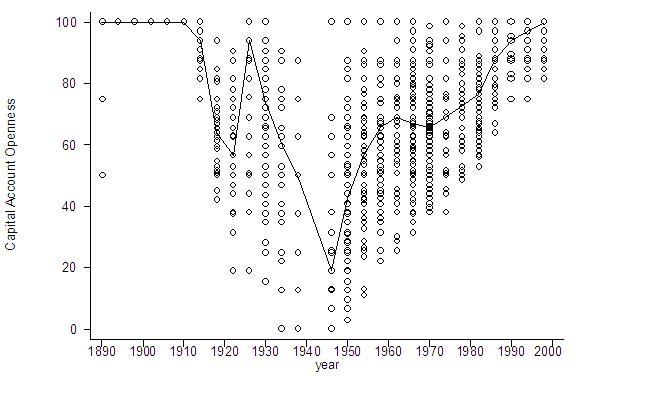
For our long-run analysis of openness and equity market correlations, we apply the Quinn-Toyoda coding rules to information from the League of Nations for the interwar period, as well as to other historical sources on restrictions. The broad outlines of openness across the 20th century can be seen in Figure 1. The line gives the median measure of openness in our dataset of 16 developed countries.
Figure 1 Capital account openness, 1890-2001
In line with the evidence from other indicators of capital market development (Taylor and Obstfeld 2003), median levels of capital account openness trace a U-shaped pattern. From very high levels during the ‘long 19th century’ before 1914, it falls to a trough during WW II. The post-war era marks a slow, gradual return to the levels of openness last seen before 1915. In Figure 1, each dot indicates a single country’s score. As the overall level of capital account openness falls, dispersion in the cross-section increased. It is only in the 1990s that most countries return to the level of homogeneity seen in the 19th century.
Changes in correlations
That stock market correlations are not stable over time is not a new insight. A stock market portfolio derived from 20 country indices is today more than twice as volatile as it was during the period 1946-71. We examine changes in equity market correlations over time in our dataset for 16 countries (120 pairs).
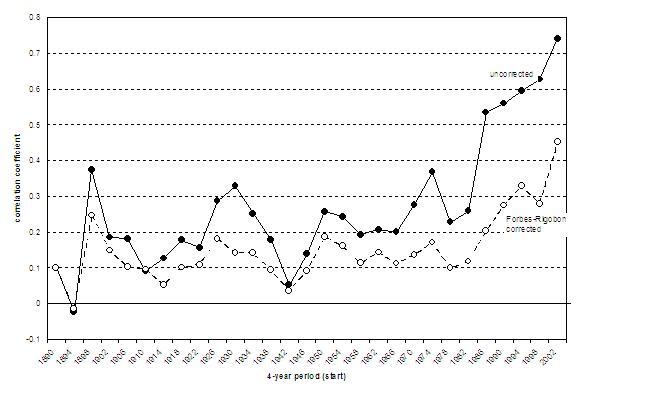
In Figure 2, we plot two indicators of stock index co-movement – one that is simply the average of correlations in our dataset at every point in time, and another one correcting for changes in variability. As Forbes and Rigobon (2002) showed, measured correlations will be systematically higher if volatility increases, so we calculate correlation coefficients purged from this effect.
Figure 2 Correlations between stock markets over time
Correlations today are high – to an extent that is unprecedented. Naïve, uncorrected correlation coefficients often reach very high levels (above 0.9 in some cases). Even 30 years ago, such co-movement was rare. For most of the 20th century, it was unheard of. Remarkably, even during the period of relatively open capital markets before WWI, co-movements were not high. The rise of correlations after 1950 however neatly coincides with the slow, gradual improvements in capital account openness. The volatility-corrected measure shows a similar increase after the 1980s, also reaching unprecedented heights after 1990.
The link
Compares Figures 1 and 2 at a glance suggests a link between increasing openness and rising co-movement. Using a number of case studies from emerging countries in the recent past, Bekaert and Harvey (2000) also show that equity correlations increase after the liberalisation of capital markets. At the same time, the time-series evidence is not sufficient to establish a strong link. For example, the period before 1915 seems not to fit with the prediction that greater openness should go hand-in-hand with higher correlations. In the most basic regression setup, we find that a rise of 25 points on the openness scale – equivalent to the change in the average between 1980 and 2000 – increases correlations by 0.13.
To establish the link between both variables, we perform a battery of econometric tests. Two possibilities concerned us in particular. First, correlations can change for a number of reasons other than openness. Second, openness itself may be a response factors that generally increase (economic, informational, social) exchange between countries. This may also produce higher co-movement.
To examine the first possibility, we control for a wide range of additional factors. GDP growth, correlated changes in interest rates, and greater trade volumes all appear to play a role in driving up correlations. This is not surprising since, for example, trade and greater cross-border equity positions seem closely linked (Lane and Milesi-Ferretti 2004). Crucially, including such controls neither undermines the importance of openness nor reduces the precision of our estimate.
Second, we address the possibility of endogeneity and omitted variable biases. We offer two alternatives to identify a part of the variation in openness that is not related to equity market correlations in a direct way – the political orientation of the government (using the measure of Budge et al. 2001 lagged one period), and global openness (excluding the country pair in question). In either case, we find even stronger effects than when we use the full range of variation in our explanatory variable. This suggests that there are issues of measurement bias in our variable, or that the truly exogenous part of the variation in openness has a stronger effect on correlations than the elements that may be driven by feedback effects.
Implications
Hailing the Bretton Woods agreements, US Secretary of the Treasury Hayden White congratulated himself and other participants on “driv[ing] the moneylenders from the temple of international finance.” White and John Maynard Keynes, together with other architects of the post-war monetary and financial institutions, deliberately designed a system that would avoid cross-border capital flows – not least because they were widely seen as partly responsible for the Great Depression. After Bretton Woods, it took half a century to restore the full openness of capital accounts in advanced countries. Many Eurozone countries only revoked the last restriction in the 1990s, in the run-up to the euro’s introduction.
We argue that it is no accident that the age of restrictive capital accounts also saw remarkably low equity market correlations. Cross-border diversification opportunities identified by early papers (Grubel 1968) were indeed “too good to be true.” Once investors can take advantage of low correlations elsewhere, they will rise. Initial investors may benefit since liberalisations tend to be followed by capital gains (Henry 2000). Yet risks will not fall anywhere near as much as initially hoped, as the covariance with other stock markets inevitably increases.
In this sense, the gains from international diversification are akin – at least in part – to a Fata Morgana. Investors may chase it, only to discover that it perennially disappears in the distance.
References
Bekaert, Geert, and Campbell R. Harvey, 2000, Foreign speculators and emerging equity markets, Journal of Finance 55, 565-613.
Budge, Ian, Hans-Dieter Klingemann, Andrea Volkens, Judith Bara, and Eric Tanenbaum, 2001, Mapping Policy Preferences: Estimates for Parties, Electors, and Governments 1945-1998 (Oxford University Press, New York).
Forbes, Kristin J., and Roberto Rigobon, 2002, No contagion, only interdependence: Measuring stock market comovements, Journal of Finance 43: 2223-2261
Goetzmann, William, Lingfeng Li, and Geert Rouwenhorst, 2005, Long-Term Global Market Correlations, The Journal of Business 78, 1-38.
Grubel, Herbert, 1968, Internationally Diversified Portfolios: Welfare Gains and Flows, American Economic Review 58: 1299-1314.
Henry, Peter, 2000, Stock Market Liberalization, Economic Reform, and Emerging Market Equity Prices, Journal of Finance 55(2): 529-565.
Lane, Philip R., and Gian Maria Milesi-Ferretti, 2004, International Investment Patterns, IMF working paper 134.
Obstfeld, Maurice, and Alan M. Taylor, 2003, Global Capital Markets, in M. D. Bordo, A. M. Taylor and J. G. Williamson, ed.: Globalization in Historical Perspective (University of Chicago Press, Chicago, Ill.).
Quinn, Dennis P., and A. Maria Toyoda, 2008, Does Capital Account Liberalization Lead to Growth?, Review of Financial Studies 21: 1403-1449.
Quinn, Dennis P., and Hans-Joachim Voth, 2008, Free Flows, Limited Diversification: Explaining the Fall and Rise of Stock Market Correlations, 1890-2001, CEPR discussion paper 7013.
1 Correlation coefficients, a measure of stock price comovements on a 0 to 1 scale, can reach 0.8 or more between a pair of countries’ equity markets.


