Often economic models are developed to describe a stable environment. We may want to relate the model to observed non-stationary data without taking a stand on where the non-stationarity comes from. Hodrick and Prescott (1981, 1997) proposed a method for doing this which is widely used in economic research and policy analysis. Their method has some serious drawbacks. Fortunately, there’s a better approach that avoids those problems.
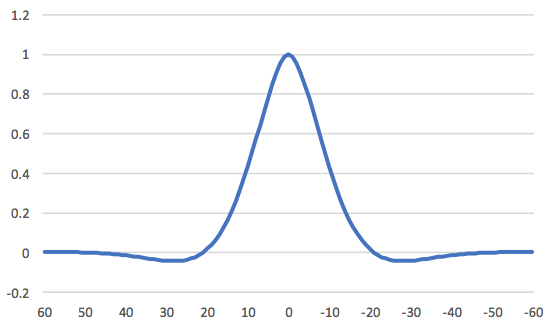
There are many ways to characterise the HP filter.1 One of the easiest to understand is an approximation to the HP-detrended component noted by Cogley and Nason (1995). First calculate fourth-differences of the original data – the change in the change in the change in the growth rate – and then take a long, smooth, weighted average of past and future values of those differences. The weights for that averaging step are graphed in Figure 1.
Figure 1 Weight given to value of ∆4yt+2-j (plotted as a function of j) in calculating cyclical component for date t implied by HP
Is this a reasonable procedure to apply to economic data? Theory suggests that variables like stock prices (Fama 1965), futures prices (Samuelson 1965), long-term interest rates (Sargent 1976, Pesando 1979), oil prices (Hamilton 2009), consumption spending (Hall 1978), inflation, tax rates, and money supply growth rates (Mankiw 1987) might all be well approximated by random walks. Certainly a random walk is often very hard to beat in out-of-sample forecasts (see, for example, Meese and Rogoff 1983 and Cheung et al. 2005 on exchange rates; Flood and Rose 2010 on stock prices; or Atkeson and Ohanian 2001 on inflation). If HP is not a good procedure to apply to a random walk, then we have no business using it generically on economic data.
If a variable follows a random walk, first-differencing removes everything that is predictable about the series. HP nevertheless goes on to take three more differences and then apply the smoothing weights in Figure 1. This puts all kinds of patterns into the HP-filtered series that have nothing to do with the original data-generating process and are solely an artefact of having applied the filter.
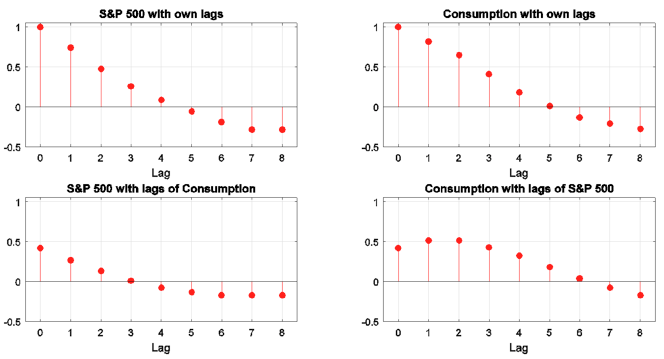
The top-left panel of Figure 2 shows the autocorrelation between the growth rate of the S&P500 stock price index and its growth rate j quarters earlier. The top-right panel shows the same for real consumption spending. There is little evidence that these variables can be predicted from their own lagged values or from lagged values of the other variable (bottom panels), exactly as we expect with a random walk.
Figure 2 Autocorrelations and cross-correlations for first-difference of log of stock prices and real consumption spending
Source: Hamilton (forthcoming).
Figure 3 shows the autocorrelations and cross-correlations for HP-detrended stock prices and consumption. The rich dynamic behaviour has nothing to do with the true properties of the variables. The patterns in Figure 3 are summaries of the filter, not the data.
Figure 3 Autocorrelations and cross-correlations for HP-detrended log of stock prices and real consumption spending
Source: Hamilton (forthcoming).
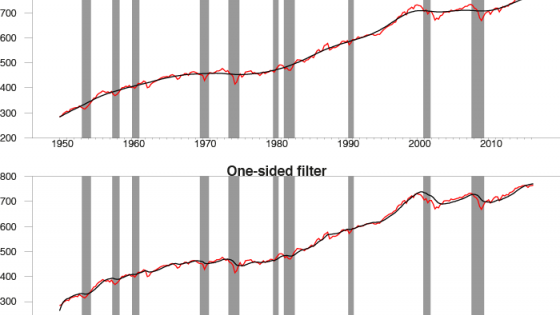
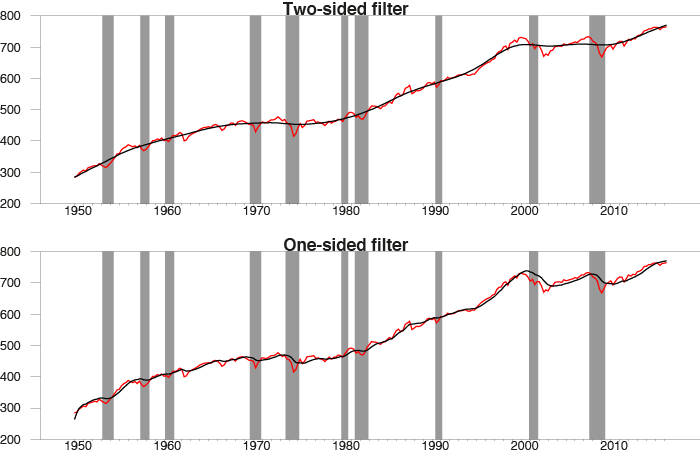
The top panel of Figure 4 shows the raw stock-price data in red and the HP-inferred trend in black. The black line tells the comforting story that the stock market rollercoaster just represents transient, cyclical dynamics. After all, we ended 2009 with stock prices about where they started the decade! The bottom panel shows the result of applying the HP filter with one caveat: for each date, we act as though that was the last date in the sample and look at what HP would have implied for the trend at that date. The picture is very different – the moves all look permanent now. A real-time observer would never know that stock prices were about to plunge in 2007 or take off in 2009. The patterns in the top panel could never have been recognised in real time because they have nothing to do with the true data-generating process. It’s just a pretty picture that our imagination wants to impose on the data after the fact.
Figure 4 HP trend in stock prices as identified using the full sample (top panel) and using data actually available at each indicated date (bottom panel)
Source: Hamilton (forthcoming).
HP is not a sensible approach for a random walk. Is there any time-series process for which it would be a good idea? Hodrick and Prescott noted one very special case: if we assume that second differences of the trend are impossible to forecast, and that the deviation of the variable from the trend is impossible to forecast, then HP would give an optimal inference about the trend. However, if we accepted those assumptions, it would be straightforward to use the observed data to estimate the appropriate value of the HP smoothing parameter, commonly denoted λ. The standard practice for quarterly data is to assume that λ = 1,600. For every economic and financial time series I have looked at, I come up with an estimate from the data closer to λ = 1 – three orders of magnitude off from what practitioners assume.
I conclude that not only is HP almost certainly the wrong approach for most economic variables we will encounter; there does not exist any variable to which one can point for which the commonly followed practice would be the optimal thing to do.
Fortunately there is a better alternative. I first propose a practical definition of the trend that we intend to remove. Sometimes economists define a trend in terms of an infinite-horizon forecast. But the problem with that concept is that we can never find out about an infinite horizon from a finite sample. I propose that we instead focus more practically on a two-year horizon, something about which we do have useful information in typical sample sizes. I would further argue that the primary reason we’ll miss with a two-year forecast is cyclical developments – a recession arrives that we did not anticipate, or the expansion is stronger than expected.
One might think that even to make a two-year-ahead forecast, we need to know something about the underlying process and trend. However, this is not the case. We can always form a usable forecast based on a linear function of the four most recent values of the series. The optimal forecast within this class exists and can be estimated from the data, and the error associated with the forecast is stationary for a broad class of time-series processes.
Suppose for example that the growth rate of a variable is stationary. We can always write the level of the variable two years from now as the level today plus the sum of the changes over the next two years. If the growth rate is stationary, we have just written the level two years from now as a linear function of the level today plus something stationary.
Alternatively, suppose that it is the change in the growth rate that is stationary. If we know the level today, the level the previous period, and the change in the growth rate each quarter over the next two years, we would know the level two years from now. This allows us to write the level two years from now as a linear function of the two most recent levels plus something stationary. If instead fourth differences are needed to achieve stationarity, we can write the level two years from now as a linear function of the four most recent levels plus something stationary.
What happens in any of the above cases if we do an ordinarly least squares regression of the level two years from now on a constant and the four most recent values for the level? If the regression picks the coefficients that make the residuals stationary, the average squared residual will tend to some stable number in a large enough sample. If it picks coefficients that make the residuals nonstationary, the average squared residual goes off to infinity. Because ordinary least squares tries to minimise the residual sum of squares, in a large sample it should give an estimate of the population object of interest, namely the linear forecast of the variable two years ahead. Simple regression thus offers a reasonable approach to remove the trend as defined here for a broad class of possible processes.
For the baseline case of a random walk, the best two-year-ahead forecast is simply the level today. The cyclical component from the above definition would in that case simply be the two-year difference of the series. I have found for most economic variables that the two-year difference is pretty similar to the regression residuals.
We can also identify exactly the same concept – the error associated with a two-year-ahead linear forecast – in any theoretical economic model. If the theoretical model has the property that shocks die out after two years, the forecast error would exactly equal the deviation from the steady state, which is indeed the concept modellers often have in mind when they think of the cyclical component. If shocks do not fully die out after two years, then part of what I am labelling the trend corresponds to longer-lived shocks. In any case, one can estimate a population object in nonstationary data that is exactly analogous to the corresponding object in the stationary model, allowing the kind of apples-to-apples comparison that users of HP were hoping to obtain.
Figure 5 applies this procedure to the components of the US national income accounts. Consumption is less volatile and investment is more volatile than GDP, but the cyclical components of all three move together. The cyclical component of exports is often moving separately, while the transient component of government spending is dominated by military shocks such as the Korean and Vietnam wars and the Reagan military build-up.
Figure 5 Regression residuals (black) and two-year changes (red) 100 times the log of components of US national income accounts
Source: Hamilton (forthcoming).
References
Atkeson, A and L E Ohanian (2001), “Are Phillips curves useful for forecasting inflation?”, Quarterly Review, Federal Reserve Bank of Minneapolis, 25(1): 2-11.
Cheung, Y-W, M D Chinn and A G Pascual (2005), “Empirical exchange rate models of the nineties: Are any fit to survive?”, Journal of International Money and Finance, 24(7): 1150-1175.
Cogley, T and J M Nason (1995), “Effects of the Hodrick-Prescott filter on trend and difference stationary time series: Implications for business cycle research”, Journal of Economic Dynamics and Control, 19(1-2): 253-278.
Fama, E F (1965), “The behavior of stock-market prices”, The Journal of Business, 38(1): 34-105.
Flood, R P and A K Rose (2010), “Forecasting international financial prices with fundamentals: How do stocks and exchange rates compare?”, Globalization and Economic Integration, Chapter 6, Edward Elgar Publishing.
Hall, R E (1978), “Stochastic implications of the life cycle-permanent income hypothesis: Theory and evidence”, Journal of Political Economy, 86(6): 971-987.
Hamilton, J D (2009), “Understanding crude oil prices”, Energy Journal, 30(2): 179-206.
Hamilton, J D (Forthcoming), “Why you should never use the Hodrick-Prescott filter”, Review of Economics and Statistics.
Hodrick, R J and E C Prescott (1981), “Postwar US business cycles: An empirical investigation”, working paper, Northwestern University.
Hodrick, R J and E C Prescott (1997), “Postwar US business cycles: An empirical investigation”, Journal of Money, Credit and Banking, 29(1): 1-16.
Mankiw, N G (1987), “The optimal collection of seigniorage: Theory and evidence”, Journal of Monetary Economics, 20(2): 327-341.
Meese, R A and K Rogoff (1983), “Empirical exchange rate models of the seventies: Do they fit out of sample?”, Journal of International Economics, 14(1-2): 3-24.
Pesando, J E (1979), “On the random walk characteristics of short- and long-term interest rates in an efficient market”, Journal of Money, Credit and Banking, 11(4): 457-466.
Samuelson, P (1965), “Proof that properly anticipated prices fluctuate randomly”, Industrial Management Review, 6(2): 41-49.
Sargent, T J (1976), “A classical macroeconometric model for the United States”, Journal of Political Economy, 84(2): 207-237.
[1] See Hamilton (forthcoming) for references and discussion.


