Trade sanctions are back. The invasion of Ukraine, renewed tensions in the Middle East, homeland economics, and the multi-faceted rivalries between China and the West suggest geopolitics are about to become once again highly relevant for economic policy, and trade sanctions in particular.
To evaluate the consequences of trade sanctions, the conventional approach consists in constructing multi-country multi-sector models of trade and simulating them on the basis of some parameter values that are deemed plausible (e.g. Baqaee and Farhi 2019, Bachmann et al. 2022).
There is a difficulty inherent to this approach. In response to sanctions, countries turn to alternative markets: that may be more or less costly depending on how easy it is to find these alternatives. In the models, this is governed by elasticities of substitution: between alternative sources of inputs, between alternative markets, between alternative destinations. These are particularly difficult to discipline, because it is very difficult to reach a consensus on their actual values (see, among many others, Feenstra et al. 2018, Imbs and Méjean 2015, Atalay 2017, Huo et al. 2023).
As a consequence, many commentators trying to gauge how damaging a given set of trade sanctions can be resort to naïve approximations readily available off the shelf. A prominent example is to use the fraction of a sector’s inputs that are directly imported from the embargoed economy.
In the case of Russia, we frequently read that some West European countries would be affected to a first order because most of their energy inputs come from Russia. This is a dangerous simplification since it ignores the possibility of substituting away from Russian-produced energy, and it focuses on direct trade while it is the full value chain that should matter in this instance (Johnson and Noguera 2012).
In a recent paper (Imbs and Pauwels 2023), we propose an alternative that is easy to compute from readily available data. The approach is purely empirical, which means it does not rely on a calibrated model and therefore not on the calibration of any elasticity of substitution. The idea is to extract from the historical patterns of trade the components that would be set to zero under an embargo, inclusive of indirect trade down the value chain. The share of these components in output represents the approximate impact of the sanction.
The approximation is derived from a workhorse multi-country model. It is valid under mild assumptions about the response of the aggregate price index to trade sanctions. We use the model to simulate a variety of different trade sanctions involving the EU and Russia.
We show that virtually in all cases, model-simulated trade sanctions imply economic costs that are very close to those implied by our proposed approximation. An exception is when the elasticities of substitution are set to zero, i.e. when it is actually impossible to find substitutes for embargoed goods. This does not seem plausible, as discussed, for example, by Lafrogne-Joussier et al. (2022) and Bachmann et al. (2022). For most plausible calibrations, our approximation is valid because it implies costs of trade sanctions that are comparable with what a fully calibrated simulated model would conclude.
We then turn to an application of the procedure to trade sanctions against Russia. We approximate the percentage of forgone output in Russia and the EU following an embargo on Russia’s energy exports to the EU. Like many others, we find that the costs to Russia and the EU are typically small, just above 1% in Russia and less than 0.1% in the EU. But unlike others, we obtain these estimates from a direct manipulation of the data, rather than simulating a calibrated model.
We also consider an embargo on EU exports to Russia, with effects that are similar in magnitude and that continue to be much larger in Russia than in the EU. These results are not new or surprising, but they illustrate the validity of our approximation.
One of the key advantages of our procedure is that it can be performed readily for a broad range of sectors and countries: the only needed ingredient is the availability of data on input-output trade between those sectors. We illustrate this versatility with a country-by-country decomposition of the consequences of different embargoes.
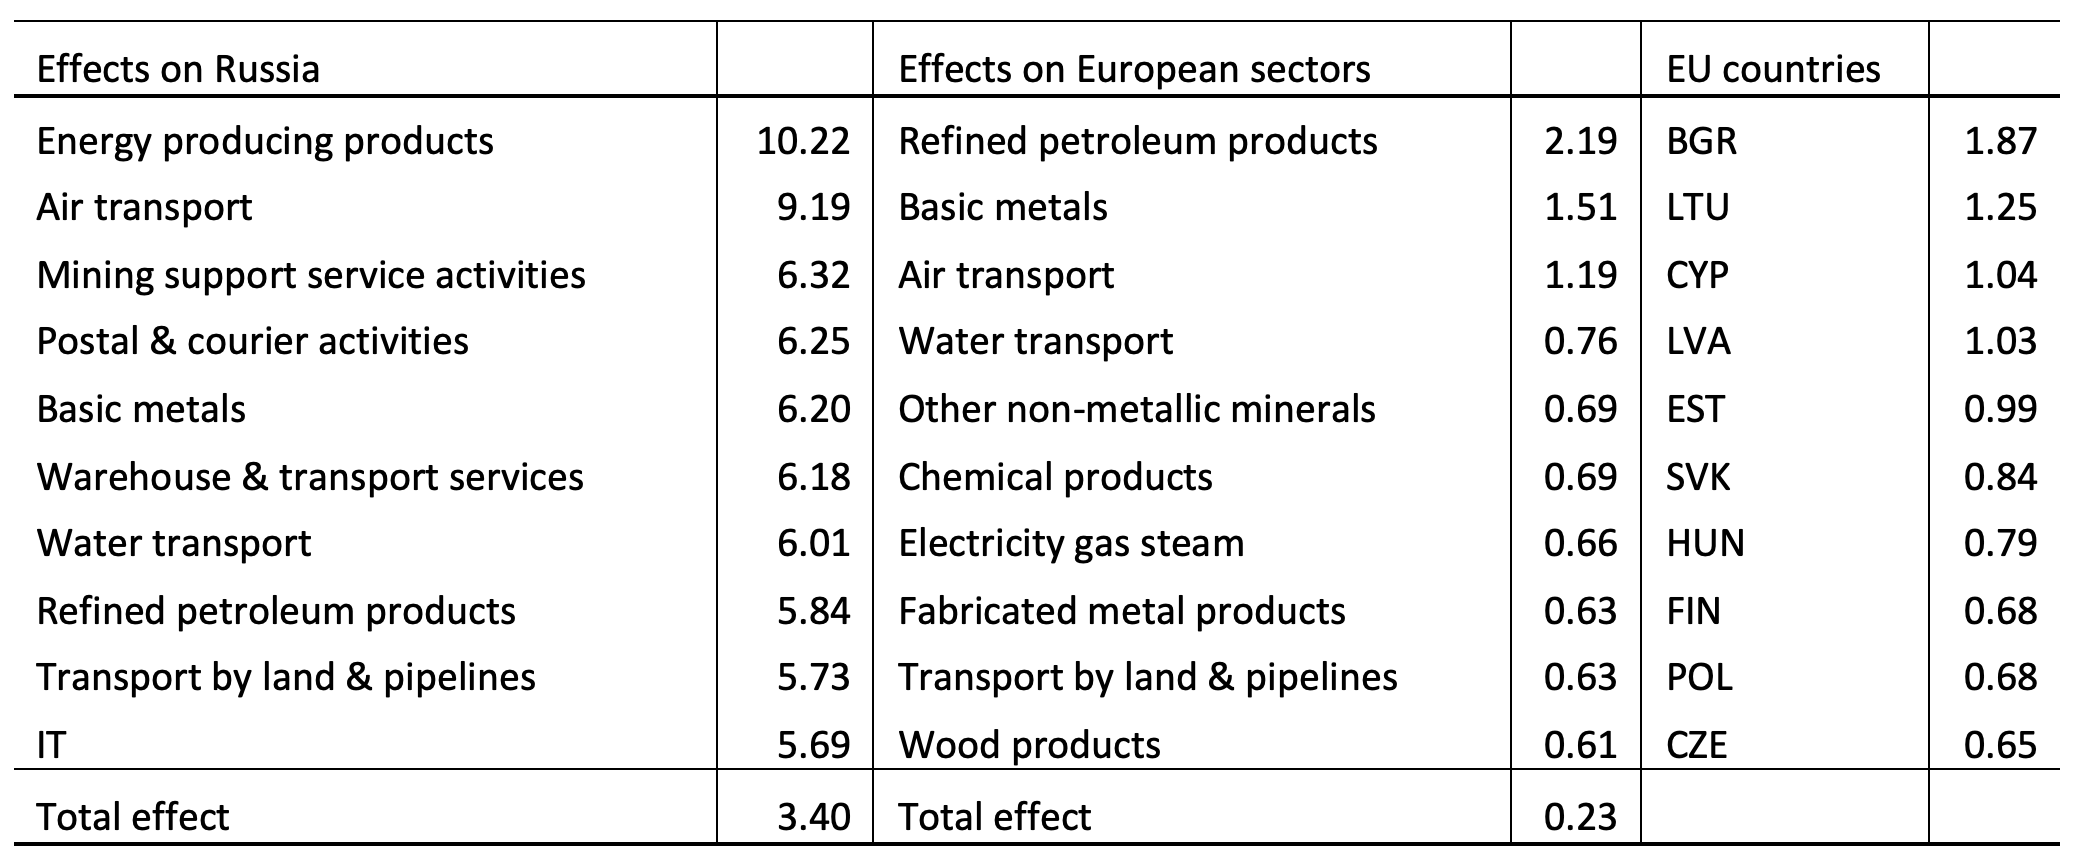
We document that the small effects on the EU as a whole mask vast asymmetry: we find that the small European countries that were satellite economies of the former Soviet Union suffer enormously more than large West European economies, sometimes by several orders of magnitude (see Table 1). A candidate explanation is gravity: trade tends to occur between neighbors, and these small East European economies have historically traded heavily with the Soviet Union and then with Russia.
Table 1 Approximate effects of an embargo on all Russian sectors (in %)
This raises an important issue of equity within the EU. How easy is it for those heavily affected countries to decouple their trade patterns from Russia? Are there large substitute markets available for them, for example, within the EU?
Slightly adapting our approximation procedure can help answer this question. We re-compute the output decomposition central to our approximation but omitting now the share of output that was produced using Russian energy inputs. We ask what are the ‘runner-up’ energy suppliers to these countries, those alternative suppliers that have been historically available.
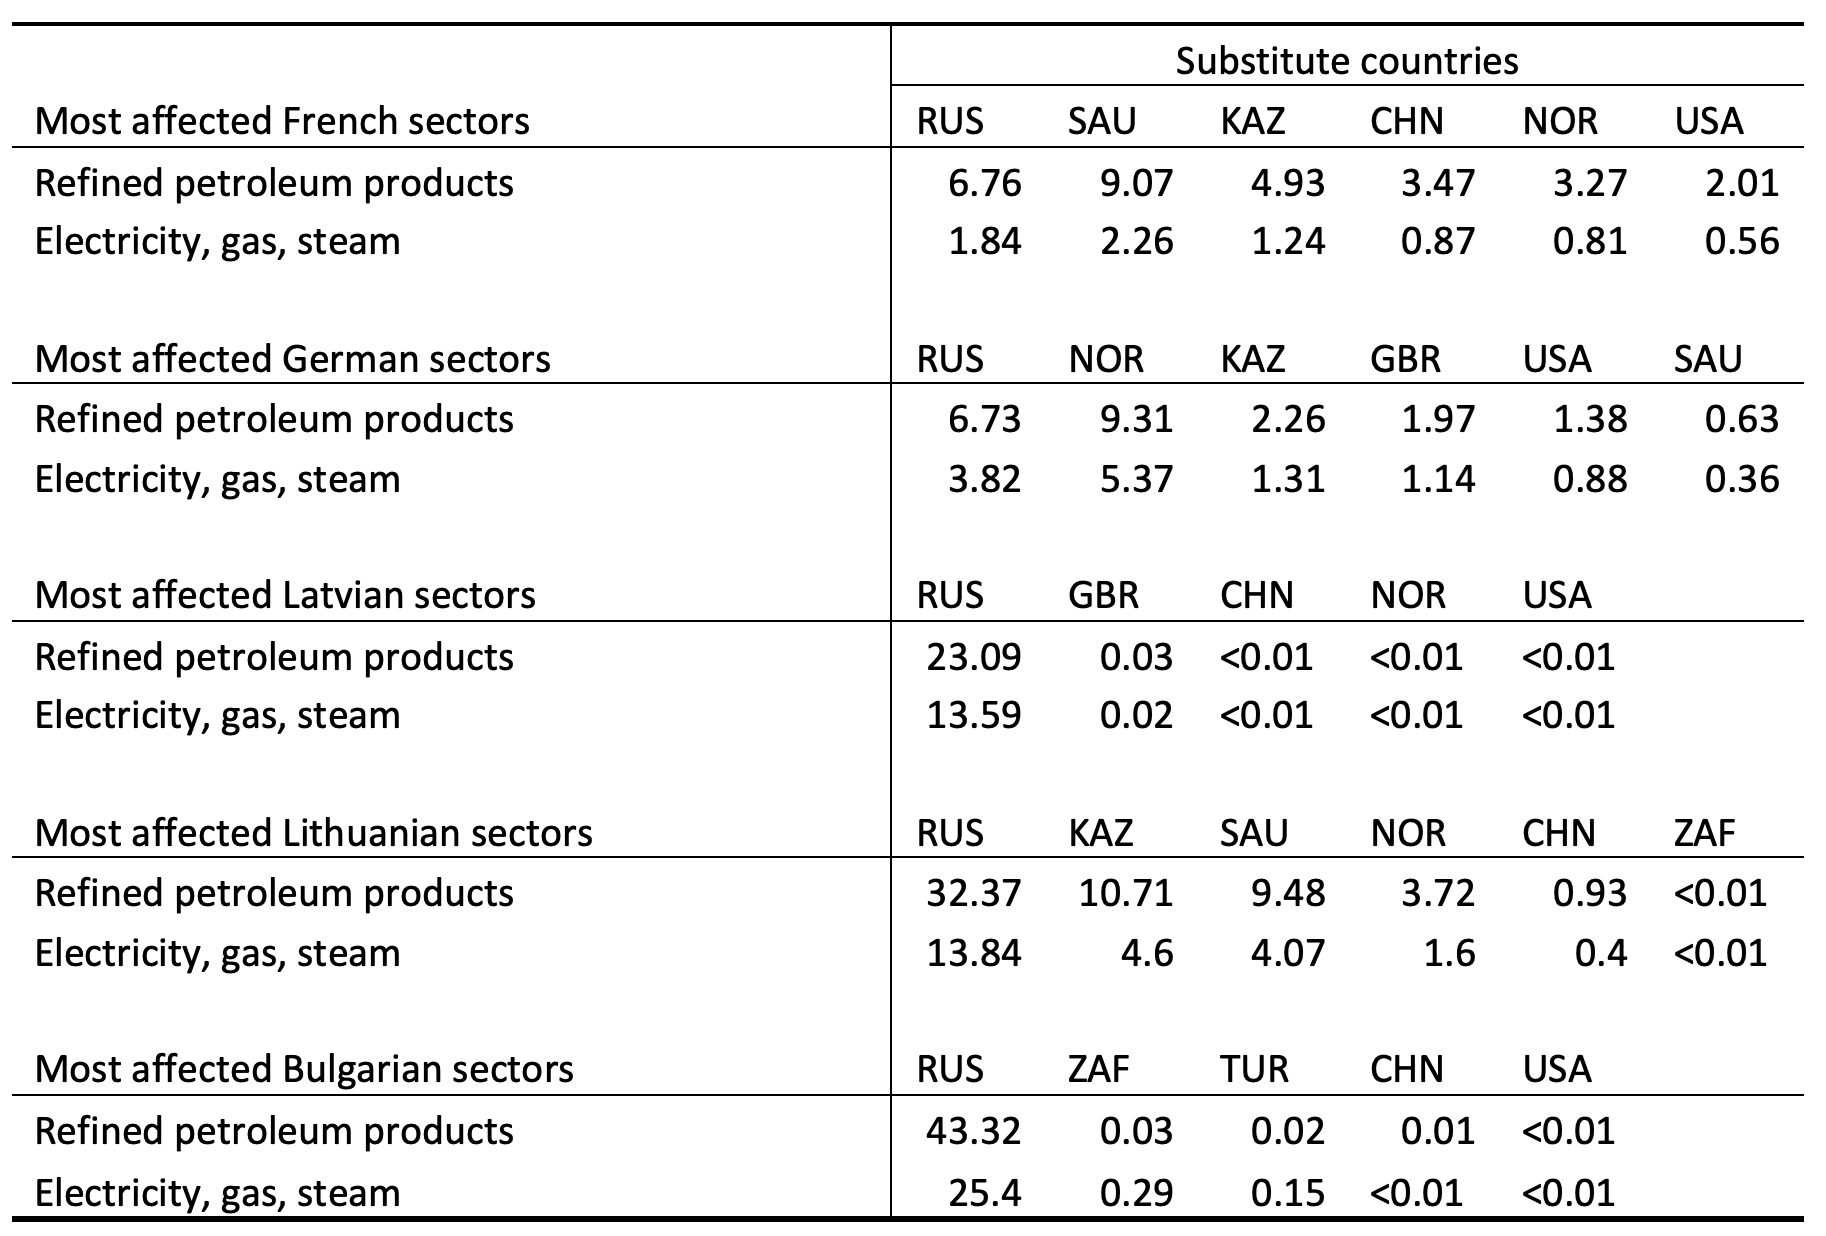
Table 2 presents our results for two large West European countries (France and Germany) and three ‘ex-satellite’ countries (Bulgaria, Latvia and Lithuania). In France and Germany, the sectors that are most affected by an embargo on Russia’s energy have readily available alternative suppliers: Saudi Arabia, Norway, Kazakhstan, or Great Britain have all been supplying energy to either country. In Latvia and Bulgaria, alternatives simply do not exist: the fraction of output in these countries that is produced using Russia’s energy is enormously larger than any alternative. Lithuania is a bit different, in that runners-up exist, with Kazakhstan or Saudi Arabia (although they are still much smaller than Russia’s share).
Table 2 Substitute markets for European countries (in %)
A key question is whether these patterns have altered over time, particularly with EU accession, perhaps also after the invasion of Crimea in 2014. We can answer this question exploiting once again the flexibility of our approach, computing the output decomposition that underpins our approximation, but now over time.
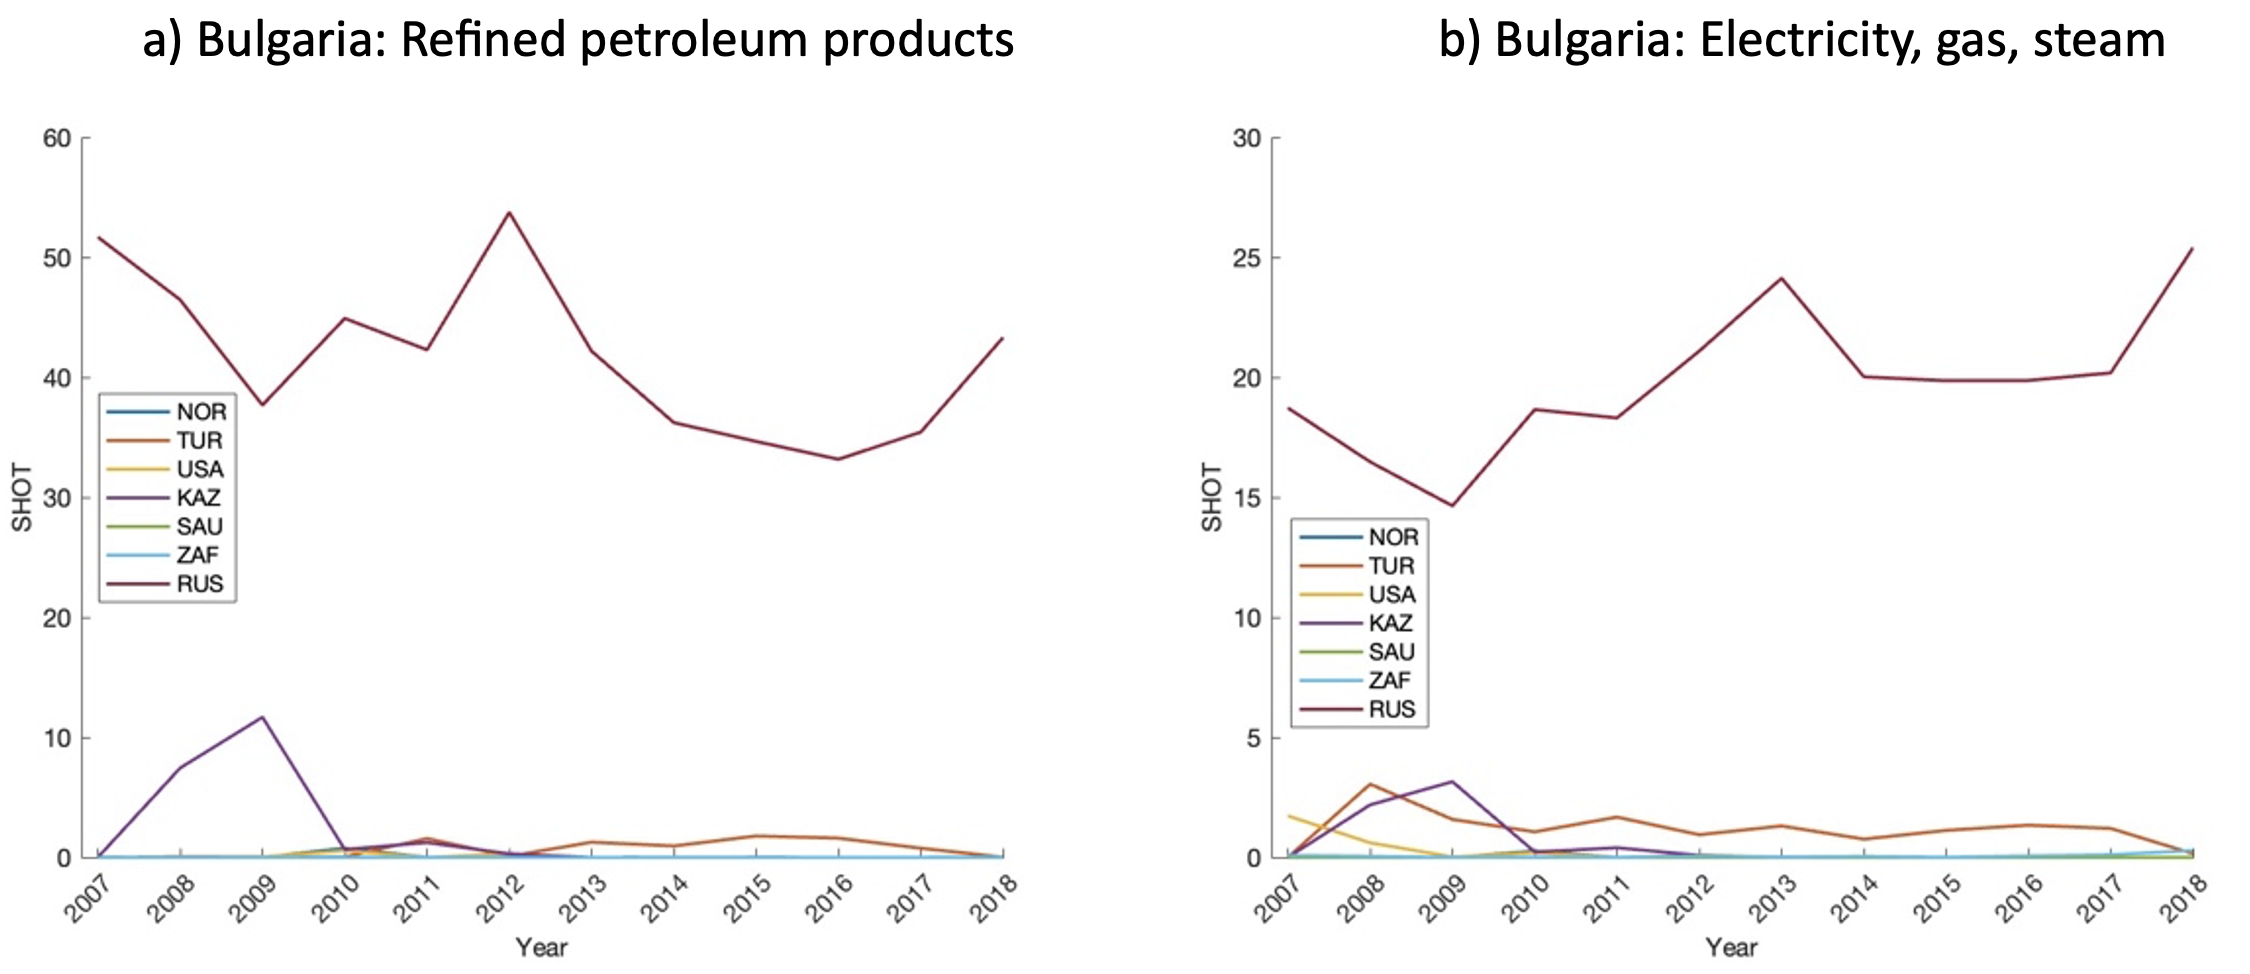
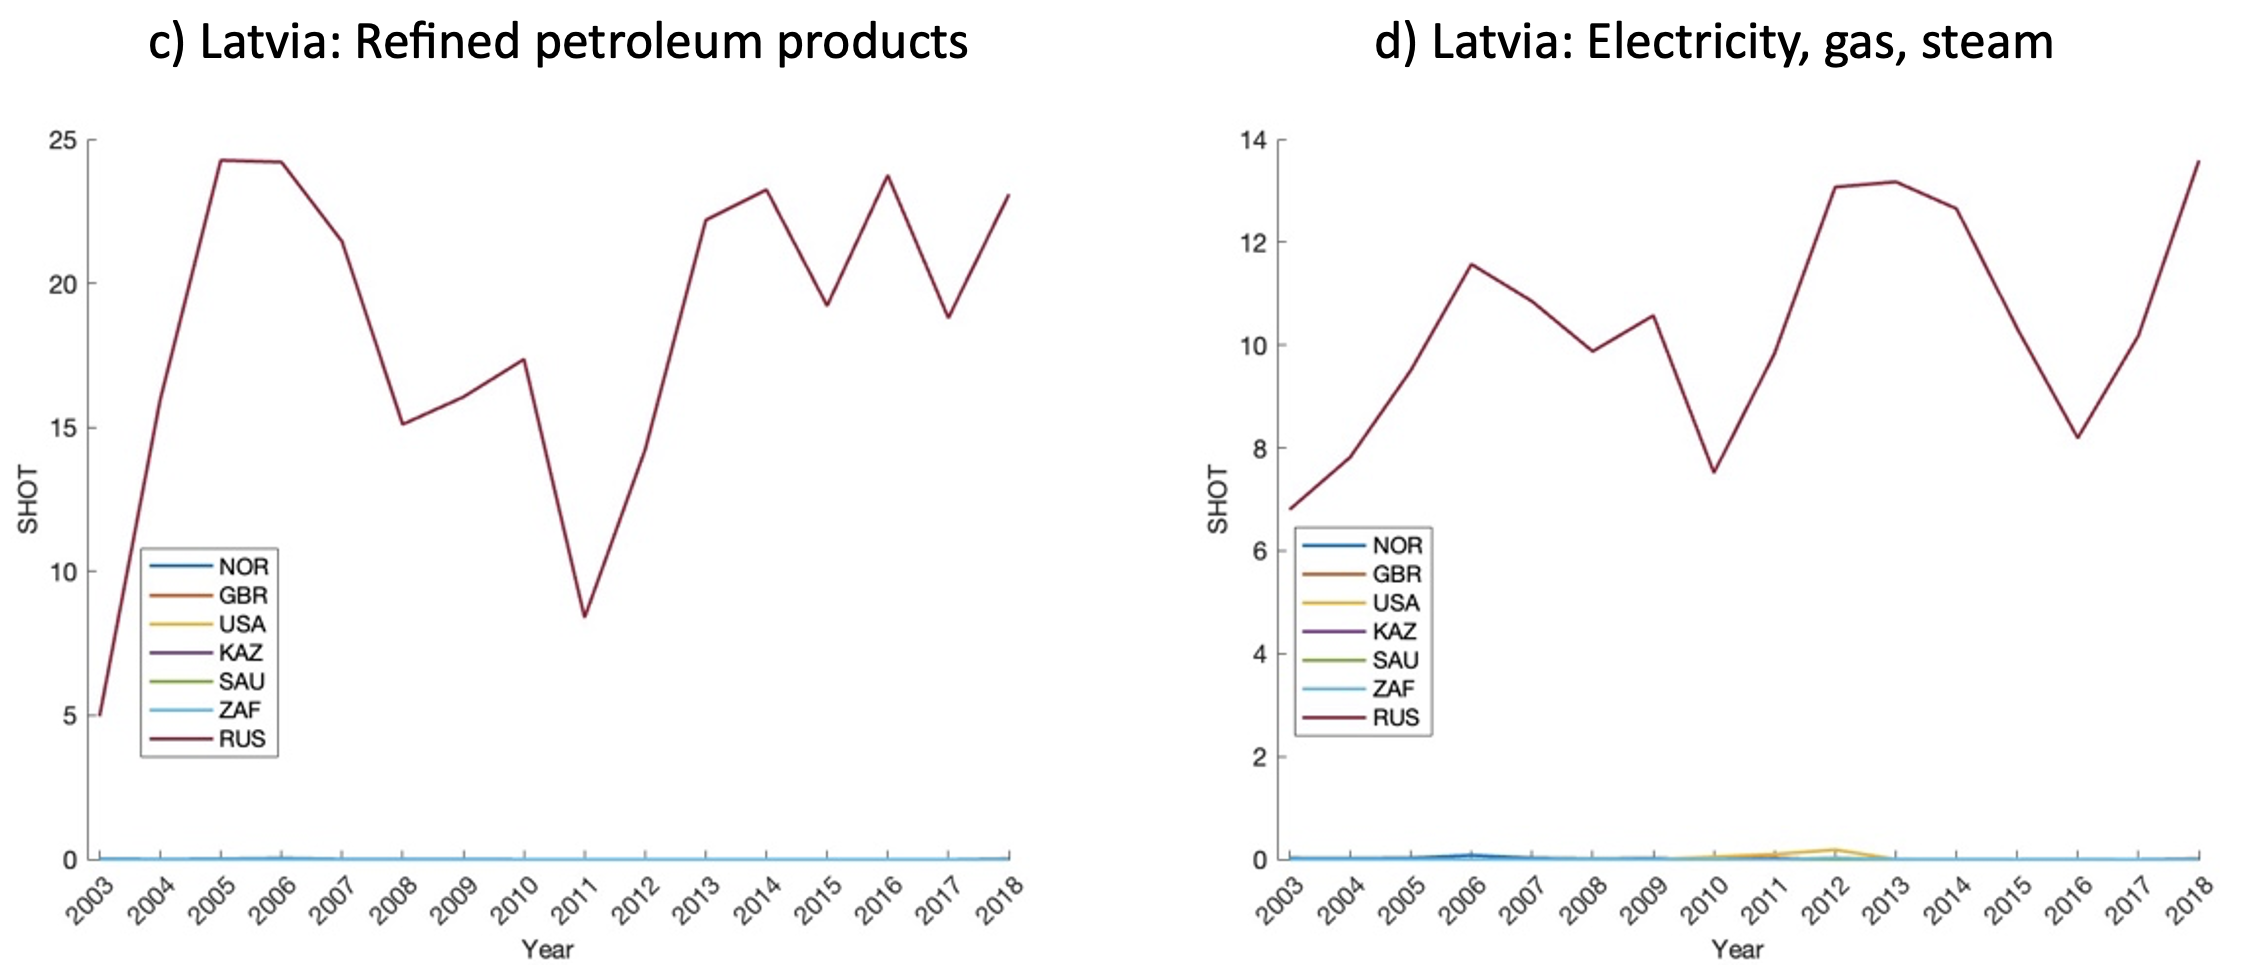
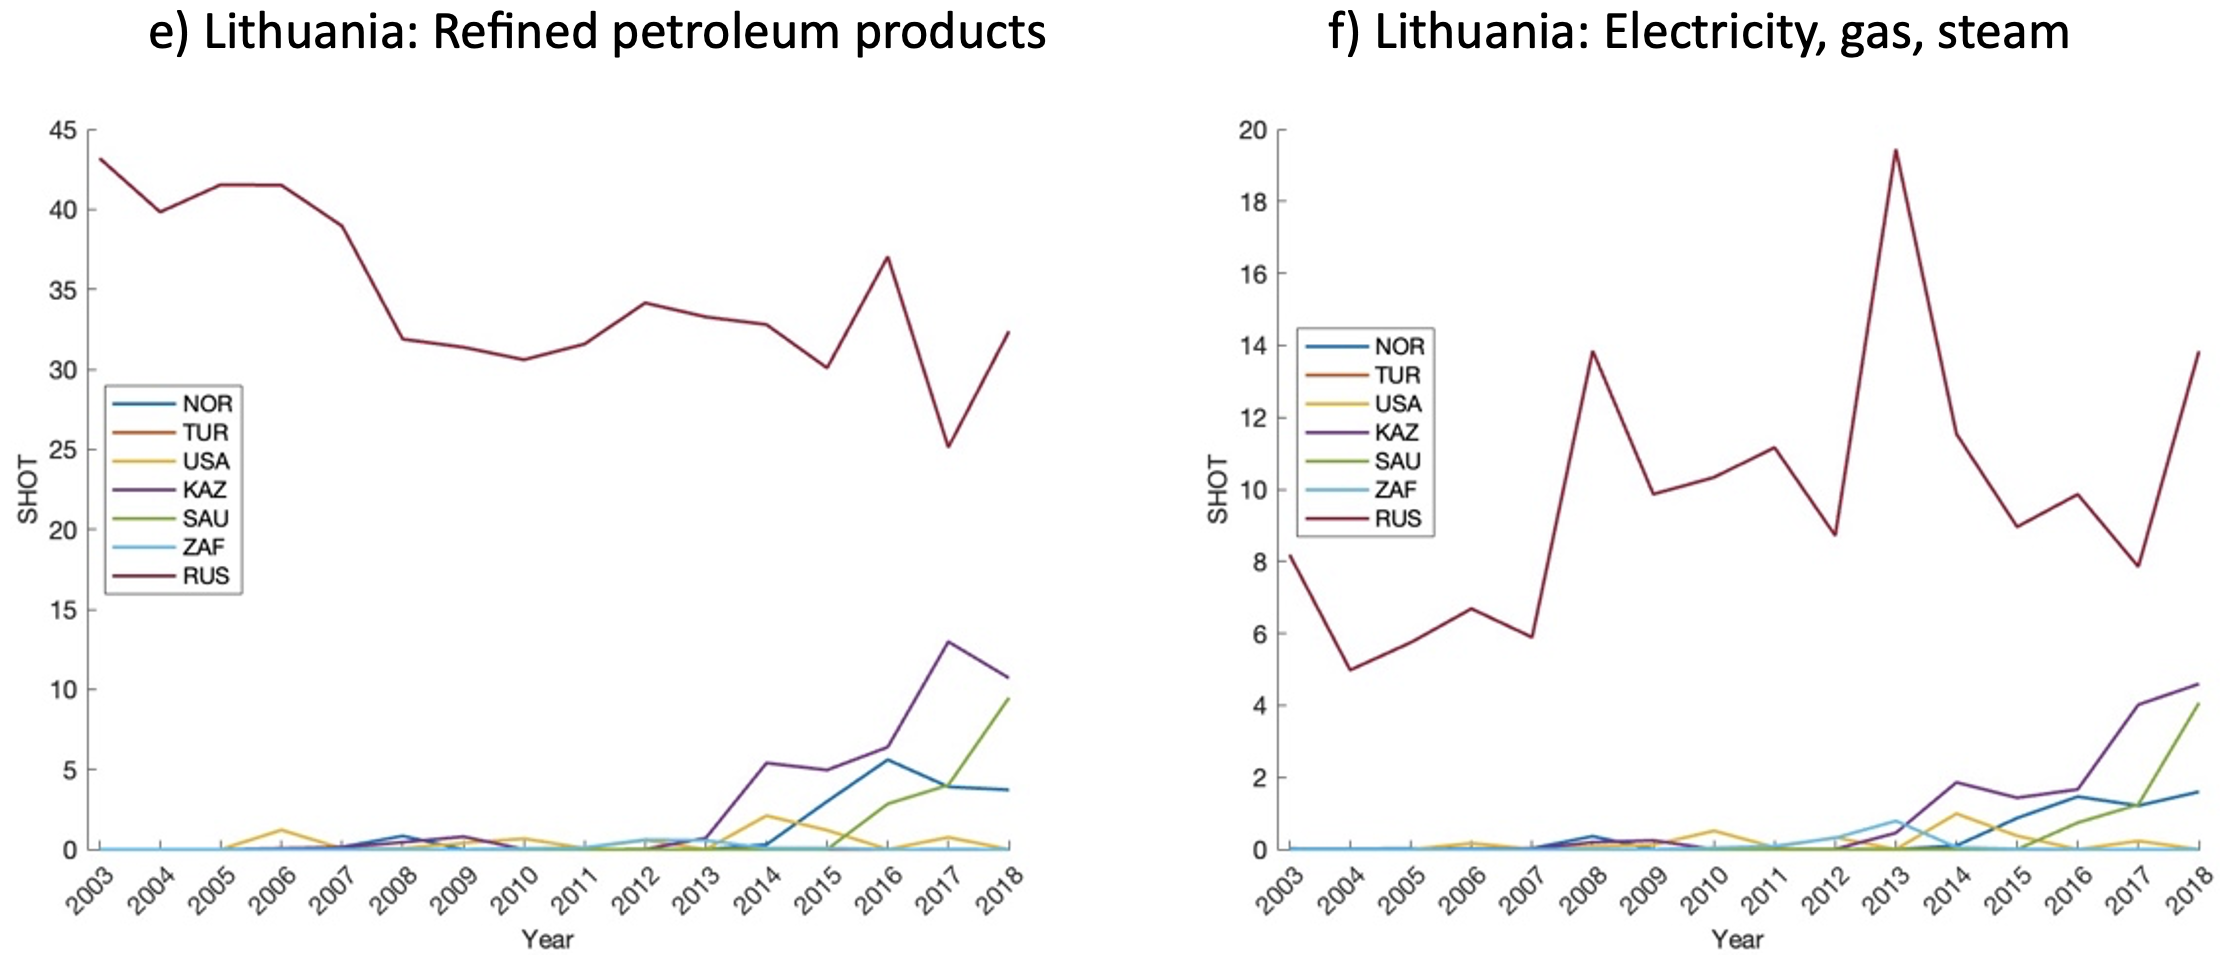
Figure 1 plots the origins of inputs for the most affected sectors in Bulgaria, Latvia and Lithuania starting from EU accession date until 2019. The figure confirms that the extreme dominance of Russia as the main provider of inputs in Bulgaria and Latvia has prevailed historically, and shows no sign of having abated since accession: if anything, it is rising in Latvia. In Lithuania on the other hand, Russia’s dominance has diminished since accession. It is worth noting that this coincides with the acquisition of refineries and LNG terminals that have facilitated imports into Lithuania from other sources than Russia.
Figure 1 Input origins for the most affected sectors in Bulgaria, Latvia, and Lithuania
Note: SHOT on the vertical axis measures the percentage of inputs in global value chain.
These results illustrate the portability and versatility of our approximation. We believe it provides a practical shortcut to evaluating the consequences of trade sanctions that makes is possible to conduct a broad range of simple yet relevant experiments without having to take a stance on the full set of parameters in a calibrated model.
We have developed a web-based dashboard, accessible to the public at https://exposure.trade that proposes a user-friendly interface designed to facilitate the extraction of approximate costs of trade sanctions for any combinations of sanctioning and sanctioned countries or sectors. We believe this could constitute an important input in future policy discussions.
References
Atalay, E (2017), “How important are sectoral shocks?”, American Economic Journal: Macroeconomics 9: 254-80.
Bachmann, R, D Baqaee, C Bayer, M Kuhn, A Löschel, B Moll, A Peichl, K Pittel and M Schularick (2022) “What if? The economic effects for Germany of a stop of energy imports from Russia”, EconPol Policy Reports 36, ifo Institute – Leibniz Institute for Economic Research at the University of Munich.
Baqaee, D, and E Farhi (2019), “Networks, barriers, and trade”, NBER Working Paper 26108.
Feenstra, R, P Luck, M Obstfeld, and KN Russ (2018) “In Search of the Armington Elasticity”, Review of Economics and Statistics 100(1): 135-50.
Huo, Z, AA Levchenko and N Pandalai-Nayar (2021), “International Comovement in the Global Production Network”, NBER Working Paper 25978.
Imbs, J, and I Méjean (2015), “Elasticity Optimism”, American Economic Journal: Macroeconomics 7(3): 43-83.
Imbs, J, and L Pauwels (2023) “An Empirical Approximation of the Effects of Trade Sanctions with an Application to Russia”, forthcoming, Economic Policy.
Johnson, RC, and G Noguera (2012), “Accounting for intermediates: Production Sharing and Trade in Value Added”, Journal of International Economics 86(2): 224-36.
Lafrogne-Joussier, R, J Martin and I Mejean (2022) “Supply shocks in supply chains: Evidence from the early lockdown in China”, IMF Economic Review.

