Prominent recent examples such as the 2016 Brexit vote in the UK or the 2016 election of Donald J. Trump in the US highlight that opinion polls may provide only noisy forecasts of election outcomes – for a multitude of reasons. Difficulties in forecasting turnout, last-minute breaking development, and even inclement weather could play a role in explaining deviations of election outcomes from ex-ante predictions. Yet, do unanticipated electoral surprises have an impact on the economy? If so, what are the main channels through which these effects materialise? And is economic activity more sensitive to surprises of specific types of parties (e.g. left wing versus right-wing)? In a recent paper (Fetzer and Yotzov 2023), we attempt to answer these questions using a new cross-country dataset of election polls and outcomes.
There are good reasons to believe election surprises may impact economic outcomes. Unexpected changes in the incumbent government, the structure of the governing coalition, or even changes in the balance of powers in parliament may each increases uncertainty over the policy preferences of the newly constituted government after an election, at least in the short term. As a result, firms and consumers may adjust their behaviour in the wake of an electoral surprise. For example, firms anticipating policy changes may defer capital investment due to heightened economic policy uncertainty (Bloom et al. 2012, Baker et al. 2016) or perceived political risk (Hassan et al. 2019). Consumers are also known to anticipate policy changes, which can have effects on business cycles (e.g. Browning and Collado 2001, Hsieh 2003). Given the importance of the expectations channel for economic decisions of individuals (Roth and Wohlfart 2020) and firms (Link et al. 2023) and given the relevance of information shocks shaping expectations (Coibion and Gorodnichenko 2012, 2015, Coibion et al. 2018), it is not unreasonable to expect that a surprise election result may impact the economic cycle.
New dataset of election polls
We begin by constructing a new dataset of pre-election opinion polls matched with election results. In total, we collect data from 13,600 opinion polls from various polling agencies across 51 countries. The dataset covers 233 elections over the period 1980 to 2020. Specifically, we focus on chief executive elections, depending on the political system in the country. In other words, we use parliamentary elections in parliamentary systems (e.g. UK) and presidential elections in presidential systems (e.g. US). For each election, we collect polling data at the party-level in the days and weeks leading up to the vote. In total, the data cover more than 100,000 voting intention estimates for individual parties or candidates.
Next, we calculate a measure of ‘electoral surprise’ as the average absolute deviation between election polls and outcomes across all parties contesting an election. The main measure focuses only on polls conducted within 15 days of the election, in order to best capture an ‘unexpected’ deviation from expectations. This approach follows the literature that produces macroeconomic surprise measures based on forecast errors of macroeconomic aggregates (e.g. Scotti 2016, Rossi and Sekhposyan 2015).
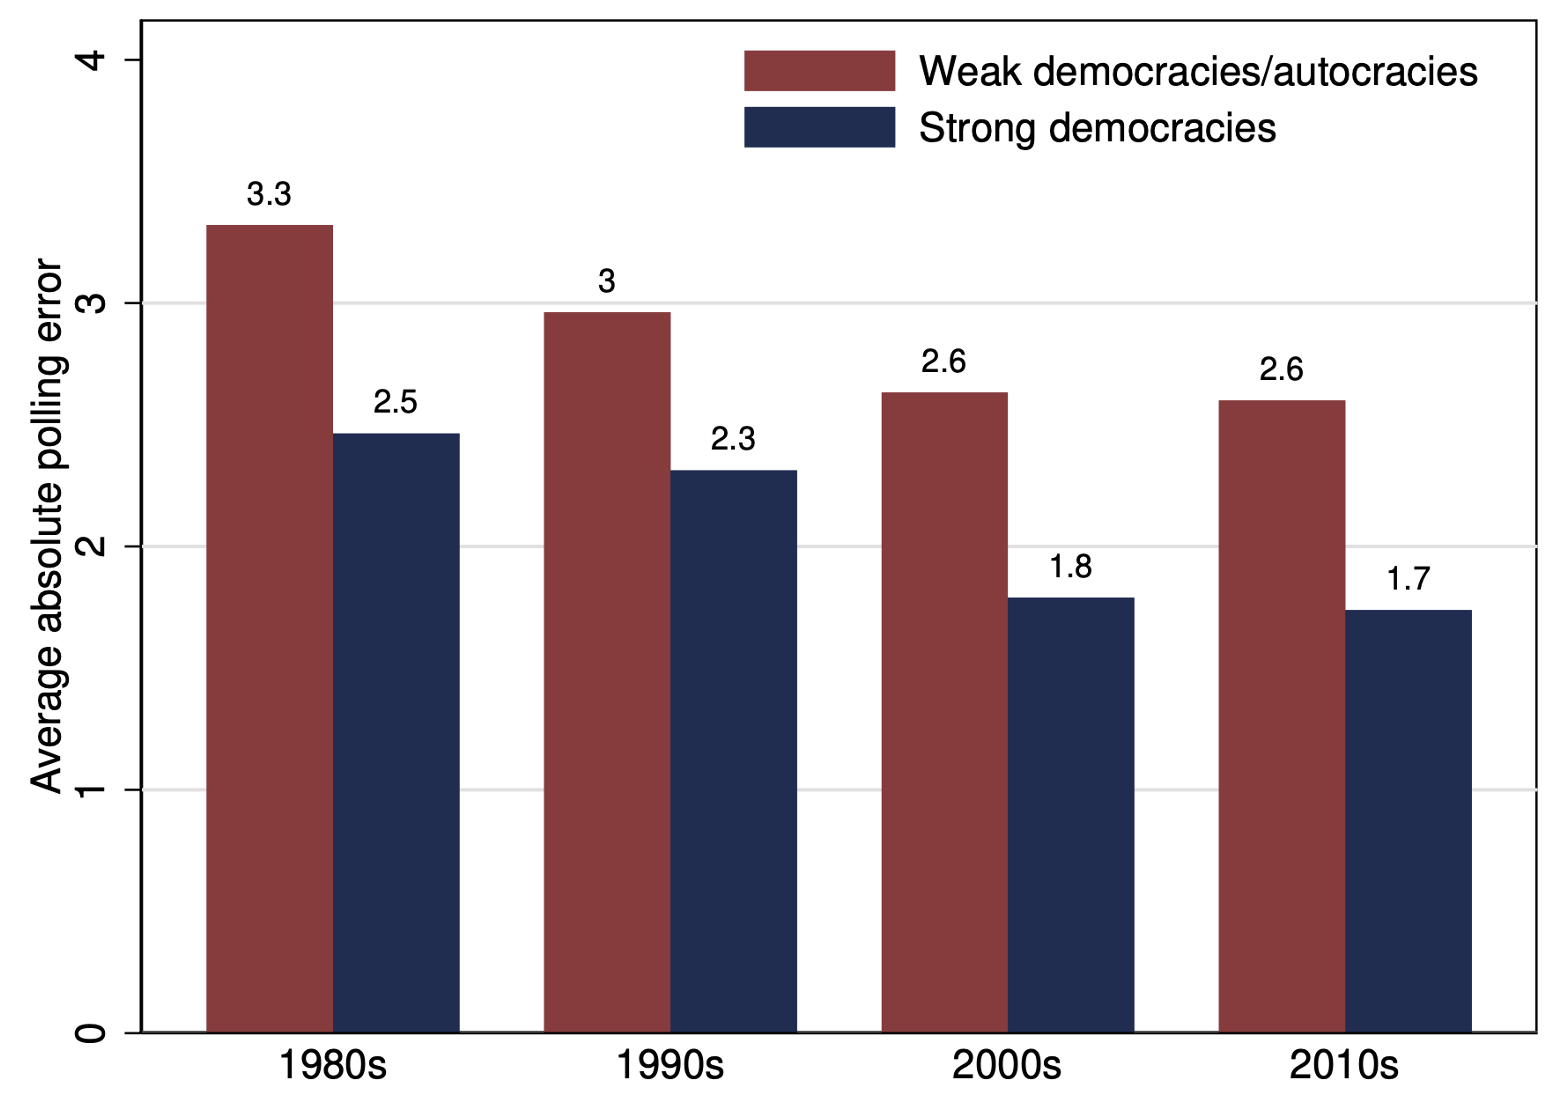
Figure 1 presents the average electoral surprises across the four decades of our sample. It furthermore splits the sample into strong democracies and weak democracies/autocracies using data from the Polity IV database. The average polling error has decreased over time for both regime types, suggesting better polling performance. This is consistent with the findings in earlier studies, such as Jennings and Wlezien (2018). In addition, we note that average polling errors are consistently smaller in stronger democracies across all decades.
Figure 1 Average electoral surprises by decade
Notes: This figure presents the average election surprise measure by decade. The sample of ’strong democracies’ is defined as countries with an average polity2 score above 9 in the three years prior to an election, based on the Polity IV database.
Electoral surprises and economic activity
To study the impact of electoral surprises on economic activity, we construct a balanced panel dataset at the election level. Specifically, we centre the data around each election event specific to each country. We then construct a window of eight quarters before and after a given election. We then populate the election windows with economic data and the constant election surprise measure. In some instances (e.g. two-round elections), this leads to overlaps in election windows. However, in further analysis, we demonstrate that our results are not sensitive to dropping these elections, or to shorter, four-quarter event windows.
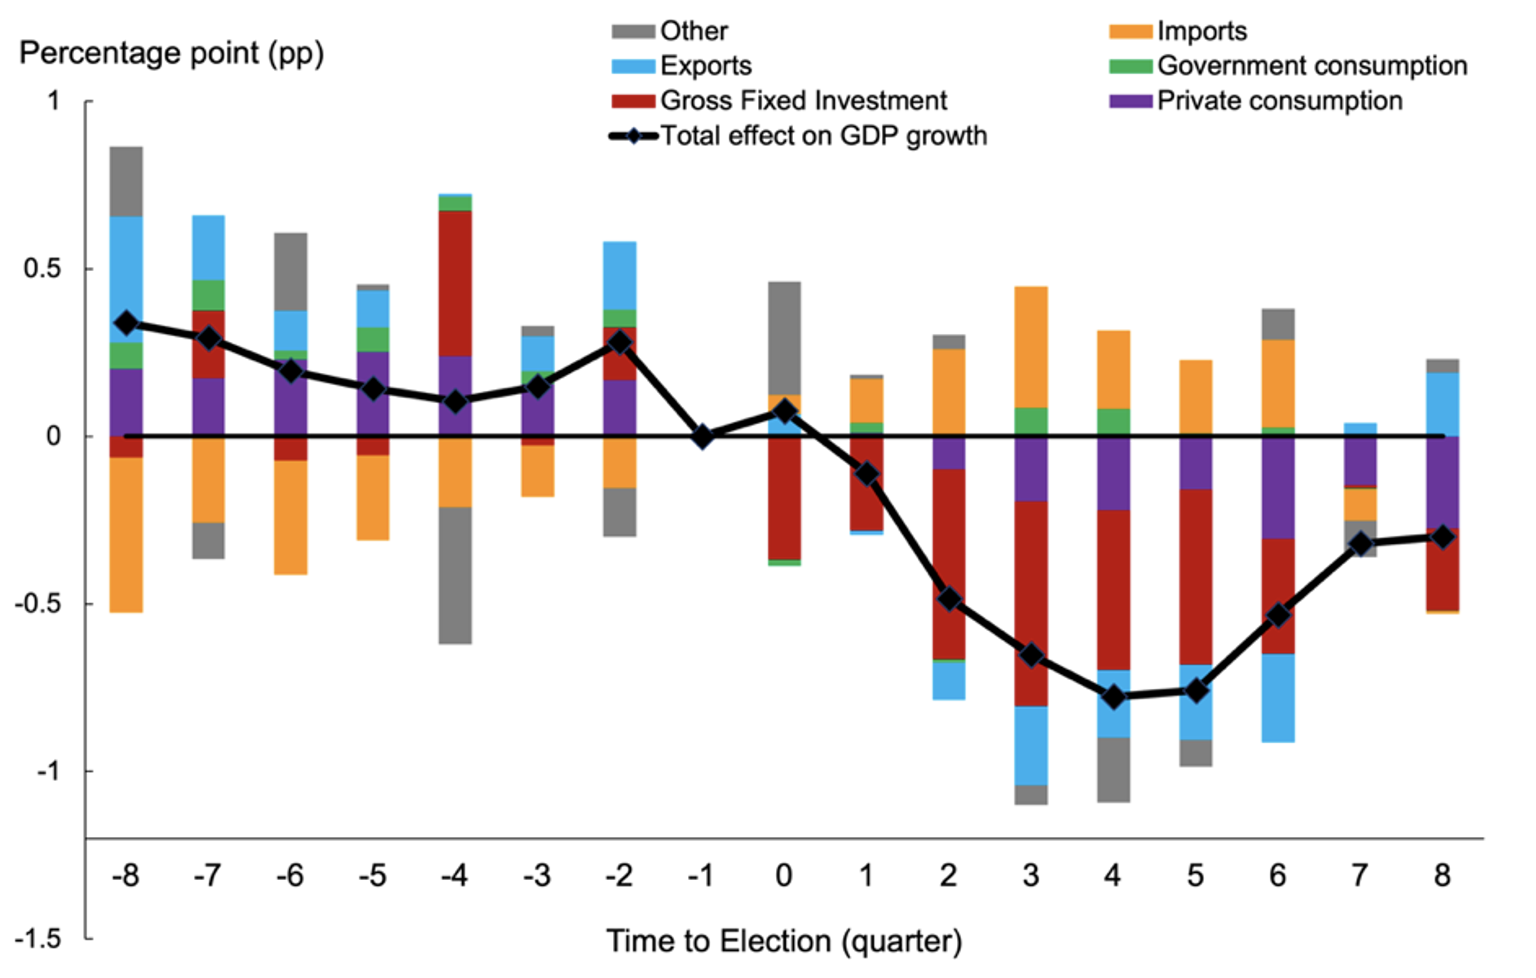
Figure 2 presents the main results for the impact of election surprises on economic activity. The black line in Panel A traces out the effect of the election surprise on GDP growth in each quarter of the event window (taking the quarter before the election as the reference category). The coefficients in the pre-election quarters show no clear trend. They are also statistically insignificant (as shown in the paper). This is what one would expect, since the electoral surprise is only realised on election day. However, in the quarters following an election, surprises are associated with a distinct slowdown in GDP growth. This effect is strongest around four quarters following an election. At that point, a one percentage point higher electoral surprise (i.e. average absolute polling error) is associated with a 0.78 percentage point lower GDP growth. The coefficients in Panel A also suggest that the effects on economic activity are short-lived. By the eighth quarter following an election, they are no longer statistically significant.
Figure 2 Panel A also provides a regression-based decomposition of the effect of electoral surprises on the different components of GDP. This is constructed by, first, estimating event studies for each component (private consumption, investment, government consumption, exports, and imports), and second, scaling those coefficients by the average weight of that component in GDP. The decomposition highlights that the main driver of the decline in GDP growth is lower investment growth (dark red bars). The effect on private consumption is also negative, but its contribution is much smaller quantitatively. Finally, we find no significant effects on government consumption, suggesting our electoral surprises are not capturing any ‘political business cycle’ effects (e.g. Akhmedov and Zhuravskaya 2004, Aidt et al. 2011).
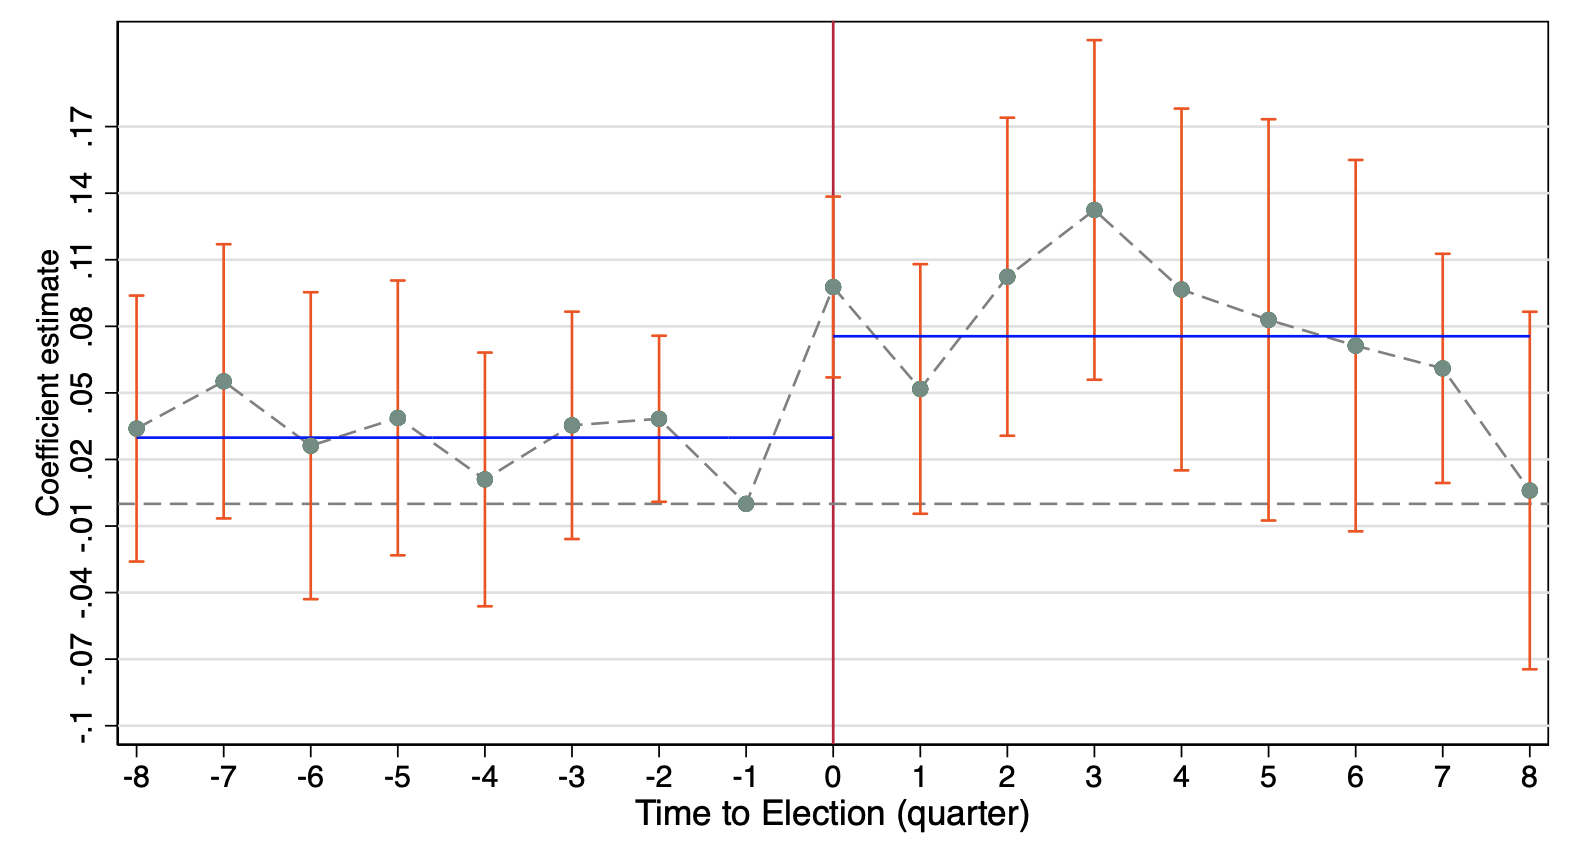
The negative effect of electoral surprises on investment growth can be rationalised if policy uncertainty increases in the quarters following an unexpected outcome. Indeed, previous work has shown significant impacts of economic policy uncertainty around national elections (Rodden et al. 2020). In Figure 2, Panel B we test this hypothesis in the context our electoral surprises and event study framework. We find a significant impact of average polling errors on economic policy uncertainty: these effects are present immediately in the election quarter, and grow stronger in the year following an election. However, as seen in the effects on economic activity, these effects are short-lived, and become insignificant around two years following an election.
Figure 2 Main effects of electoral surprises in strong democracies
A) Impact on GDP and its components
B) Impact on economic policy uncertainty
Notes: Panel A presents a decomposition of the effects of election surprises on GDP growth for the sample of strong democracies. The decomposition splits the effect into five components: Private consumption; Government consumption; Gross Fixed Investment; Imports; and Exports. The black line is based on the estimated coefficients on GDP growth. The bars are estimated using coefficient values from event study regressions for each component. These coefficients are then scaled by the average contribution of the given component in GDP across the countries in the sample, weighted by population. Panel B presents the effect of election surprises on year-on-year changes in Economic Policy Uncertainty.
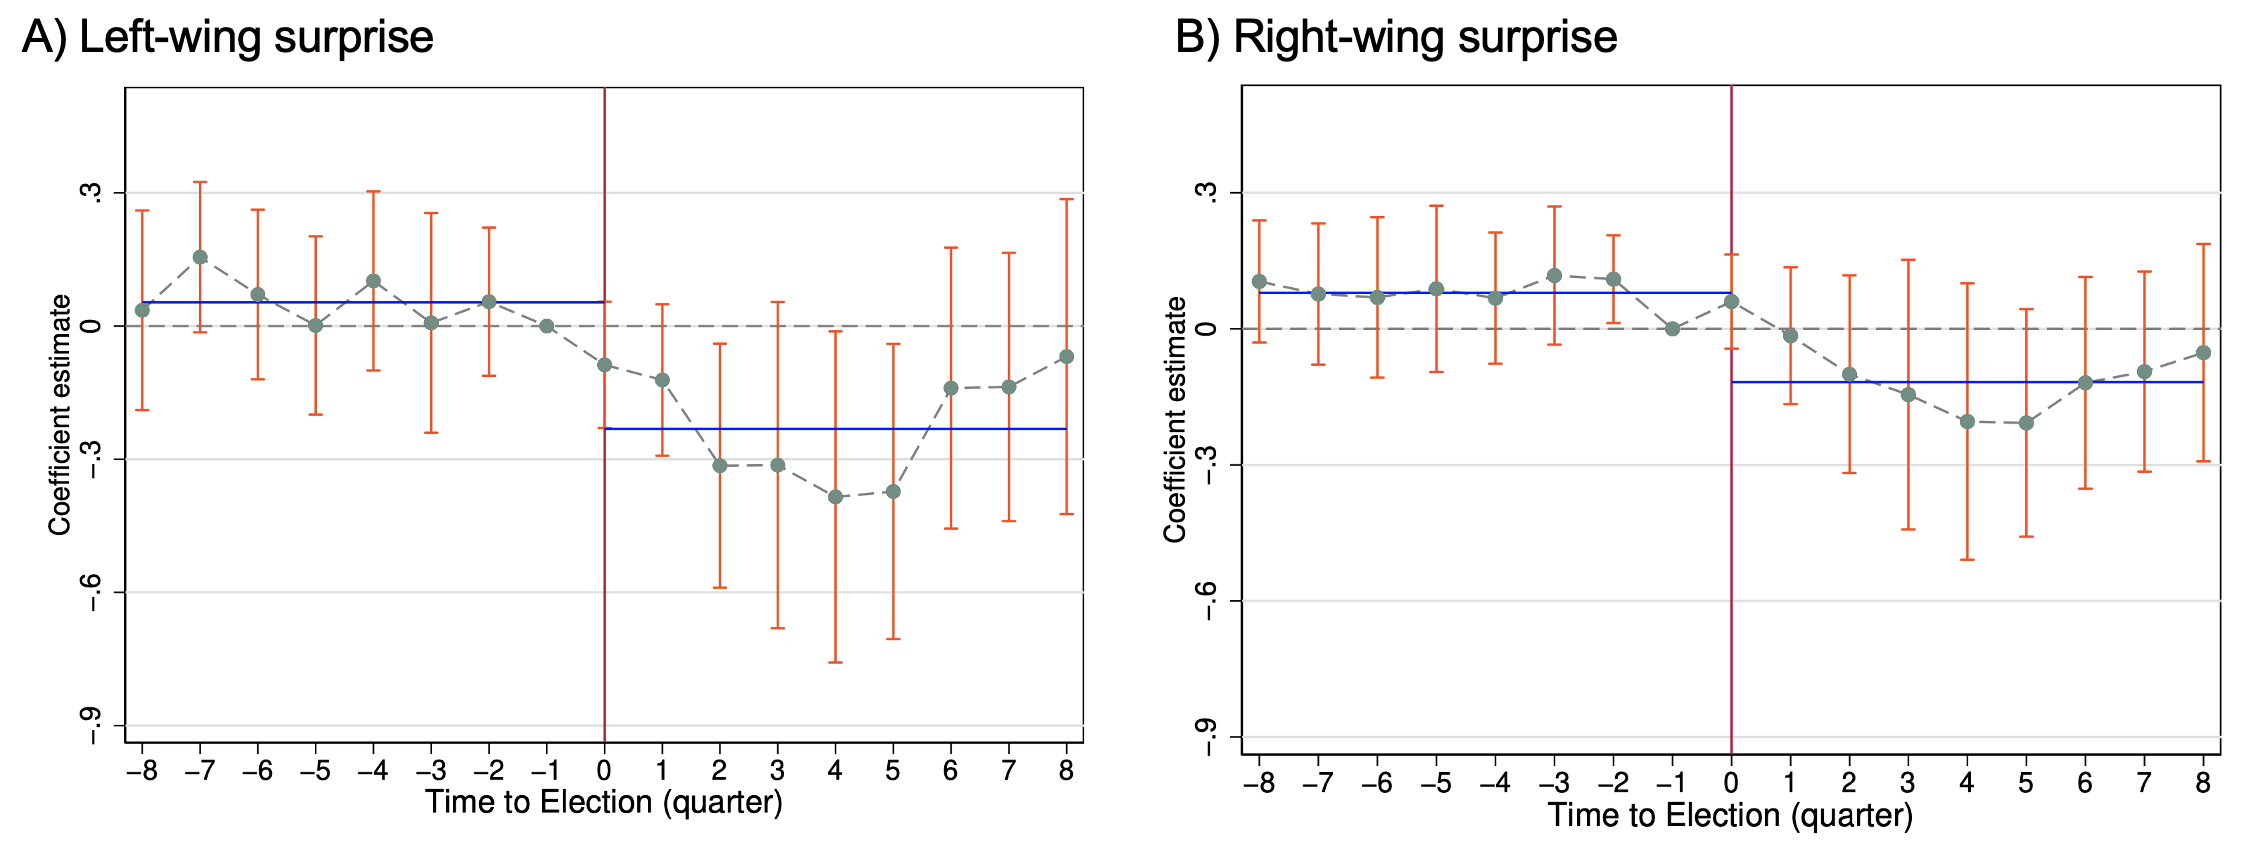
Finally, we consider whether economic activity is more/less sensitive to surprise movements of parties depending on their political ideology. This may be the case since different parties have different policy platforms, and an unexpected outcome may signal an unforeseen shift in policies which impact the economy. To operationalise this, we use data from the Parliaments and governments (ParlGov) database to construct separate electoral surprise measures for left-wing and right-wing parties. We then analyse the effects on economic activity using the same event study framework. Figure 3 presents the main results from this exercise. Although both left-wing (Panel A) and right-wing (Panel B) surprises are negatively associated with GDP growth in the post-election quarters, the effects for left-wing surprises are much stronger both quantitatively and in terms of statistical significance. In further analysis in the paper, we also show that the effects of electoral surprises are stronger in cases of transitions to left-wing governments. Furthermore, in such transitions, electoral surprises are associated with a lower likelihood of reforms which protect investor interests. The potential for fewer investor-friendly reforms may help explain the strong impact on investment growth and economic policy uncertainty we highlighted above.
Figure 3 Impact of politically signed electoral surprises on GDP growth
Notes: This figure plots regression results studying the effect of election surprises on year-on-year changes in real GDP at the quarterly frequency. The results are based on the sample of strong democracies, defined as countries with an average polity2 score above 9 in the three years prior to an election.
Conclusion
Although election polls have improved over time, recent episodes have shown they are still far from perfect. In this column, we document a new source of electorally induced cycles in economic activity using a new dataset of polling data across 51 countries. Electoral surprises – defined as average absolute deviations of polling predictions from final outcomes – can have significant (short-term) effects on economic activity in strong democracies. These effects materialise mainly via lower investment growth and higher economic policy uncertainty. The results suggest election polls are an important anchor for people’s policy expectations. As a result, there are clear economic benefits from making more accurate predictions, and initiatives to this end may be welfare enhancing.
References
Aidt, T S, F J Veiga and L G Veiga (2011), “Election results and opportunistic policies: A new test of the rational political business cycle model”, Public Choice 148(1-2): 21-44.
Akhmedov, A and E Zhuravskaya (2004), “Opportunistic political cycles: Test in a young democracy setting”, The Quarterly Journal of Economics 119(4): 1301-1338.
Baker, S R, N Bloom and S J Davis (2016), “Measuring economic policy uncertainty”, The Quarterly Journal of Economics 131(4): 1593-1636.
Bloom, N, M Floetotto, N Jaimovich, I Saporta-Eksten and S J Terry (2012), “Really Uncertain Business Cycles”, Econometrica 86(3): 1031-1065.
Browning, M and M D Collado (2001), “The response of expenditures to anticipated income changes: Panel data estimates”, American Economic Review 91(3): 681-692.
Coibion, O and Y Gorodnichenko (2012), “What can survey forecasts tell us about information rigidities”, Journal of Political Economy 120(1): 116-159.
Coibion, O and Y Gorodnichenko (2015), “Information rigidity and the expectations formation process: A simple framework and new facts”, American Economics Review 105(8): 2644-2678.
Coibion, O, Y Gorodnichenko and S Kumar (2018), “How Do Firms Form Their Expectations? New Survey Evidence”, American Economic Review 108(9): 2671-2713.
Fetzer, T and I Yotzov (2023), “(How) Do electoral surprises drive business cycles? Evidence from a new dataset”, CEPR Discussion Paper 18306.
Hassan, T A, S Hollander, L van Lent and A Tahoun (2019), “Firm-Level Political Risk: Measurement and Effects”, The Quarterly Journal of Economics 134(4): 2135-2202.
Hsieh, C-T (2003), “Do consumers react to anticipated income changes? Evidence from the Alaska Permanent Fund”, American Economic Review 93(1): 397-405.
Jennings, W and C Wlezien (2018), “Election polling errors across time and space”, Nature Human Behaviour 2(4): 276-283.
Link, S, A Peichl, C Roth and J Wohlfart (2023), “Information frictions among firms and households”, Journal of Monetary Economics 135: 99-115.
Rodden, J, S Davis, A Baksy, N Bloom and S Baker (2020), “Polarised elections raise economic uncertainty”, VoxEU.org, 22 December.
Rossi, B and T Sekhposyan (2016), “Macroeconomic Uncertainty Indices Based on Nowcast and Forecast Error Distributions”, American Economic Review 105(5): 650-655.
Roth, C and J Wohlfart (2020), “How do expectations about the Macroeconomy affect personal expectations and behavior?”, Review of Economics and Statistics 102(4): 731-748.
Scotti, C (2016), “Surprise and uncertainty indexes: Real-time aggregation of real-activity macro-surprises”, Journal of Monetary Economics 82(1093): 1-19.
