Housing and the associated heating, water and sewerage infrastructure carry a substantial environmental footprint. Yet, they tend to receive much less attention than energy use and associated emissions in industry and transportation. Moreover, these housing services currently occupy a sizable portion of households' disposable income as demonstrated in the results of the fourth wave of the Life in Transition Survey (a household survey administered across a large sample of emerging markets in Europe, the Caucasus, Central Asia and North Africa) which showed that respondents in these economies spend an average of 22% of their household income on utilities, up from 17% in 2016. This is significantly more than in Germany, and the figures for poorer households are higher still.
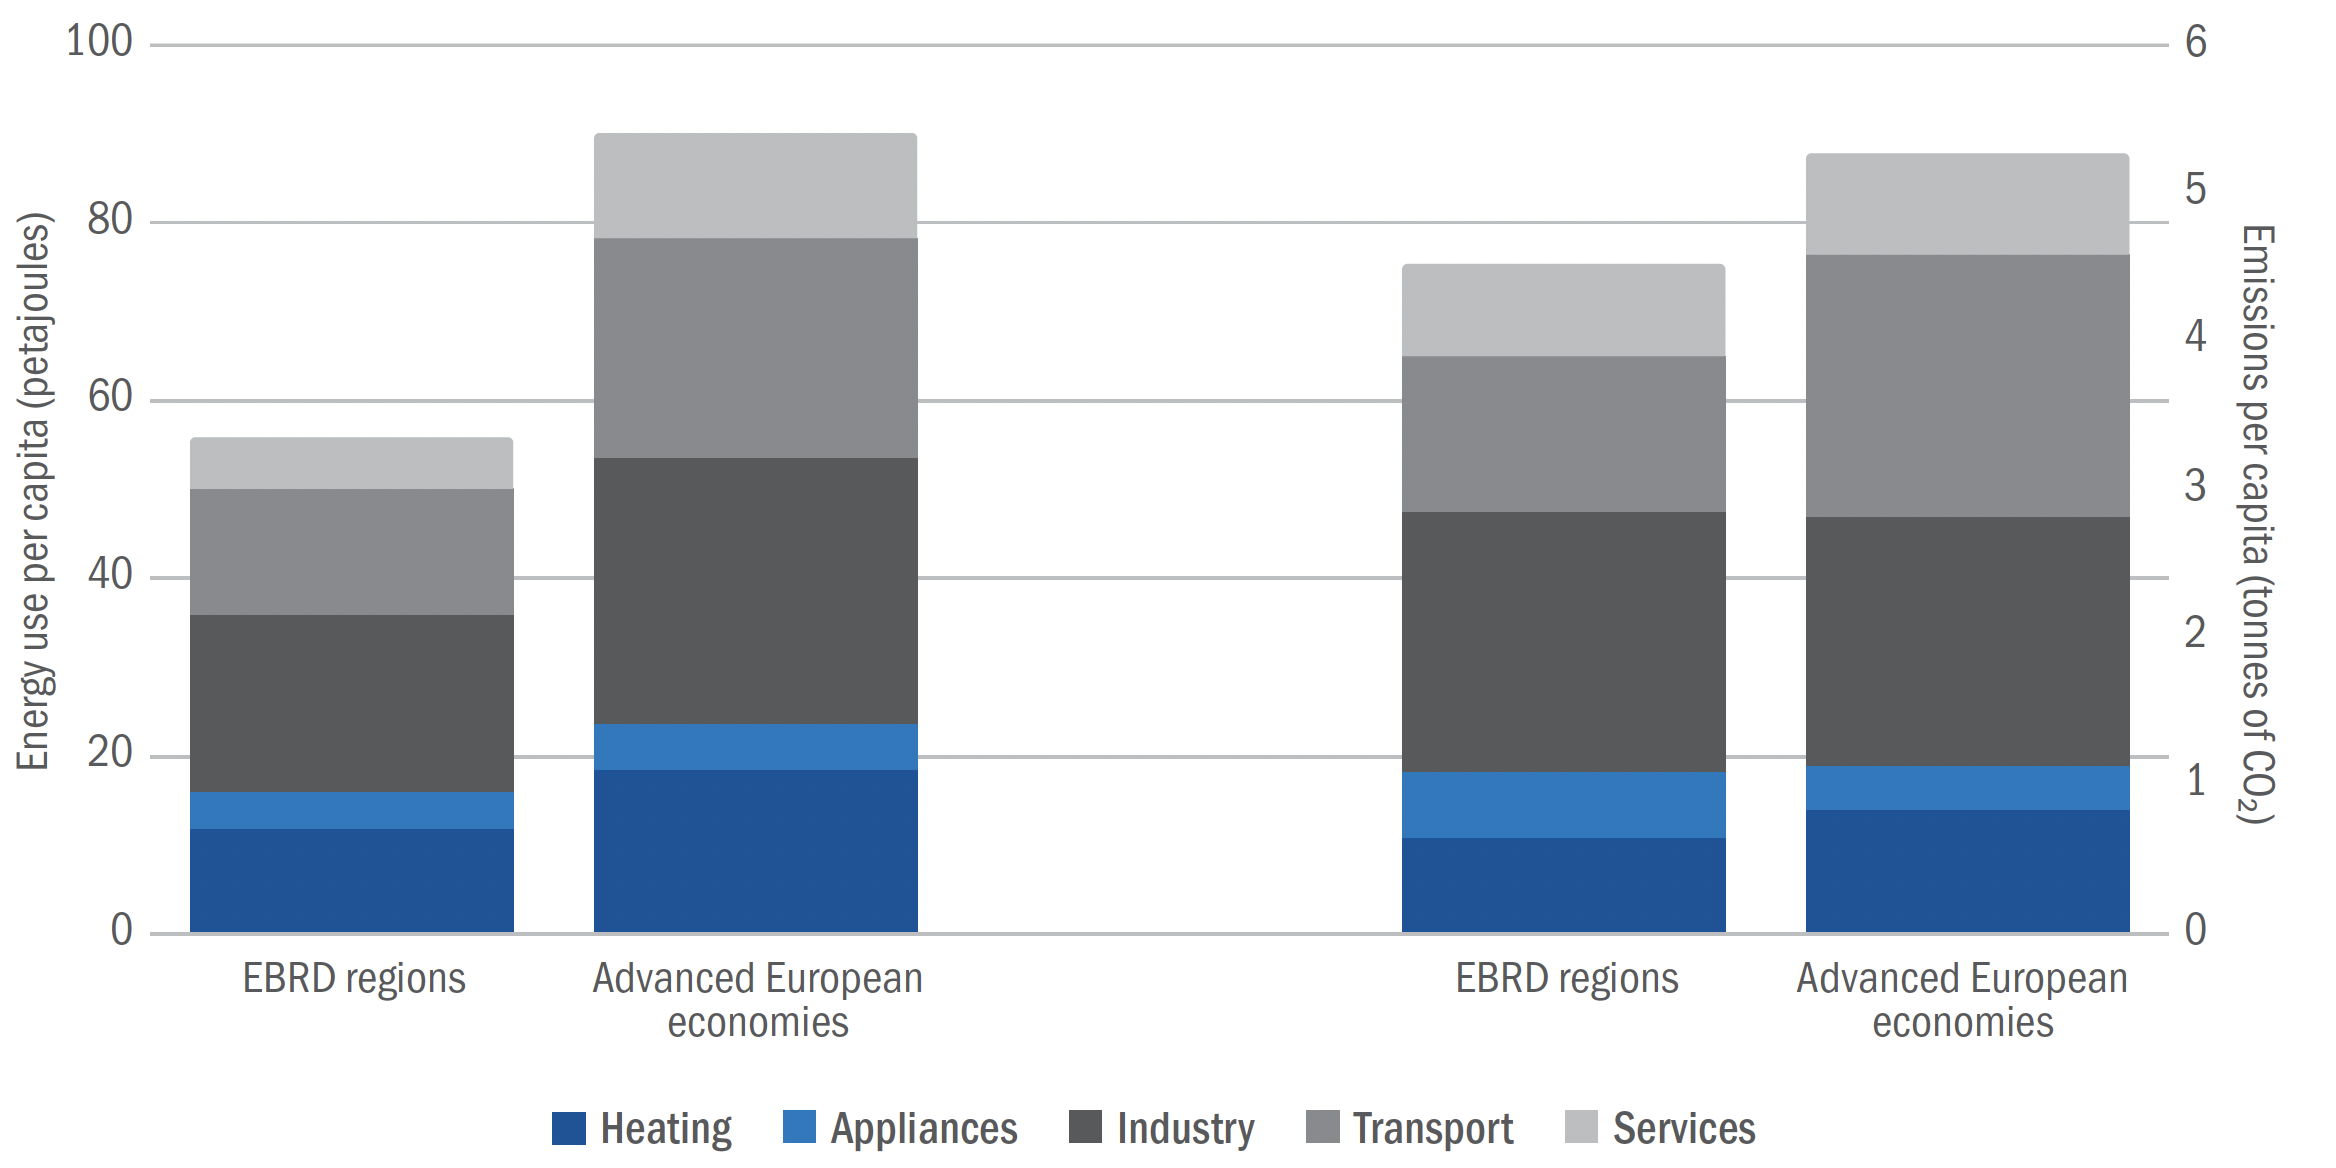
The residential sector accounts, on average, for 26% of total emissions and 29% of total energy use in these emerging markets, compared with 22% of total emissions and 26% of total energy use in advanced European comparators (Figure 1). In some economies, the residential sector is the single largest contributor to total emissions, surpassing industry, transport and other services. This is the case, for instance, in Azerbaijan, Kosovo, the Kyrgyz Republic, Moldova and Serbia.
In some cases, such as in economies in central Europe, residential emissions remain high even as industry is becoming greener—partly reflecting the upgrading of technology and decarbonisation policies focused on the manufacturing sector. In contrast, economies in eastern Europe and the Caucasus have industrial sectors which pollute more than their residential sectors. In some economies (particularly Kazakhstan and the Western Balkans), industrial and residential emissions are both high.
Figure 1 Residential sector energy use in emerging markets
Source: IEA and authors’ calculations.
Note: The data in this chart are estimates based on IEA surveys of statistical agencies and relate to 2021 or the latest available year. Residential energy use and emissions are broken down into “appliances” and “heating”. “Appliances” includes cooking, cooling and lighting; “heating” refers to all heating, including hot water (such as gas boilers). Data represent population weighted averages based on 27 emerging markets and 15 advanced European economies.
Energy use versus emissions
Differences in residential energy use explain only 22% of total cross-country variation in residential emissions per capita. For instance, residential emissions per capita in Kazakhstan are around 2.5 times the level seen in Estonia, despite Kazakhstan’s residential sector using only 4% more energy per capita. Similarly, Bosnia and Herzegovina, Poland and Serbia emit about twice as much as Slovenia and the Slovak Republic while using similar amounts of energy.
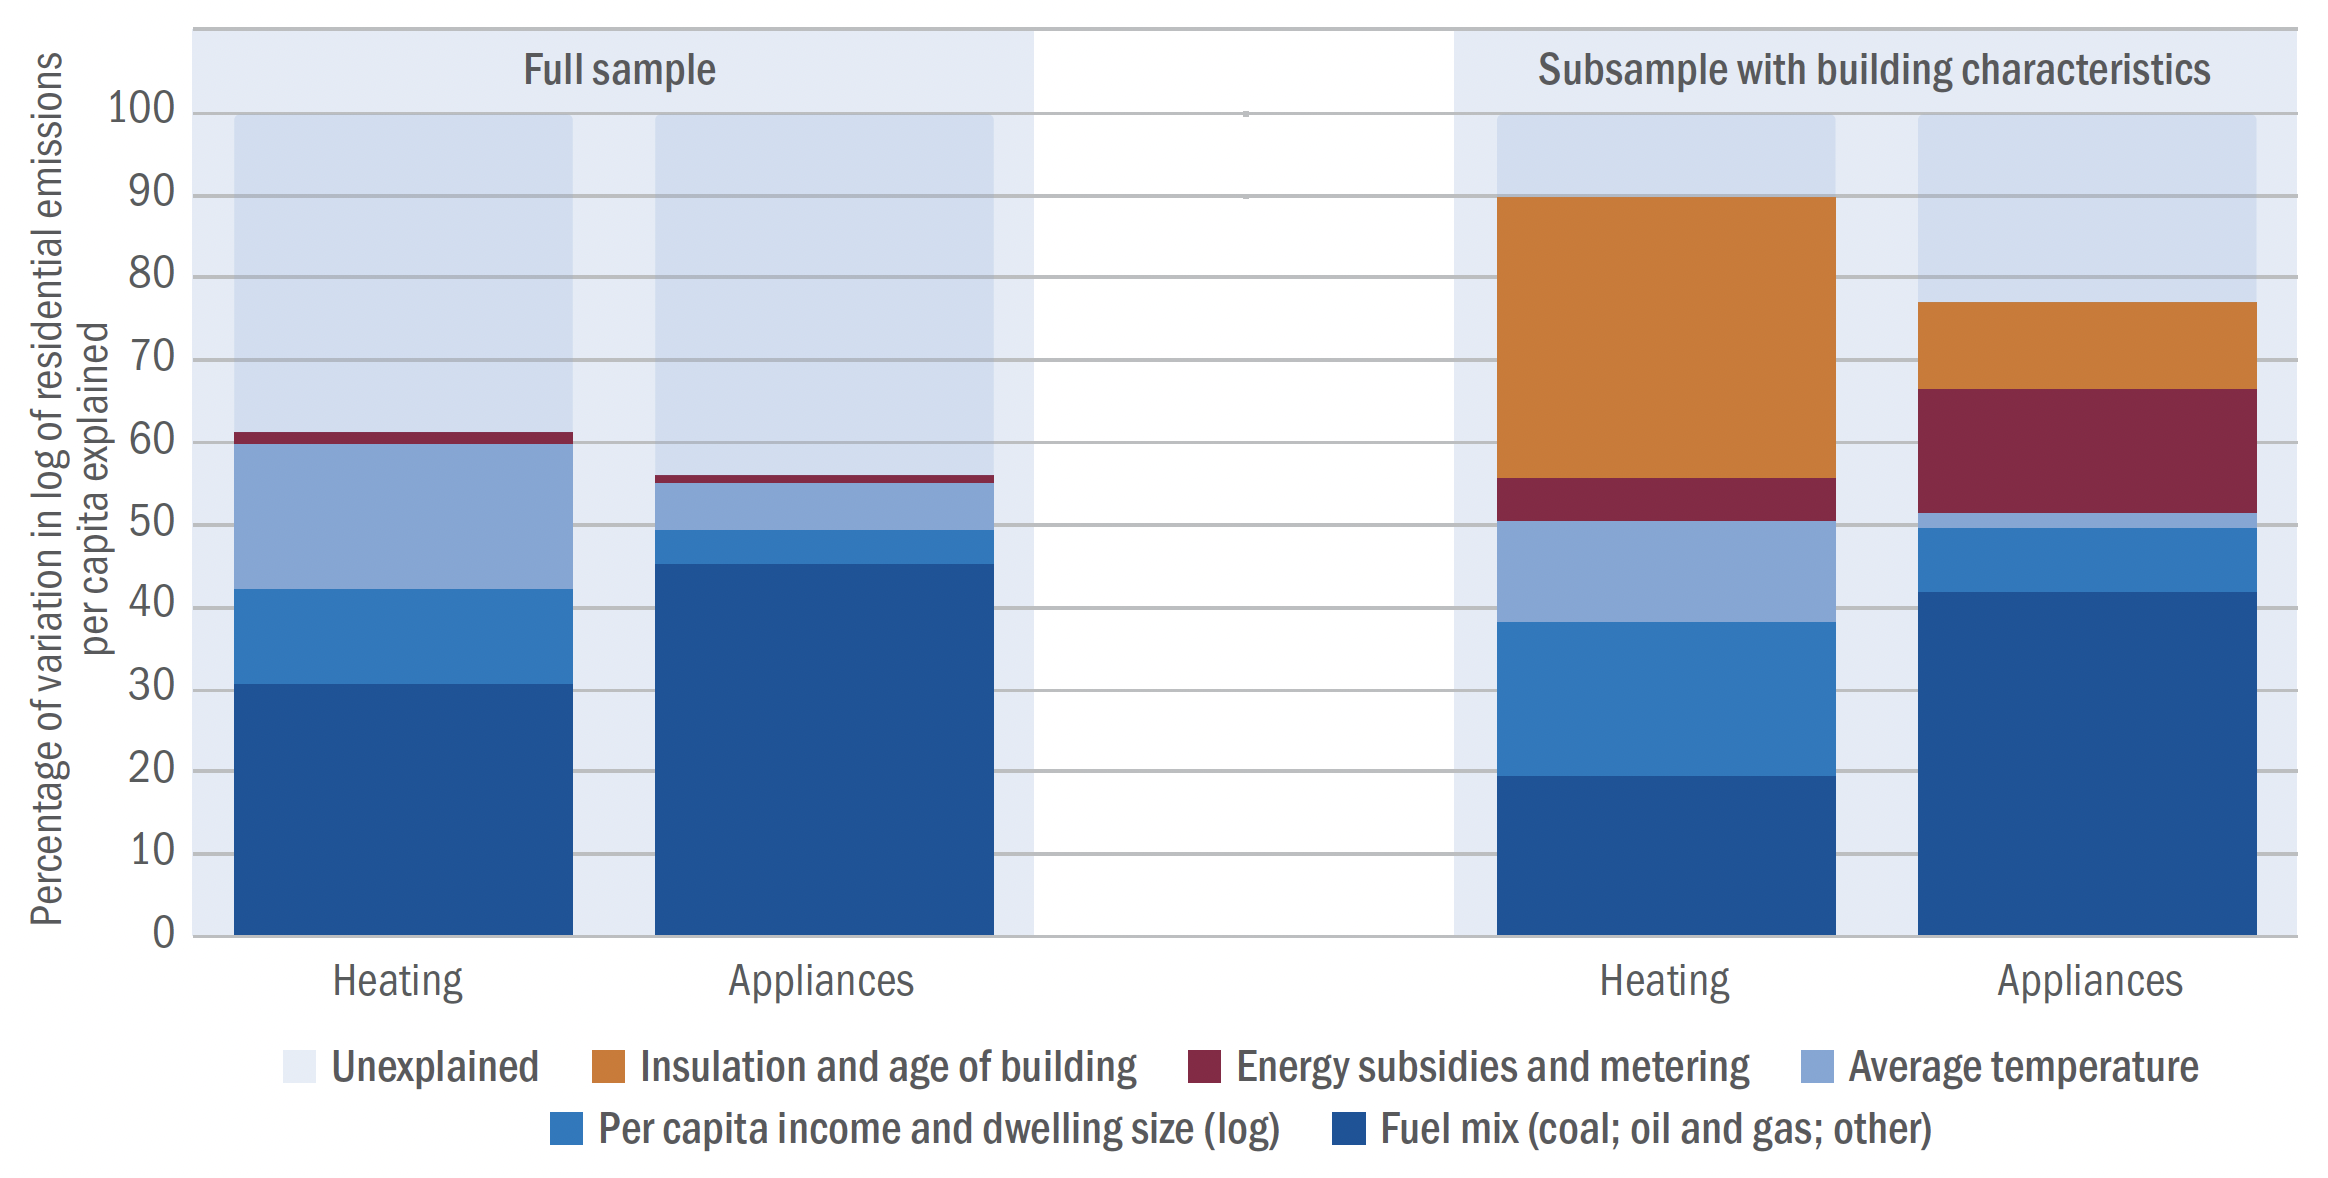
Motivated by this, the following regression analysis looks at the role of various factors and their relative importance in explaining differences in residential emissions per capita (see Chupilkin et al. 2023). The left-hand panel in Figure 2 focuses on key variables available for a larger sample of countries; the right-hand panel presents more detailed analysis based on a small sample of 20 economies, using information on building characteristics and metering derived from the Life in Transition Survey. This survey included a new module on housing, where respondents were asked, for instance, if their windows were double-glazed or if their heating and water were metered, using smart or regular meters.
Economies with high emissions for a given level of energy use tend to be more dependent on coal for their energy. In contrast, economies where renewables account for a large proportion of energy generation (such as Albania, which gets almost all of its energy from hydroelectric power, or Lithuania, where wind and solar power play a significant role) have relatively low emissions for the same level of energy use. On average, differences in the prevalence of various fossil fuels in countries’ fuel mixes can explain around 25% of total cross-country variation in heating-related emissions per capita, and over 40% for emissions caused by the operation of domestic appliances (such as refrigerators and air conditioning units). Higher income per capita and larger dwellings per capita significantly increase demand for heating, accounting for close to 20% of total variation in emissions. Likewise, colder and longer winters can also explain some of the cross-country variation in heating-related emissions (see also Cascarano and Natoli 2023 and Levinson 2013 on the effects of climate on energy demand and housing preferences).
Incentives to use energy efficiently, captured here as the use of metering and fossil fuel energy subsidies, explain 5% of total variation in heating-related emissions and 15% of emissions from appliances (see also Davis and Boomhower 2019, Fabrizio et al. 2013, Puller et al. 2022 and Tawk et al. 2022 on the importance of incentives for energy efficiency). Across countries, a doubling of fossil fuel subsidies (as a percentage of GDP) is associated with a 40% increase in heating-related emissions per capita. Smart meters that record consumption at a high frequency, can help residents to save costs by providing them with real-time information about energy use and by automatically sending meter readings to the energy supplier.
Older buildings are, on average, associated with much more emissions from heating. Building age and the percentage of buildings with double-glazed windows explain around a third of total variation in emissions from heating and a tenth of total variation in emissions from appliances.
Figure 2 Cross-country variation in residential emissions
Source: IEA, Life in Transition Survey IV and authors’ calculations.
Note: Data relate to 2021 or the latest available year. “Heating” refers to all heating, including hot water; “appliances” includes cooking, cooling and lighting. Shapley decomposition based on a linear model regressing the logarithm of residential emissions per capita on various explanatory variables. “Fuel mix” comprises the share of coal and the share of oil and gas in total energy production. GDP per capita is measured at market exchange rates. In the case of heating, the “average temperature” variable is the sum of all downward deviations in average monthly temperatures from 15°C across all months; in the case of appliances, it is the sum of all downward deviations in average monthly temperatures from 15°C across all months plus the sum of all upward deviations in average monthly temperatures from 21°C. “Dwelling size” is measured as the logarithm of square metres per capita. “Metering” is the average share of metered heating (in percentage terms) plus the average share of smart meters (so smart meters are counted twice). “Energy subsidies” is calculated as the inverse hyperbolic sine transformation of the fossil fuel subsidy as a percentage of GDP, based on data from the IMF and the IEA. “Insulation” is the percentage of buildings with at least some double-glazed windows plus the percentage of buildings with all windows double-glazed (so again, fully double-glazed buildings are counted twice).
Policy implications
The significant environmental footprint of housing is, to a large extent, shaped by countries’ use of coal and other fossil fuels for the generation of electricity. While greening the electricity mix can thus reduce the emissions associated with appliances, decarbonising heating in cold climates presents unique technological and policy challenges. Nevertheless, differences in average temperatures explain only 15% of total variation in heating-related emissions per capita across economies.
Historically, building codes have been the primary policy for residential energy efficiency (Puller et al. 2022). However, while these regulations have their merits, the influence of building codes is relatively limited as they typically only apply to new construction. Our analysis suggests that relatively low-cost, technologically straightforward improvements, such as installing meters for water and heating, upgrading conventional meters to smart meters and installing double-glazed windows, can help to significantly reduce residential emissions, taking the existing housing stock as given.
References
Cascarano, M and F Natoli (2023), “Hot temperatures: A new player in housing markets”, VoxEU.org, 17 September.
Chupilkin, M, Zs Kóczán and I Zamilov (2023), “Houses, homes and heating”, in Transition Report 2023-24: Transitions Big and Small, EBRD.
Davis, L and J Boomhower (2017), “Saving energy when it matters most: Measuring the benefits of energy efficiency investments with smart meter data”, VoxEU.org, 1 February.
Fabrizio, S, I Parry and B Clements (2013), “Now more than ever: Reforming energy subsidies throughout the world”, VoxEU.org, 27 April.
Levinson, A (2013), “California energy efficiency: Lessons for the rest of the world, or not?”, VoxEU.org, 9 August.
Puller, S, J West and E Myers (2020), “Mandatory energy efficiency disclosure in housing markets”, VoxEU.org, 15 November.
Tawk N, D Furceri, J D Ostry and P Deb (2022), “Creative destruction during crises: An opportunity for a cleaner energy mix”, VoxEU.org, 31 January.


