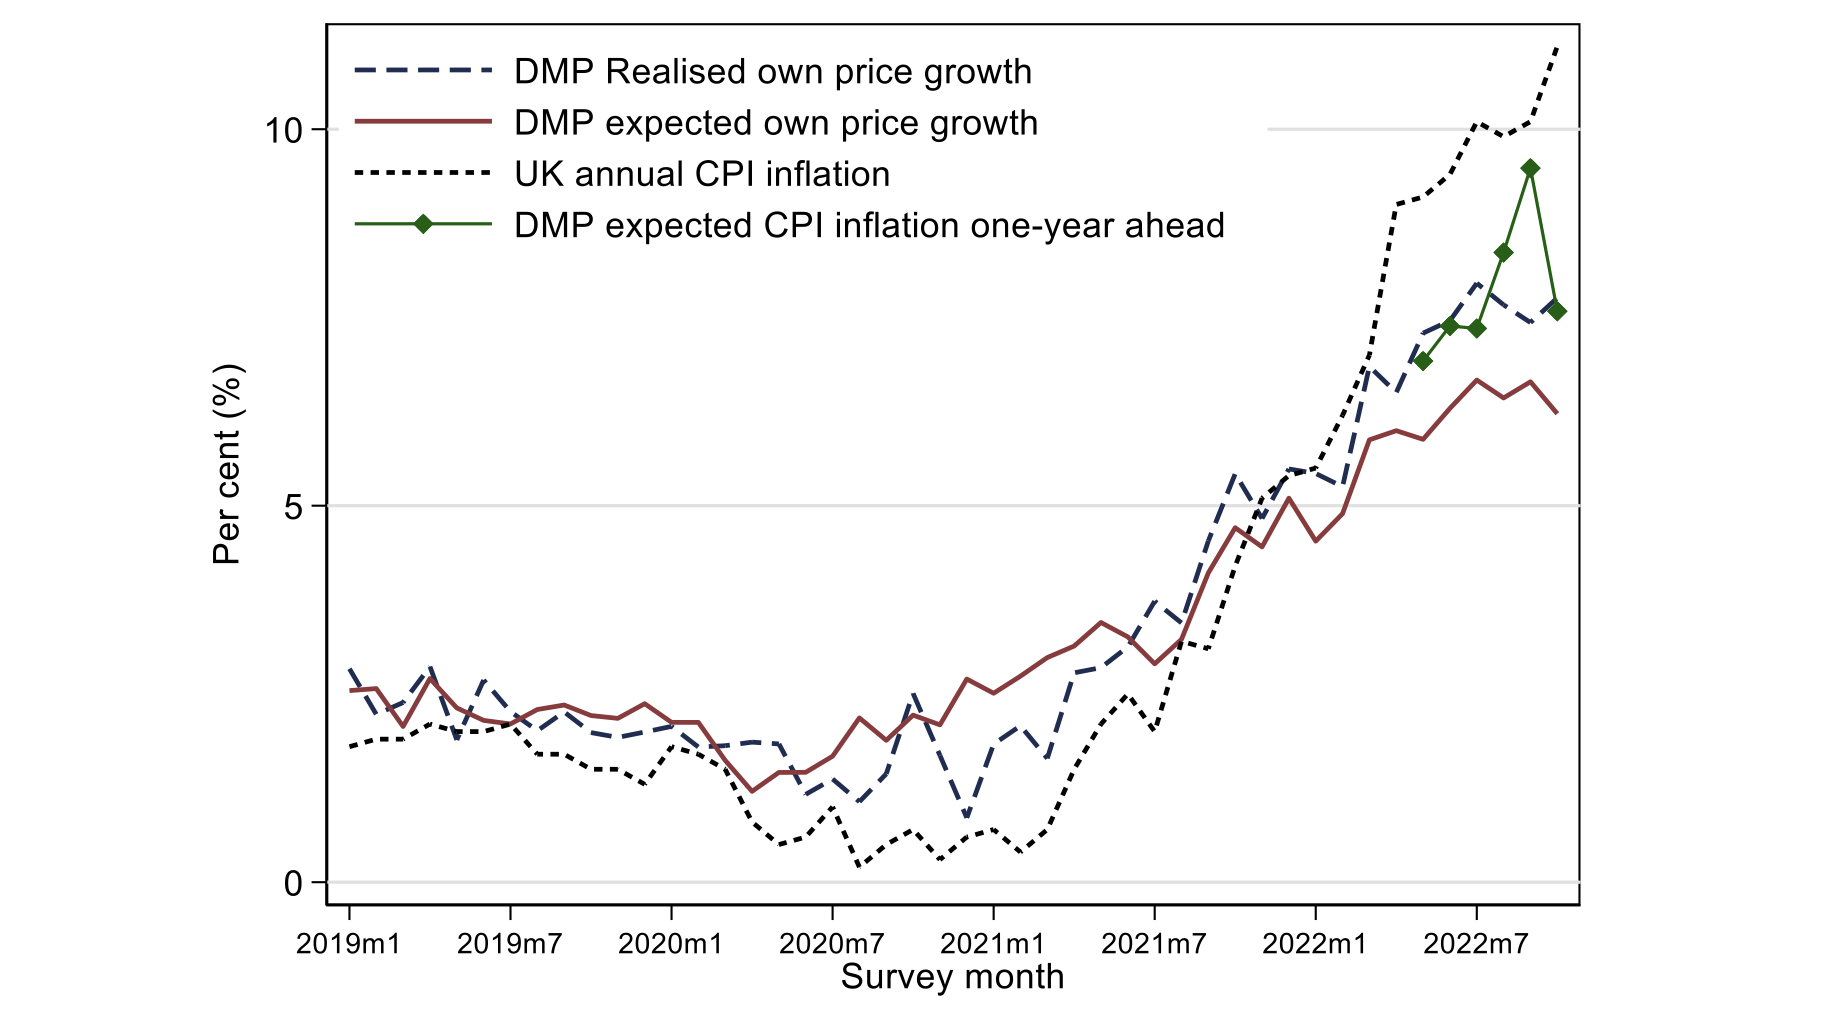
Inflation rates across advanced economies have increased significantly since the start of 2021. In the UK, annual Consumer Price Index (CPI) inflation was 11.1% in October 2022 (Figure 1). Multiple factors can account for the rise in inflation, including energy prices, supply disruptions, and labour market tightness (e.g. Bank of England 2022, Bunn et al. 2022a, 2022b, Fornaro and Romei 2022, Eo et al. 2022). Along with the rise in inflation, there has also been a significant increase in short-term inflation expectations. In October 2022, firms in the UK expected their own prices to increase by 6.2% over the next 12 months, and they expected CPI inflation to be 7.6% one year ahead (Figure 1).
In this column, we use new quantitative and text data from the Decision Maker Panel (DMP) survey to analyse the distribution of short-term inflation expectations and the factors driving expectations at the firm level.
In particular, over the August-October 2022 period, we asked firms to tell us, in their own words, the factors which they expect to influence their own prices as well as aggregate CPI inflation over the next year. Analysis of these comments reveals that expectations are currently influenced by many factors (both domestic and global) and are related to the quantitative expectations that firms report.
Figure 1 Trends in firm-level and aggregate prices
Notes: This figure presents the evolution of realised firm-level price growth over the past 12 months, expected firm-level price growth over the year ahead using data from the DMP, aggregate UK CPI inflation, and expected year-ahead CPI expectations by firms in the DMP.
Using textual data is an increasingly popular approach in economics.
It has been used to study many topics, including economic policy uncertainty (Baker et al. 2016), inflation narratives (Andre et al. 2021), and economic reforms (Arezki et al. 2020).
In the context of surveys, Ferrario and Stantcheva (2022a, 2022b) emphasise the benefits of open-ended text questions. These questions avoid common concerns in surveys, such as framing effects, and do not limit respondents to a pre-defined list of options. We follow this approach and ask panel members of the DMP two separate questions: (1) “In your own words, what are the main factors that will affect how you set your prices over the next 12 months?” and (2) “In your own words, what are the main factors that you expect will affect the evolution of aggregate CPI inflation over the next 12 months?”. Over the August-October 2022 period, we have received over 1,000 responses to each question, forming the main corpus for our analysis.
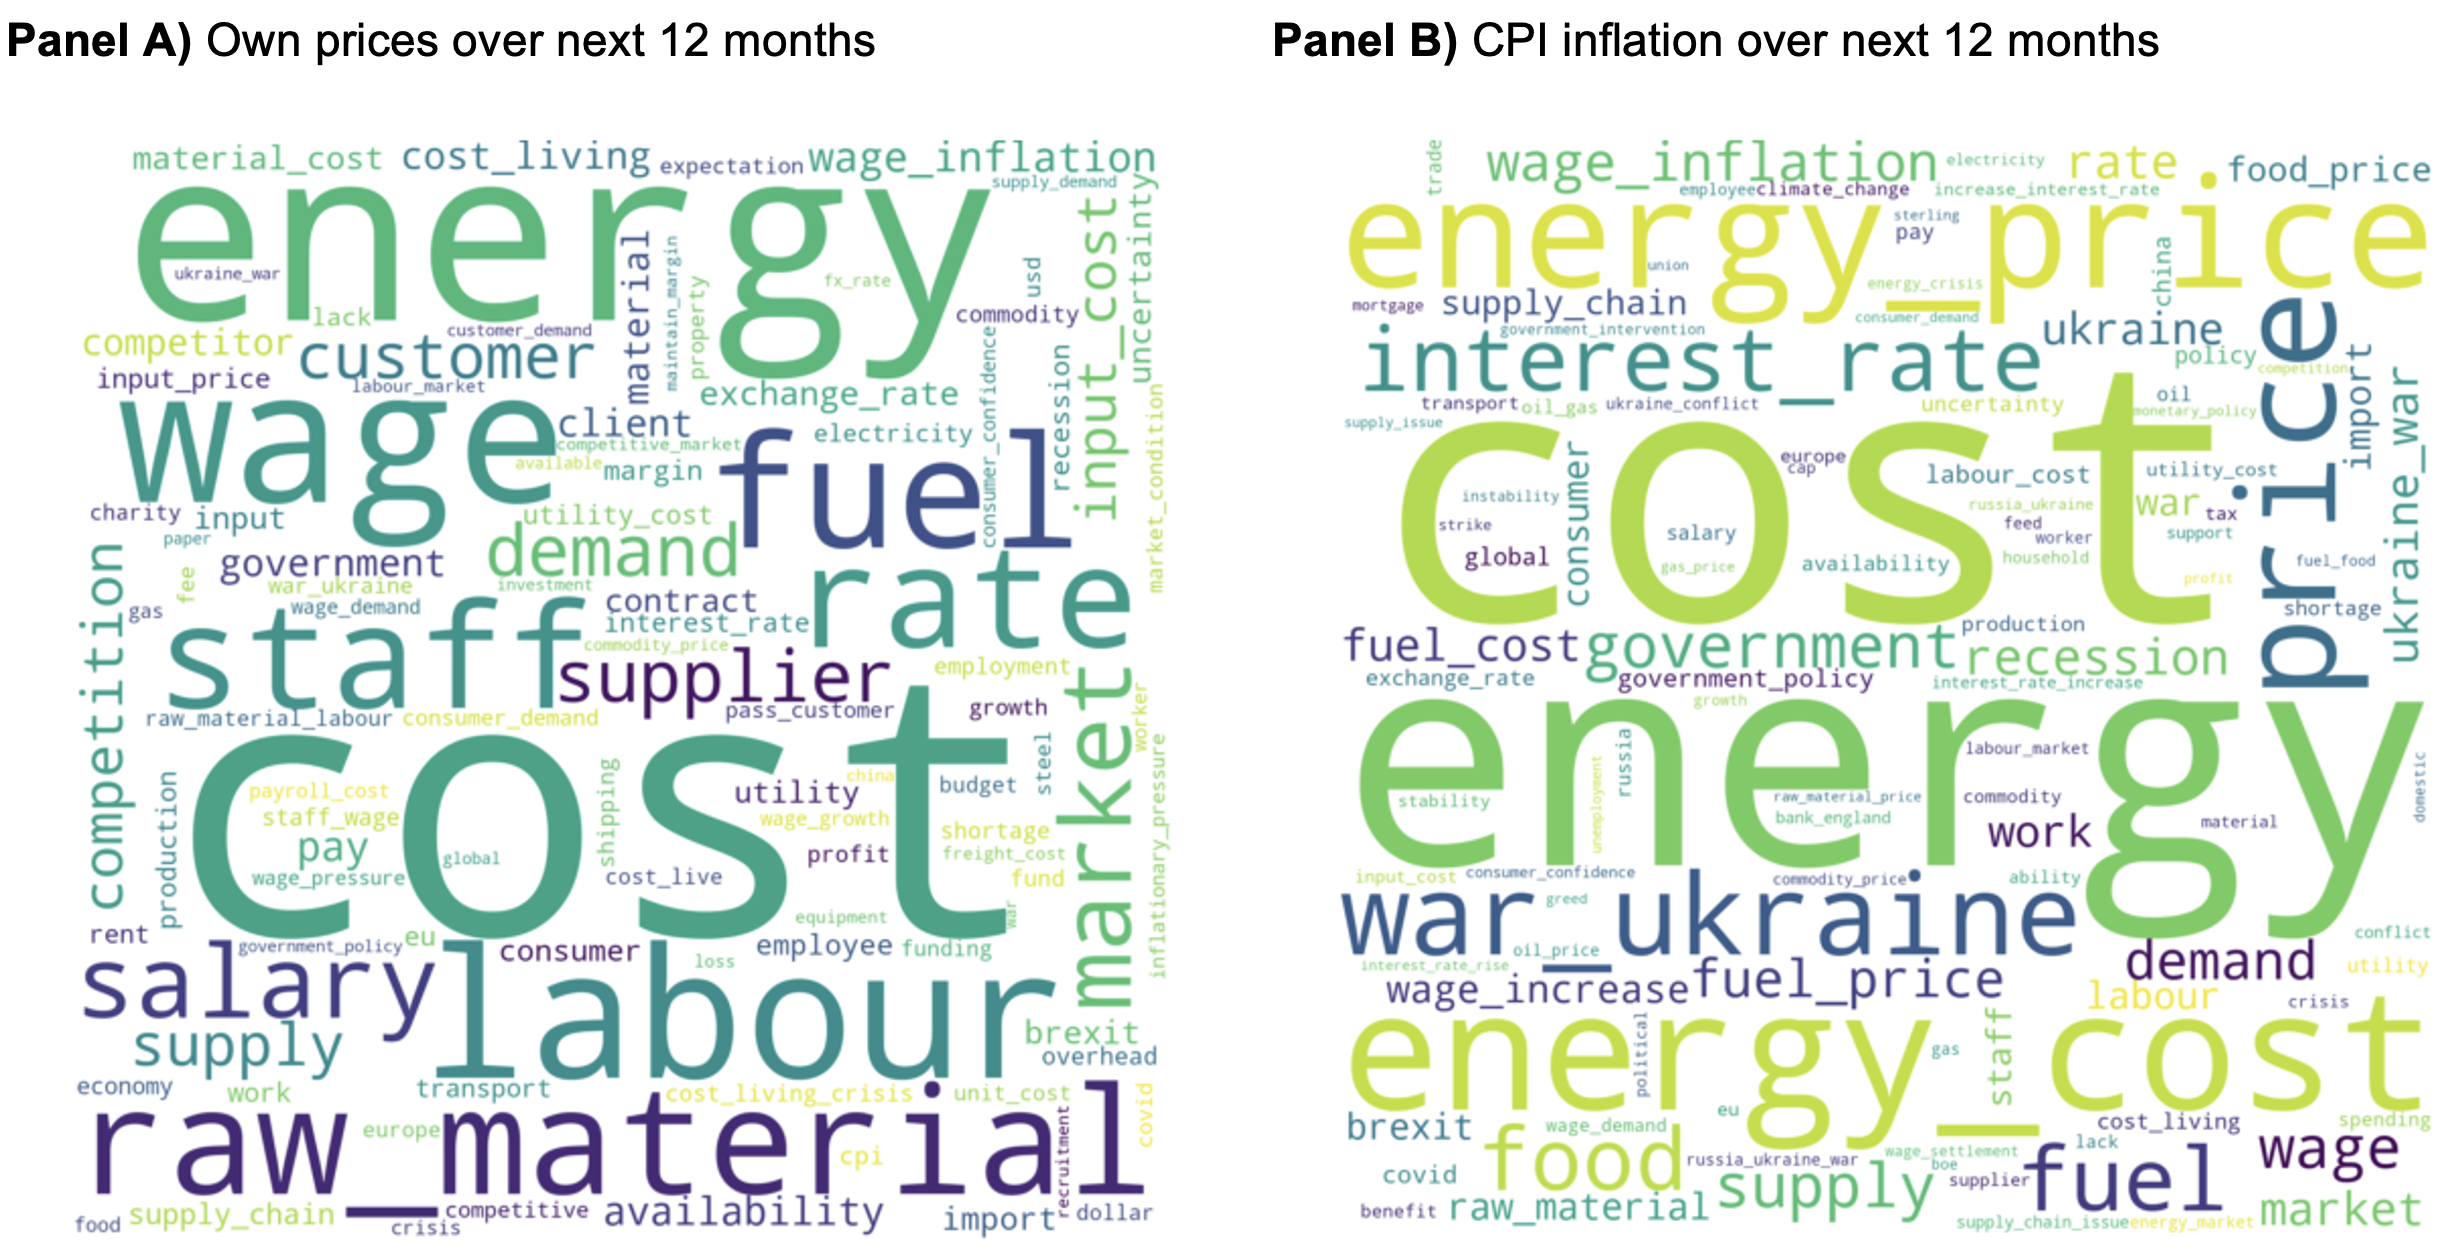
We begin analysing the responses with word clouds of the most frequently cited terms. After some standard pre-processing steps, Figure 2 presents these word clouds for both questions. An unsurprising collection of factors appears to be affecting firms’ own price expectations (Panel A). Supply-side factors are prominent (as seen in terms such as ‘cost’, ‘energy’, ‘raw_material’, ‘input_cost’) as well as labour market considerations (e.g. ‘labour’, ‘wage’, ‘salary’). However, demand-side and competition factors are also frequently cited, such as references to ‘market (forces)’, ‘competition’, and ‘demand’. The word cloud for CPI expectations is somewhat different (Panel B). It is dominated by references to energy, although labour market references are also present in a few variations. References to policy (both monetary and government) are also present in Panel B, whereas much less so in Panel A. Overall, although word clouds are useful, it is difficult to distinguish the relative importance of different factors. To do this, we next develop a set of categories and manually classify the responses into one (or more) bins.
Figure 2 Word clouds of text comments, August-October 2022
Notes: The world cloud in Panel A is based on 1,217 responses to the question: “In your own words, what are the main factors that will affect how you set your prices over the next 12 months?” The word cloud in Panel B is based on 1,072 responses to the question: “In your own words, what are the main factors that you expect will affect the evolution of aggregate CPI inflation over the next 12 months?”. Standard pre-processing of the comments includes tokenisation, lemmatisation, removing stop words, and allowing for bigrams/trigrams.
We classify firm responses to both text questions into 15 categories: energy; labour; food; costs (excluding food, energy); Ukraine/Russia war; geopolitics (excluding Ukraine/Russia war); policy (monetary); policy (excluding monetary); supply issues/shortages; exchange rates; Brexit; demand; competition; aggregate prices; and other. The categories are fairly comprehensive; over 90% of comments can be classified into at least one category (excluding ‘other’). Furthermore, these categories are consistent with quantitative information we collect from respondents. For example, firms which cite the labour category have higher expected wage growth; firms which cite the ‘energy’ category have higher industry energy costs (based on ONS Supply and Use tables); and firms which cite the ‘exchange rate’ category are more likely to be importers or exporters. This evidence helps validate our classification scheme as well as the quality of the responses received.
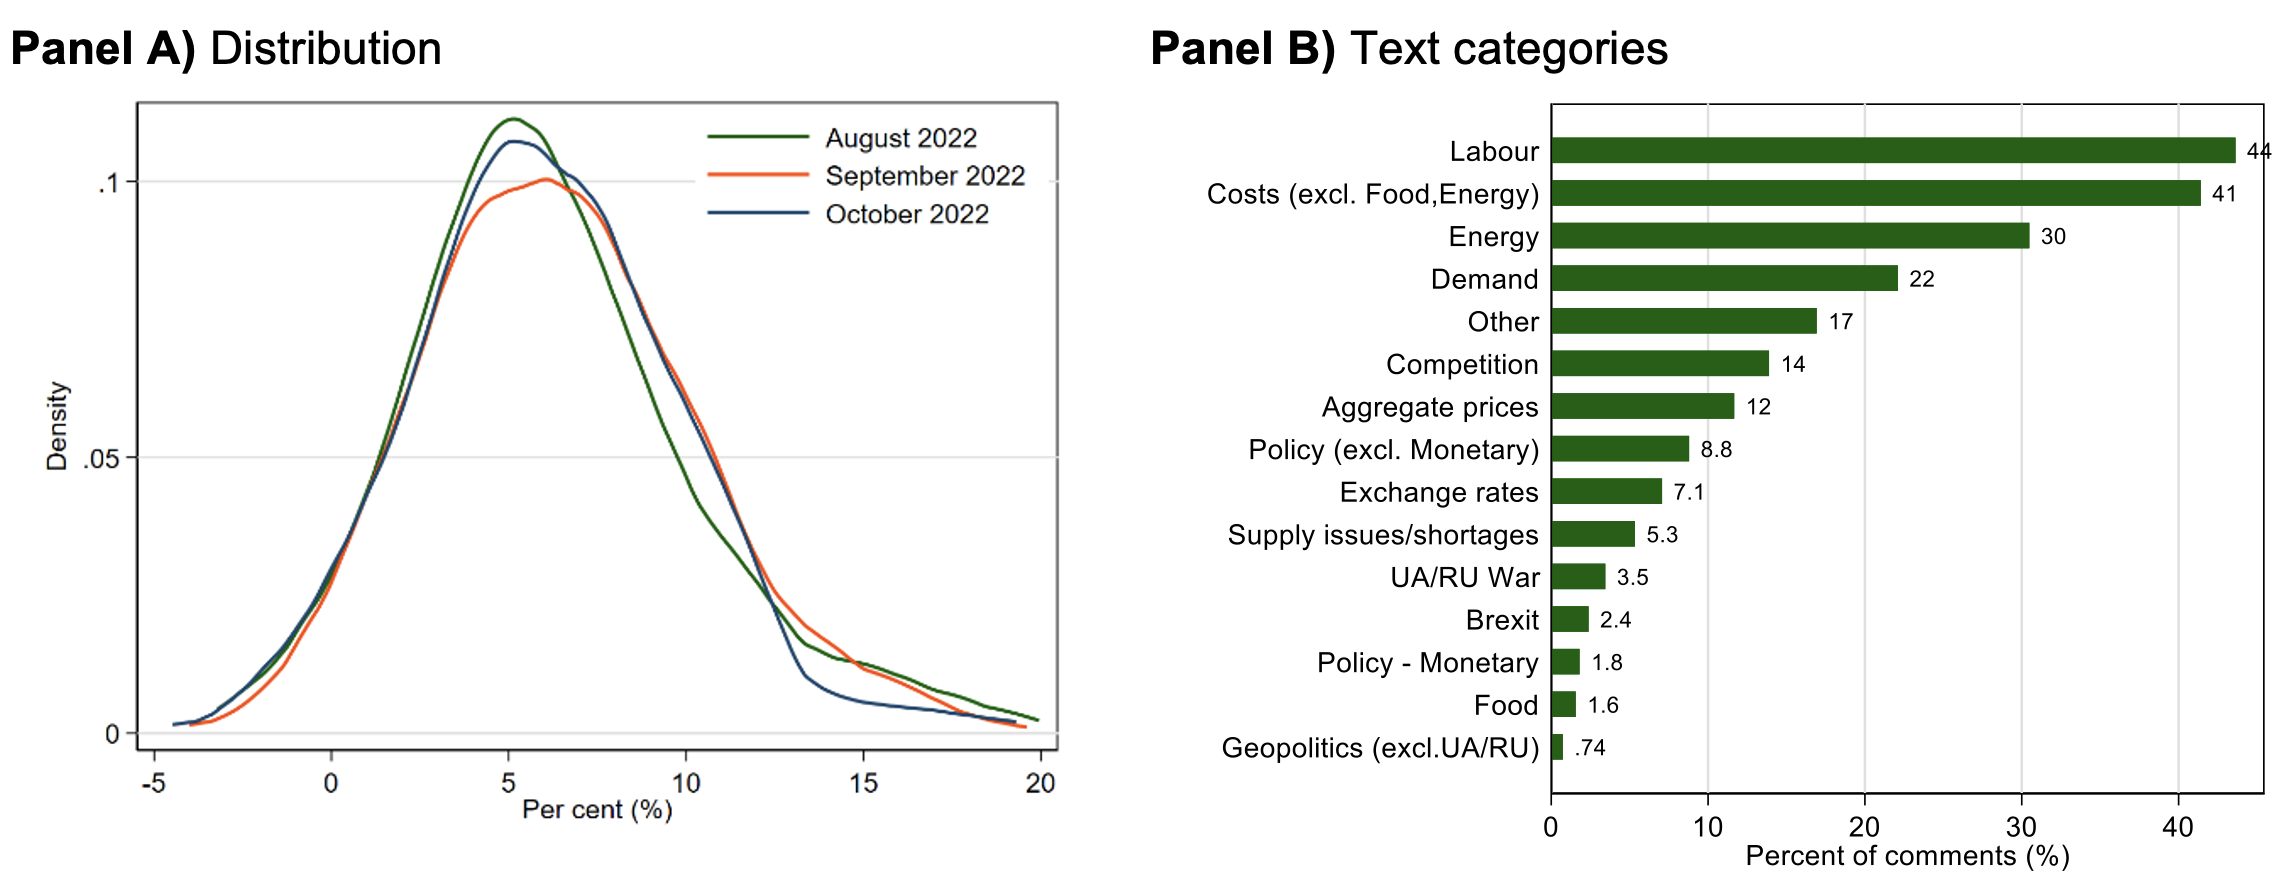
Figure 3 summarises firms’ own price expectations over the August-October period. Panel A shows that expectations over the next 12 months are dispersed, ranging between 0.3% and 13.5% at the 5th and 95th percentiles, respectively.
Panel B presents the distribution of text categories. In line with the word cloud in Figure 2 Panel A, the labour market as well as energy and non-energy costs are the most frequently cited factors, followed by demand and competition considerations. Interestingly, relatively few firms cite economic policy as a direct factor which influences their own price expectations. Finally, we note that most firms are affected by multiple factors, with around two-thirds citing two or more categories, and 30% citing three or more categories.
Figure 3 Firm own price expectations, August-October 2022
Notes: The distributions in Panel A are based on the question ‘Looking ahead, 12 months from now, what approximate % change in your average price would you expect in each of the following scenarios: lowest, low, middle, high, highest’. Respondents were then asked to assign a probability to each scenario. The results in Panel B are based on responses to the question: “In your own words, what are the main factors that will affect how you set your prices over the next 12 months?”
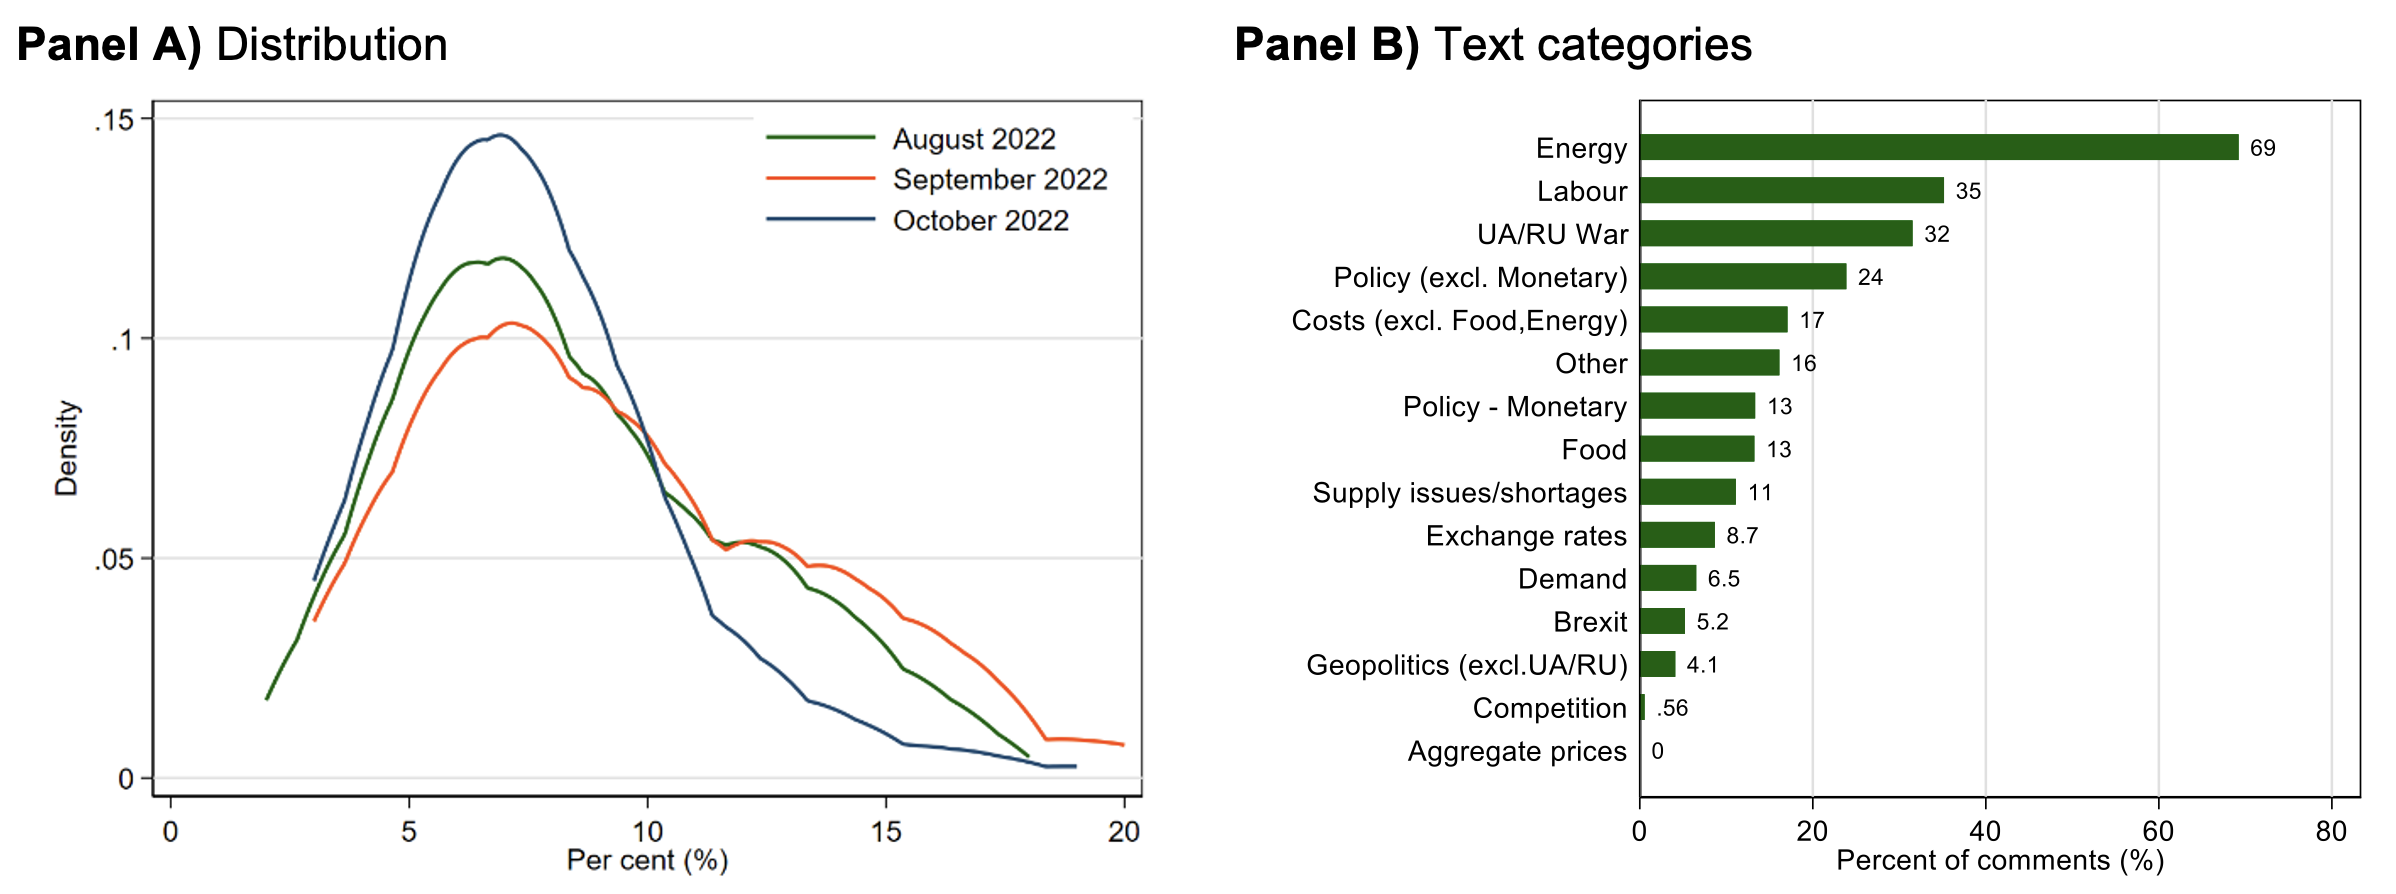
Figure 4 presents the corresponding results for CPI expectations one year ahead. CPI expectations are elevated, but below current CPI inflation (Figure 1). On average over the August-October period, firms expected CPI inflation to be 8.5% in 12 months’ time, ranging between 4% and 15% at the 5th and 95th percentiles, respectively (Figure 4 Panel A). There was a noticeable narrowing of the right tail of the distribution in the October survey, possibly linked to the energy support schemes announced by the Government on 8 September 2022.
The distribution of firm comments in Panel B shows that an overwhelming majority (69%) of firms cite energy as a factor influencing their CPI expectations. The second most-cited factor (labour) was mentioned by 35% of firms. The dominance of energy in CPI expectations is consistent with its weight in the consumer basket, with a significant proportion of the recent increases in inflation being driven by the energy sector (Bank of England 2022). Finally, in contrast to Figure 3, we note a relatively larger proportion of firms referencing economic policy regarding CPI expectations, with 24% referencing fiscal and 13% citing monetary policies.
Figure 4 Firm CPI expectations, August-October 2022
Notes: The distributions in Panel A are based on the question: ‘As a percentage, what do you think the annual CPI inflation rate will be in the UK one year from now?’ The results in Panel B are based on responses to the question: “In your own words, what are the main factors that you expect will affect the evolution of aggregate CPI inflation over the next 12 months?”.
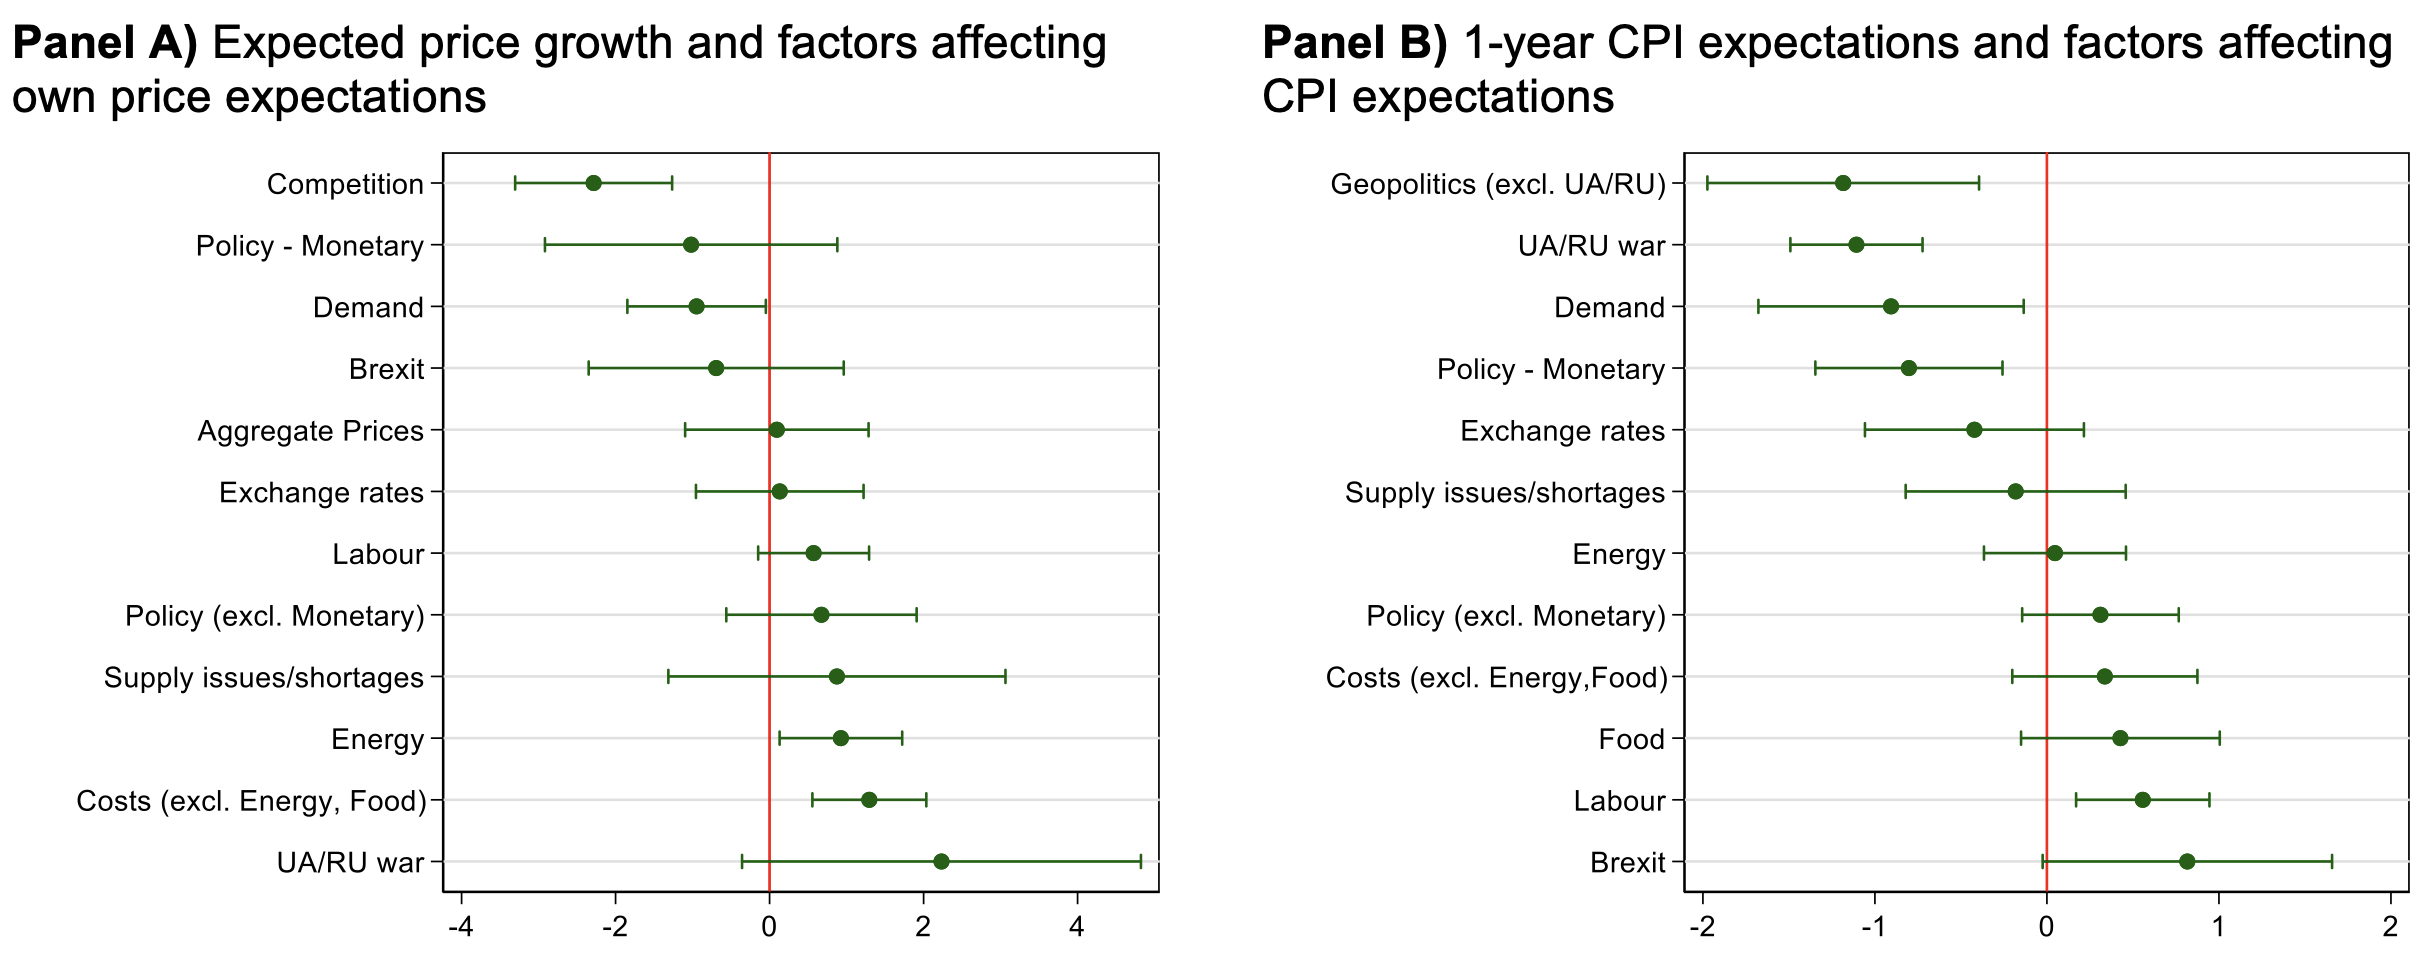
Lastly, we analyse the relationship between text categories and reported expectations. In particular, we are interested whether some factors are associated with higher or lower expectations compared to others. Figure 5, Panel A suggests there are significant differences across categories. Firms citing ‘competition’ and ‘demand’ factors have lower price expectations, on average, which could be explained by them being in more competitive sectors or selling more price elastic products.
Meanwhile, firms referencing costs and energy expect to have higher price growth over the next year. In Panel B, we show that CPI expectations also vary in significant ways depending on the factors cited. References to demand-side factors are again associated with lower expectations, whereas references to labour markets are correlated with higher CPI expectations.
Interestingly, references to monetary policy are significantly associated with lower CPI expectations.
These findings are robust to the inclusion of all factors simultaneously as well as using all firms which responded to the survey, not only those who left text comments.
Figure 5 Impact of text categories on expectations
Notes: The results in Panels A are based 1,217 responses to the question: “In your own words, what are the main factors that will affect how you set your prices over the next 12 months?” The results in Panel B are based on 1,072 responses to the question: “In your own words, what are the main factors that you expect will affect the evolution of aggregate CPI inflation over the next 12 months?”. The coefficient represent separate regressions for each factor based only on firms which left a comment and 95% confidence levels are reported. Categories which have been cited less than 20 times have been excluded.
Conclusion
Inflation rates and inflation expectations in the UK are at the highest levels in several decades. Decomposition of inflation trends generally use aggregate data or indirect methods. In this column, we take a more direct and granular approach by asking firms about the factors which affect their own price expectations and CPI expectations in the short term. Firms’ own price expectations are influenced by the labour market, input costs, energy, and, to a lesser extent, demand-side factors. CPI expectations are dominated by energy cost considerations. Furthermore, these categories are related in meaningful ways to the quantitative expectations reported by firms. Future work will explore how expectations evolve over time, especially as domestic and international conditions begin to stabilise.
References
Altig, D E, S Baker, J M Barrero, N Bloom, P Bunn, S Chen, S Davis, J Leather, B Meyer, E Mihaylov, P Mizen, N Parker, T Renault, P Smietanka and G Thwaites (2020), “Economic uncertainty in the wake of the Covid-19 pandemic”, VoxEU.org, 24 July.
Anayi, L, N Bloom, P Bunn, P Mizen, G Thwaites and I Yotzov (2022), “The impact of the war in Ukraine on economic uncertainty”, VoxEU.org, 16 April.
Andre, P, I Haaland, C Roth and J Wohlfart (2021), “Inflation narratives”, VoxEU.org, 23 December.
Arezki, R, S Djankov, H Nguyen and I Yotzov (2020), “Reform chatter and democracy”, VoxEU.org, 24 August.
Baker, S R, N Bloom and S J Davis (2016), “Measuring Economic Policy Uncertainty”, The Quarterly Journal of Economics 131(4): 1593-1636.
Bank of England (2022), Monetary Policy Report, November.
Bloom, N, S Chen and P Mizen (2018), “Rising Brexit uncertainty has reduced investment and employment”, VoxEU.org, 16 November.
Bloom, N, P Bunn, S Chen, P Mizen and P Smietanka (2020a), “Brexit uncertainty has fallen since the UK general election”, VoxEU.org, 25 February.
Bottone, M, C Conflitti, M Riggi and A Tagliabracci (2021), “Firms’ inflation expectations and pricing strategies during Covid-19”, VoxEU.org, 30 June.
Bunn, P, D E Altig, L Anayi, J M Barrero, N Bloom, S Davis, B Meyer, E Mihaylov, P Mizen and G Thwaites (2021), “Covid-19 uncertainty: A tale of two tails”, VoxEU.org, 16 November.
Bunn, P, L Anayi, N Bloom, P Mizen, G Thwaites and I Yotzov (2022a), “Firming up price inflation”, NBER Working Paper 30505.
Bunn, P, L Anayi, N Bloom, P Mizen, G Thwaites and I Yotzov (2022b), “Firming up price inflation”, VoxEU.org, 26 August.
Christelis, D, D Georgarakos, T Jappelli and M van Rooij (2020), “Trust in the central bank and inflation expectations”, ECB Working Paper Series No 2375.
Eo, Y, L Uzeda and B Wong (2022), “Goods inflation is likely transitory, but upside risks to longer-term inflation remain”, VoxEU.org, 29 April.
Ferrario, B and S Stantcheva (2022a), “Eliciting people’s first-order concerns: Text analysis of open-ended survey questions”, VoxEU.org, 8 March.
Ferrario, B and S Stantcheva (2022b), “Eliciting People’s First-Order Concerns: Text Analysis of Open-Ended Survey Questions”, AEA Papers and Proceedings 112: 163-169.
Fornaro, L and F Romei (2022), “Understanding the global rise in inflation”, VoxEU.org, 27 May.
Gentzkow, M, B Kelly and M Taddy (2019), “Text as Data”, Journal of Economic Literature 57(3): 535-574.
Paloviita, M and E Stanisławska (2021), “How euro area consumers adjust their medium-term inflation expectations in turbulent times”, VoxEU.org, 26 November.
Yotzov, I, N Bloom, P Bunn, P Mizen, P Smietanka and G Thwaites (2021), “What matters to firms? New insights from survey text comments”, Bank Underground, 20 April.


