One notable consequence of the Covid-19 pandemic was a surge in global supply chain pressures, reflecting a sharp imbalance between supply and demand. Containment measures – such as factory shutdowns, widespread lockdowns, and mobility restrictions – propagated across logistic networks and resulted in supply disruptions, rising shipping costs, and prolonged delivery times. These supply pressures intensified as economies strongly resumed their activities once the pandemic crisis began to subside.
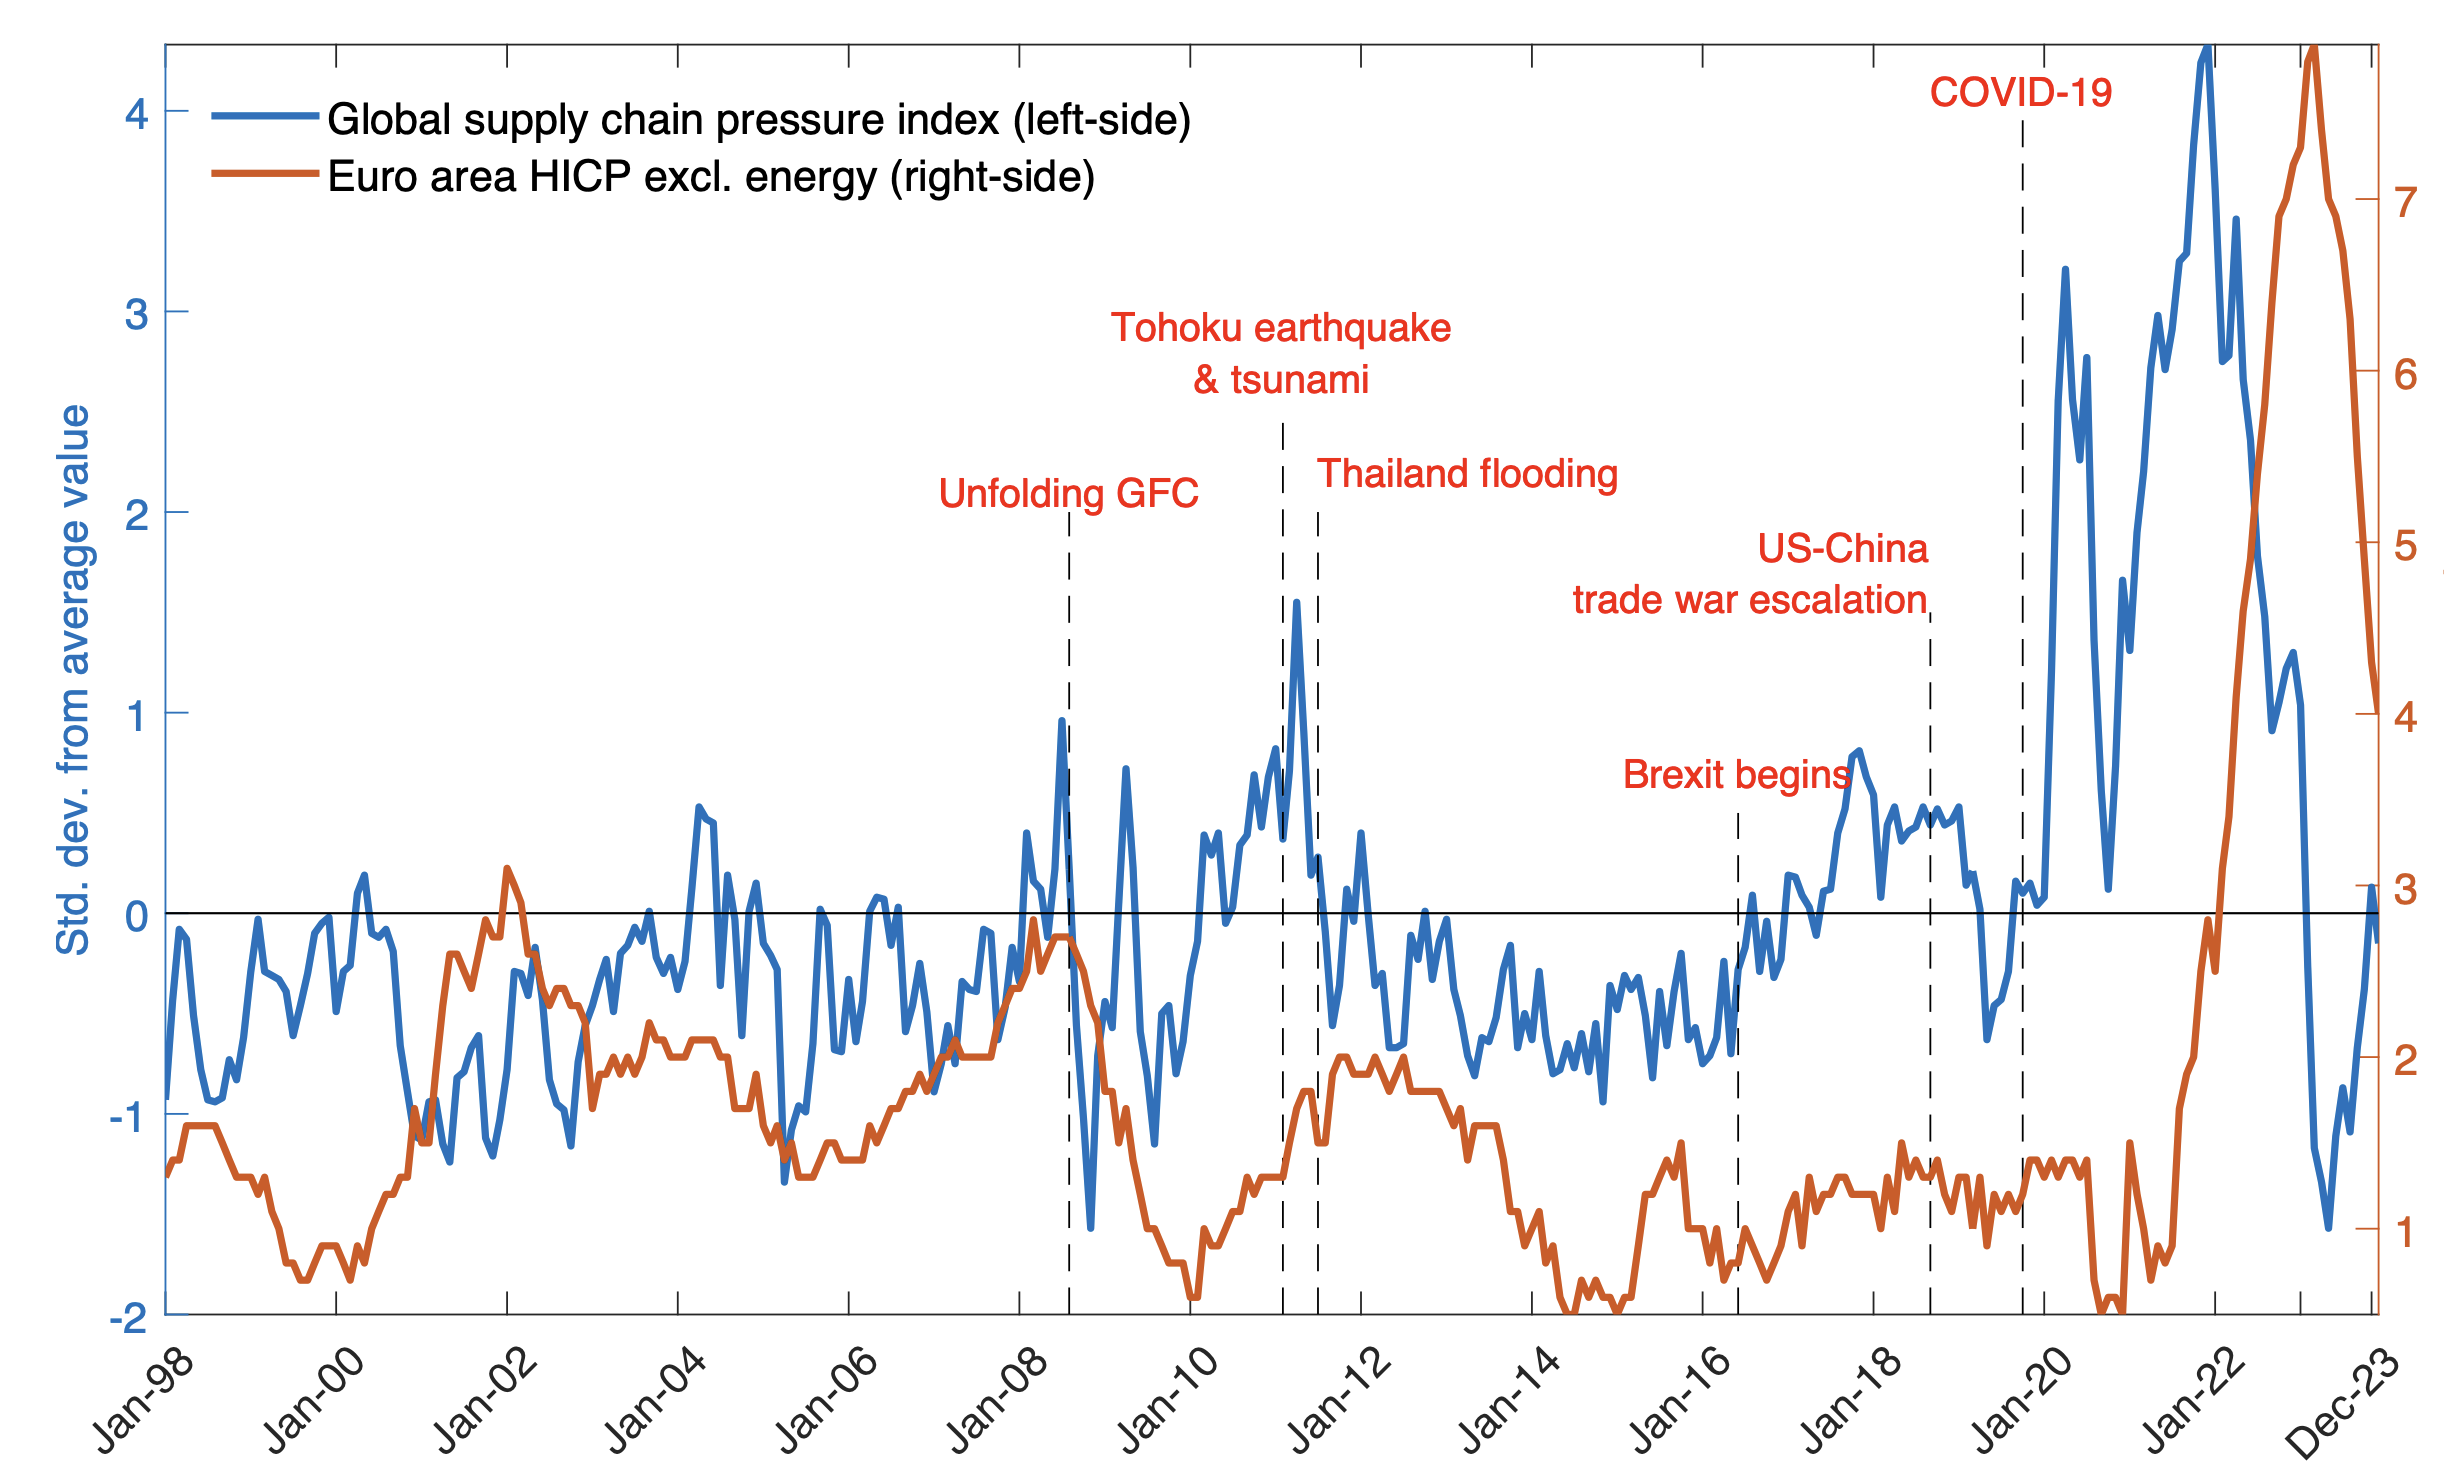
Figure 1 Global supply chain pressures were at historically elevated levels during and after the pandemic crisis
Note: The figure displays the Global Supply Chain Pressure Index (GSCPI), as computed by Benigno et al. (2022), together with euro area core inflation (HICP excluding energy). The GSCPI is scaled by its standard deviation. The last observation is for December 2023. Source: Federal Reserve Bank of New York and Eurostat.
The Global Supply Chain Pressure Index (GSCPI), constructed by Benigno et al. (2022), captures well the rise in both the level and volatility of global supply chain pressures following pandemic-related events (Figure 1). Large movements in this index, which combines a comprehensive set of indicators of global transportation costs
and country-specific supply bottlenecks,
relate to a number of extraordinary events of the past two decades: (i) a fall and swift rebound during the global crisis and the ensuing collapse in world trade, (ii) a surge in 2011, associated with two natural disasters, i.e. the Tōhuku earthquake (and resulting tsunami) and the Thailand flooding, (iii) a rise during the China-US trade disputes of 2017-18, during which many firms had to adjust their global procurement strategies, and (iv) a number of unprecedented spikes attributable to the unfolding Covid-19 pandemic. Currently, the GSCPI hovers around its historical mean, implying that supply bottlenecks have eased substantially.
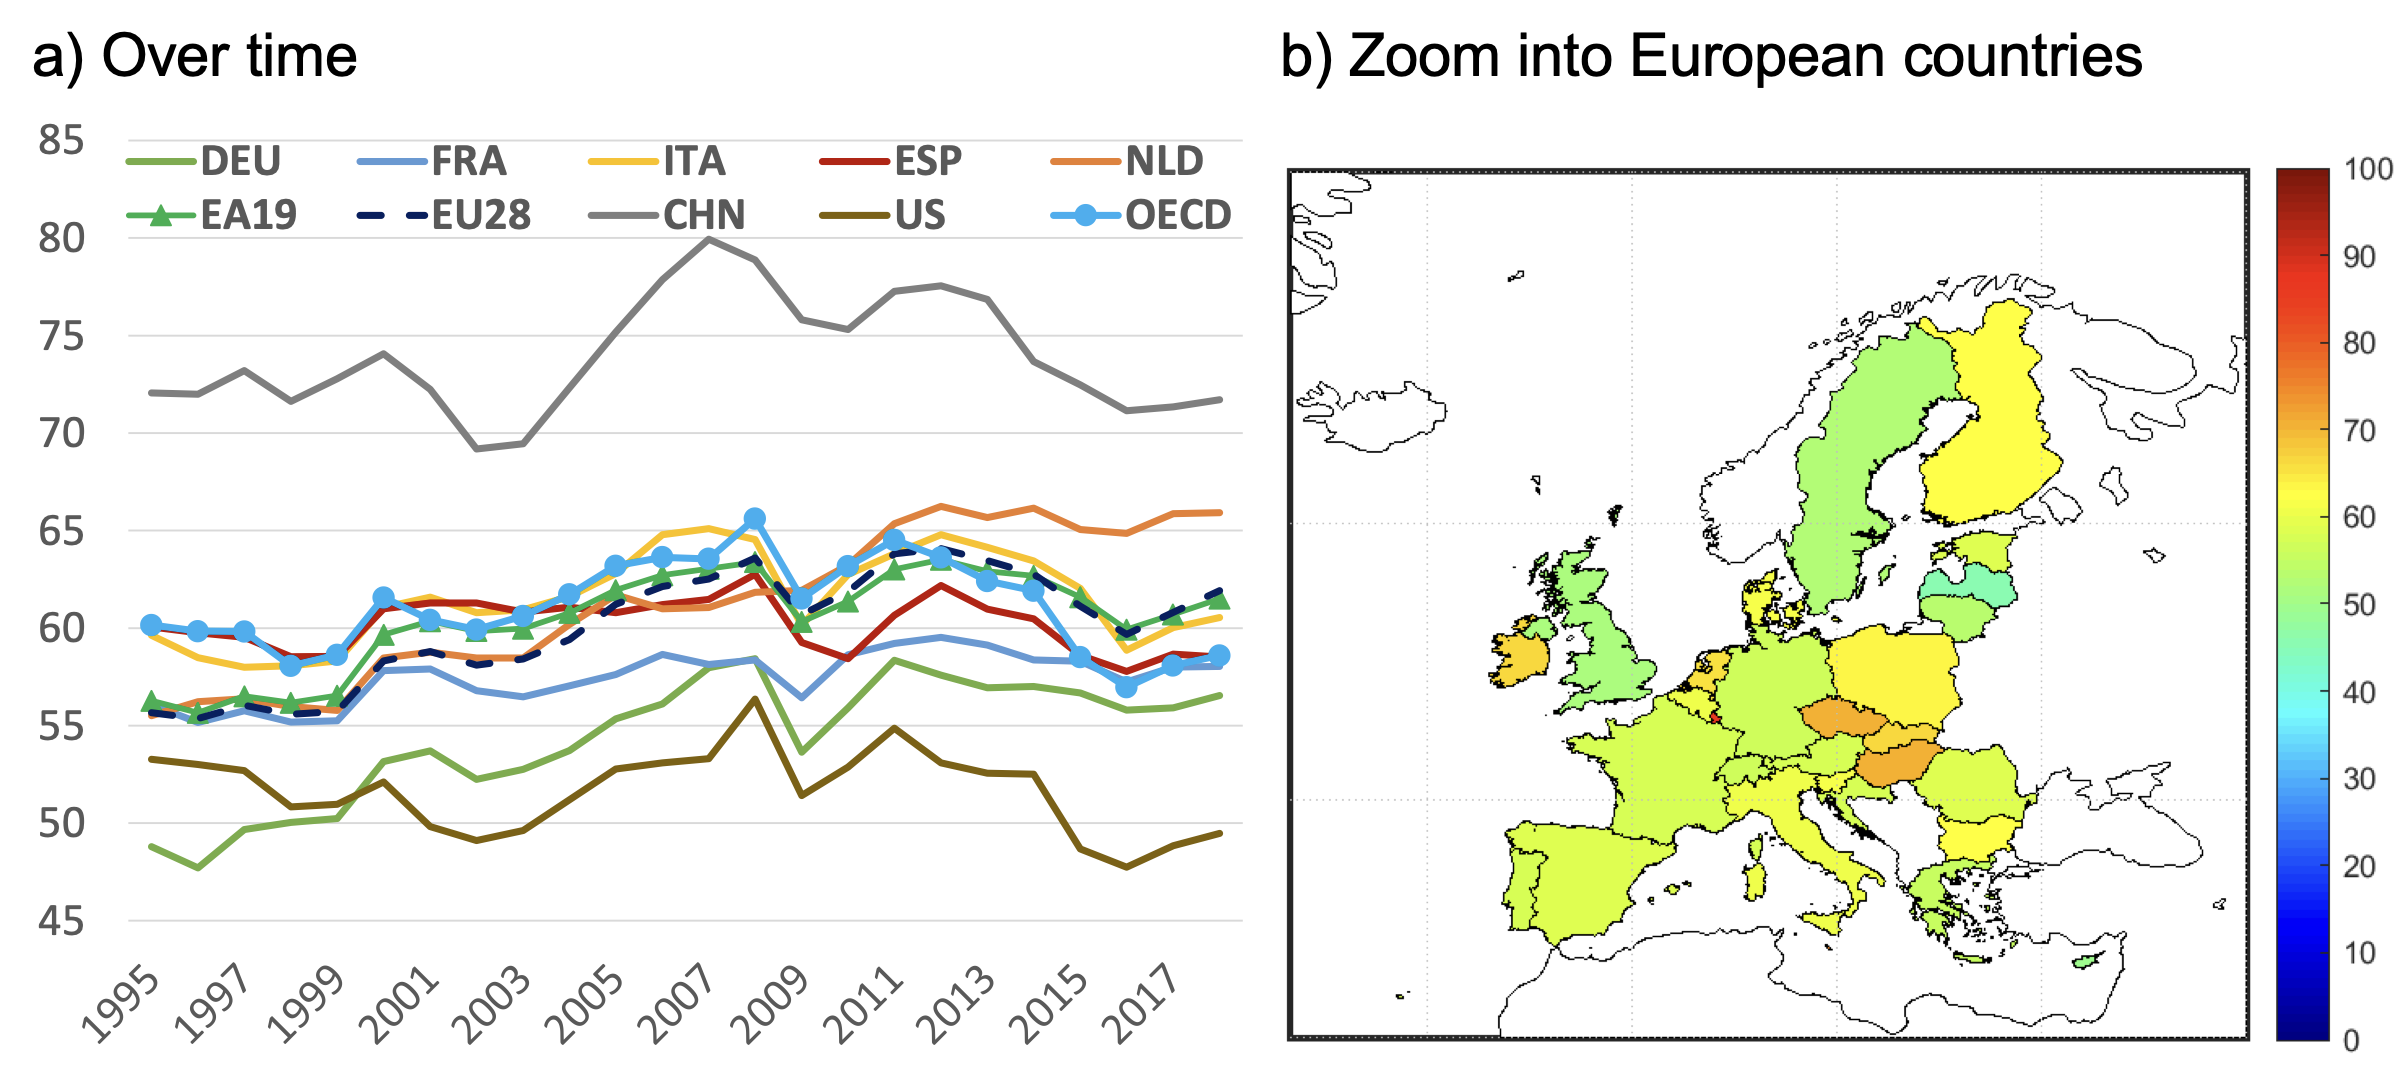
Plotting the GSCPI against euro area core inflation reveals a remarkable (lagged) co-movement between the two series. This can be explained by the fact that in many euro area (and other advanced) economies domestic production strongly relies on global value chains (Figure 2).
As shown by Attinasi et al. (2021), Kabaca and Tuzcuoglu (2023), and Bai et al. (2024), among others, this reliance on global value chains (GVCs) may cause domestic inflation to be sensitive to global supply chain pressures. However, empirical evidence on the relationship between global supply chain pressures and inflation in the euro area is relatively scarce (Finck and Tillmann 2022, Banbura et al. 2023, Acharya et al. 2024).
Figure 2 Advanced economies rely strongly on global value chains
Source: OECD, TiVA (Trade in Value Added) 2021 edition (last year available is 2018), our computations.
In this column, based on Ascari et al. (2024), we find that global supply chain pressure shocks were the dominant driver of the surge in euro area core inflation in the first half of 2022, and that their impact on inflation is highly persistent and hump shaped. Moreover, model simulations show that, under optimal policy, the aggressiveness with which the central bank should tighten in response to global supply-induced inflation is a non-linear function of the degree of an economy’s reliance on global value chains. This result follows from a two-country New Keynesian model that features international trade in intermediate goods to capture global supply chains (e.g. Eyquem and Kamber 2014, Gong et al. 2016).
The effects of global supply chain pressure shocks
We quantify the effects of shocks to global supply chain pressures on euro area core inflation using a data-driven Bayesian Vector Autoregressive (BVAR) model. Our model consists of the following euro area variables: industrial production, core inflation (based on the Harmonised Index of Consumer Prices (HICP) excluding energy), the shadow rate estimate from Krippner (capturing the ECB’s effective monetary policy stance), the real effective exchange rate (with respect to the euro area's 42 main trading partners) and the real price of oil Brent (deflated by the HICP). This set of endogenous variables is augmented with the GSCPI series to capture global supply chain pressures.
Our aim is to identify shocks to global supply chain pressures, and their relative importance in driving the recent euro area inflation burst compared to other shocks (i.e. demand, domestic supply, monetary policy, exchange rate, and oil price shocks). Our strategy to identify these shocks relies on a combination of sign, zero, and narrative sign restrictions, following the approach of Antolín-Díaz and Rubio-Ramírez (2018).
To distinguish between domestic and global supply shocks, we conjecture that the GSCPI does not react contemporaneously to a domestic supply shock (given its global nature) and responds positively on impact to a global supply chain pressure shock. Moreover, we impose various narrative restrictions, motivated by key historical events (such as natural disasters, the Covid-19 pandemic, and periods of war), to further discipline the parameter space.
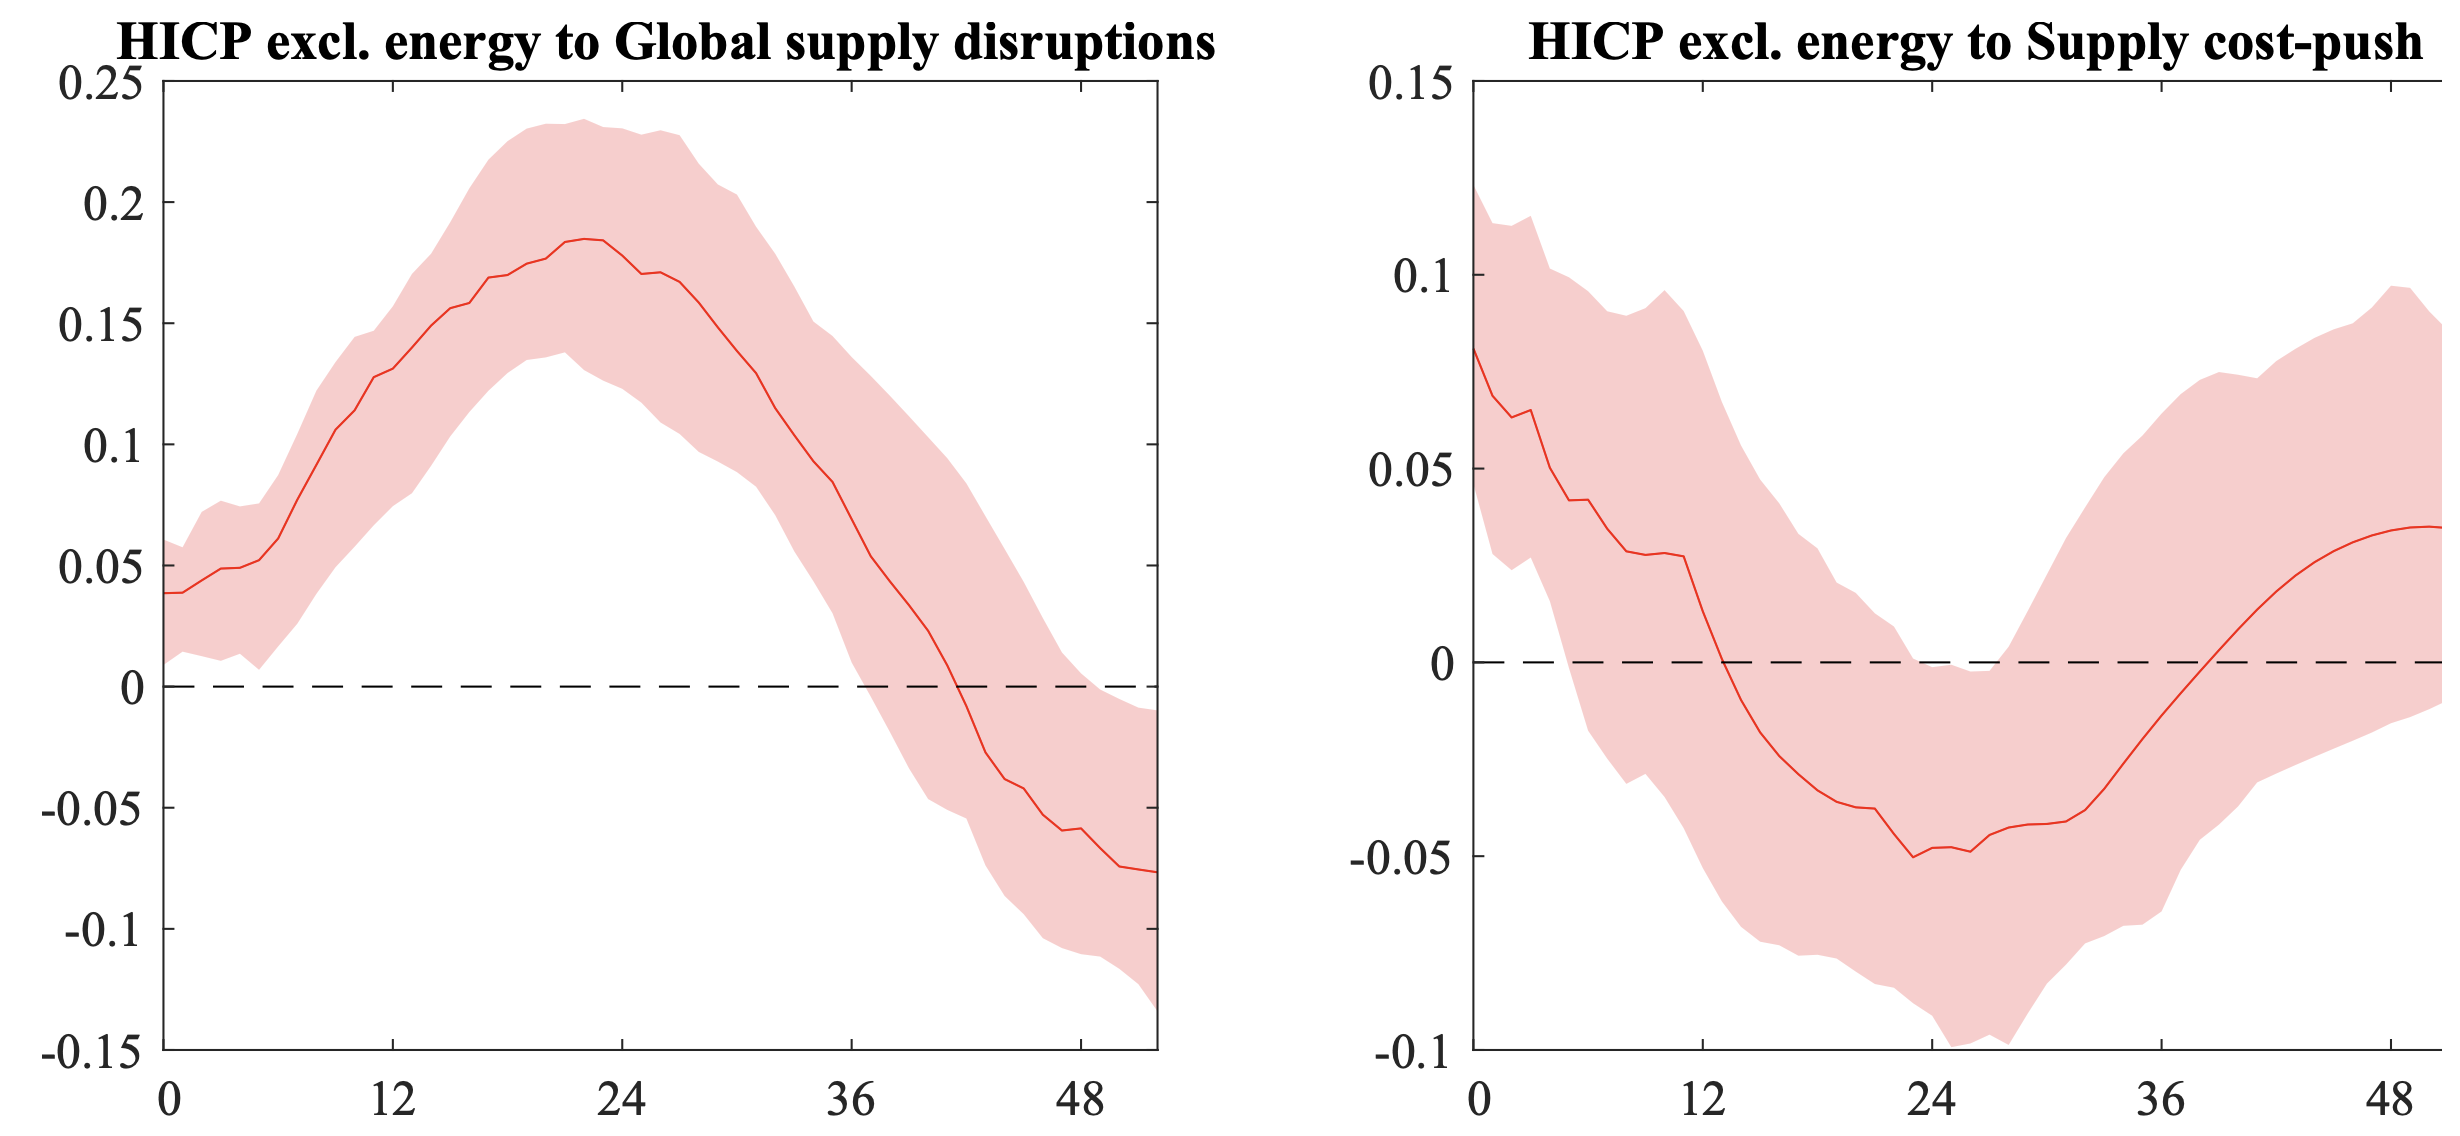
An adverse global supply chain pressure shock leads to a positive and hump-shaped response of euro area core inflation (Figure 3). Interestingly, we find that the inflation response to a global supply shock (left panel) is highly persistent, peaking after about two years following the shock, whereas the response to a domestic supply shock (right panel) is much less persistent, dying out after about four months. The hump-shaped response of inflation to the global supply chain pressure shock can be attributed to the slow response to global supply bottlenecks of prices along the various stages of production (Gong et al. 2016). These forces may be amplified by firms' limited ability to establish new supply chains in the short term (and at low costs). This pattern of the impact of global supply chain pressure shocks on inflation has important implications for policymakers. In particular, even as global supply disruptions are easing, they may continue to add to inflationary pressures for some time.
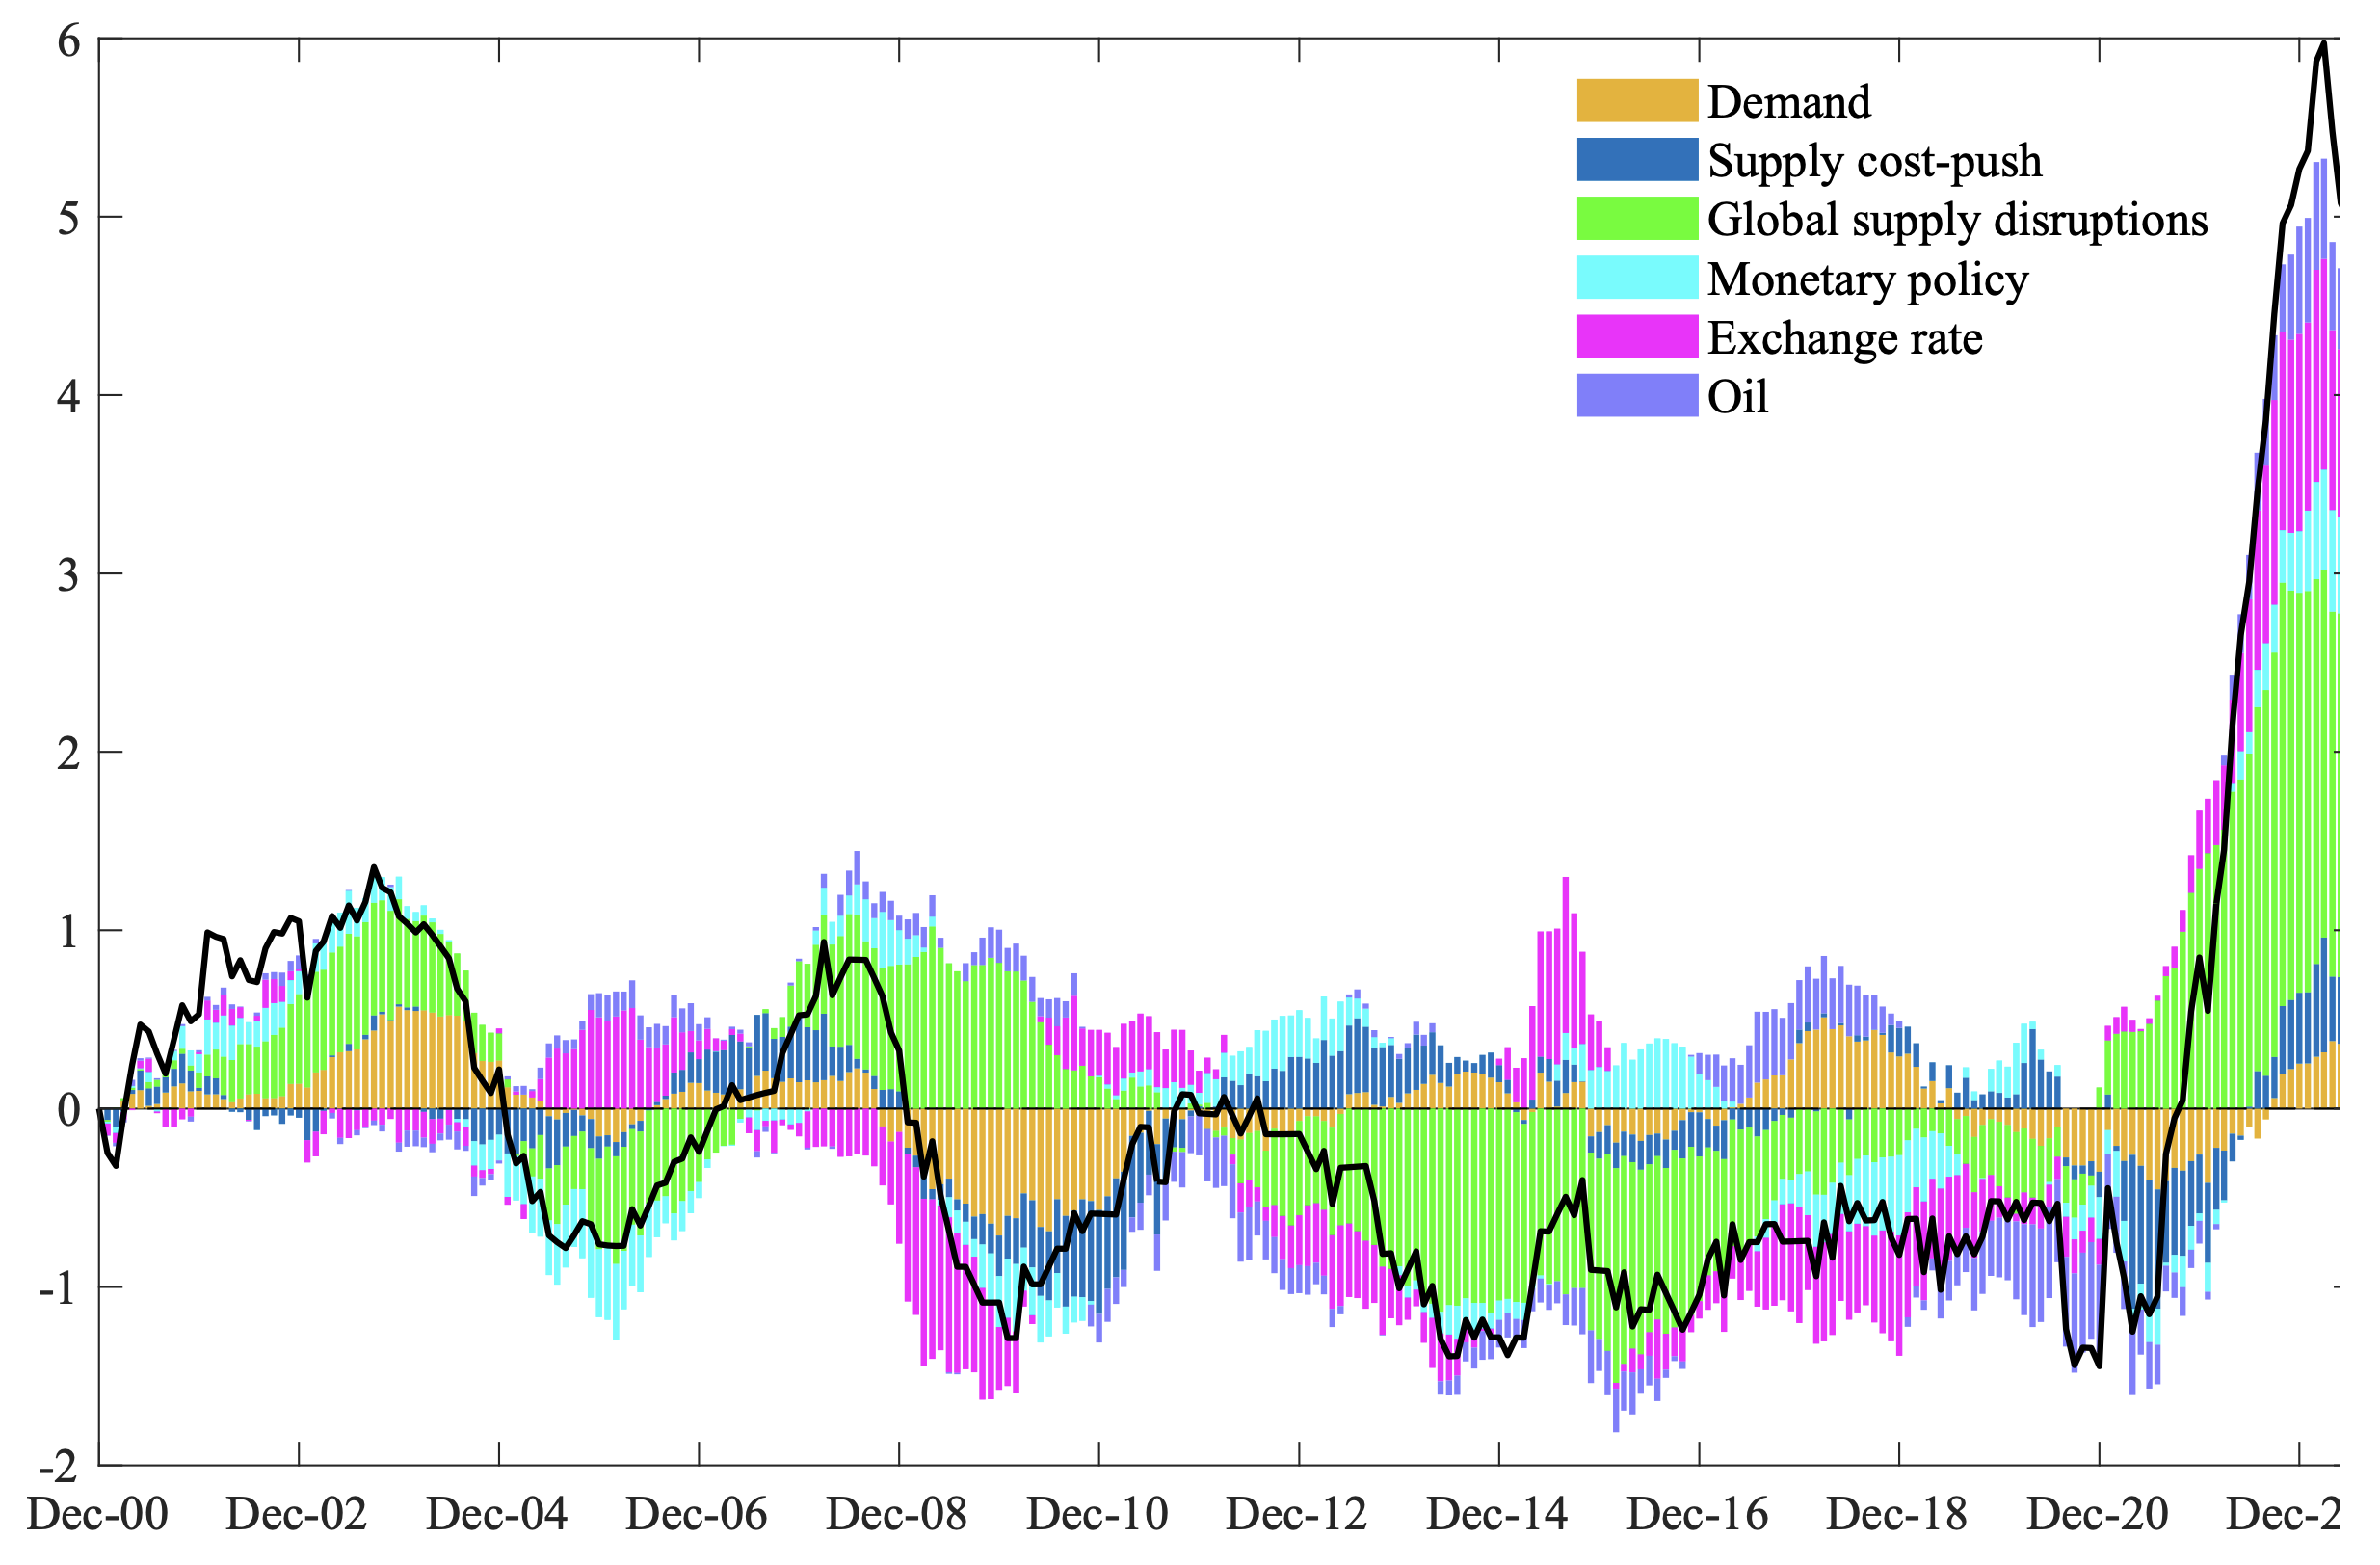
The historical shock decomposition reveals that global supply chain pressure shocks are an important driver of euro area inflation (Figure 4). Several episodes stand out. First, in the run-up to the global crisis, while most shocks exerted upward pressure on euro area inflation, shocks to global supply chain pressures contributed negatively and thereby dampened the build-up of inflationary pressures. However, during the post-global crisis period and the European sovereign debt crisis, we see the opposite, with demand shocks exerting significant downward pressures on inflation and global supply chain disruptions driving inflation upwards.
Figure 3 Shocks to global supply disruptions have a persistent effect on euro area core inflation
Notes: The figure shows the response of euro area core inflation (based on the HICP excluding energy) to a one standard deviation global supply chain pressure shock (left panel) and a one standard deviation domestic supply cost-push shock (right panel). The solid red line reports the median response. Shaded areas represent the 68% probability bands. The horizontal axis measures months after the shock. Units are expressed in percentage points.
Second, favourable shocks to global supply chain disruptions played a key role in driving down euro area inflation in the post-crisis period (2014-2018), an episode that lasted until the China-US trade disputes of 2017-18. This result is in line with the narrative that the effects of expansionary monetary policy on inflation in the euro area may have been partially offset by (favourable) external forces that drove down inflation and which were outside the central bank's (immediate) control.
Third, shocks to global supply chain pressures had a steady and growing positive contribution to core inflation dynamics during the (post-)pandemic era, explaining about 65% of euro area inflation in April 2022. The Covid-19 pandemic unfolded as a mix of supply and demand shocks rippling through the global economy in overlapping waves, with supply chain disruptions arising as a major challenge for many economies. The interplay between containment measures and a strong rebound in global demand for manufacturing goods resulted in bottlenecks, shipping cost surges, and prolonged delivery times. While our result attributes the largest contribution to inflation fluctuations to global supply chain pressure shocks during the inflation surge of 2021-2022, this contribution steadily diminished as global supply disruptions receded, reaching 40% by mid-2023.
Figure 4 Historical shock decomposition of euro area core inflation
Notes: Core inflation measured by the year-on-year percentage change of the HICP excluding energy. Units are expressed in deviations from the mean.
Implications for monetary policy
To study the implications of inflationary global supply shocks for monetary policy, we develop a two-country New Keynesian model that features international trade in intermediate goods. Each country is populated by a representative household, a central bank, and two types of firms. A representative competitive intermediate goods firm sells its good to monopolistically competitive final goods firms, both at home and abroad. The larger is the share of foreign intermediate goods used in the production of domestic final goods, the larger is the economy’s reliance on global value chains. We capture global supply chain disruptions by adverse foreign productivity shocks.
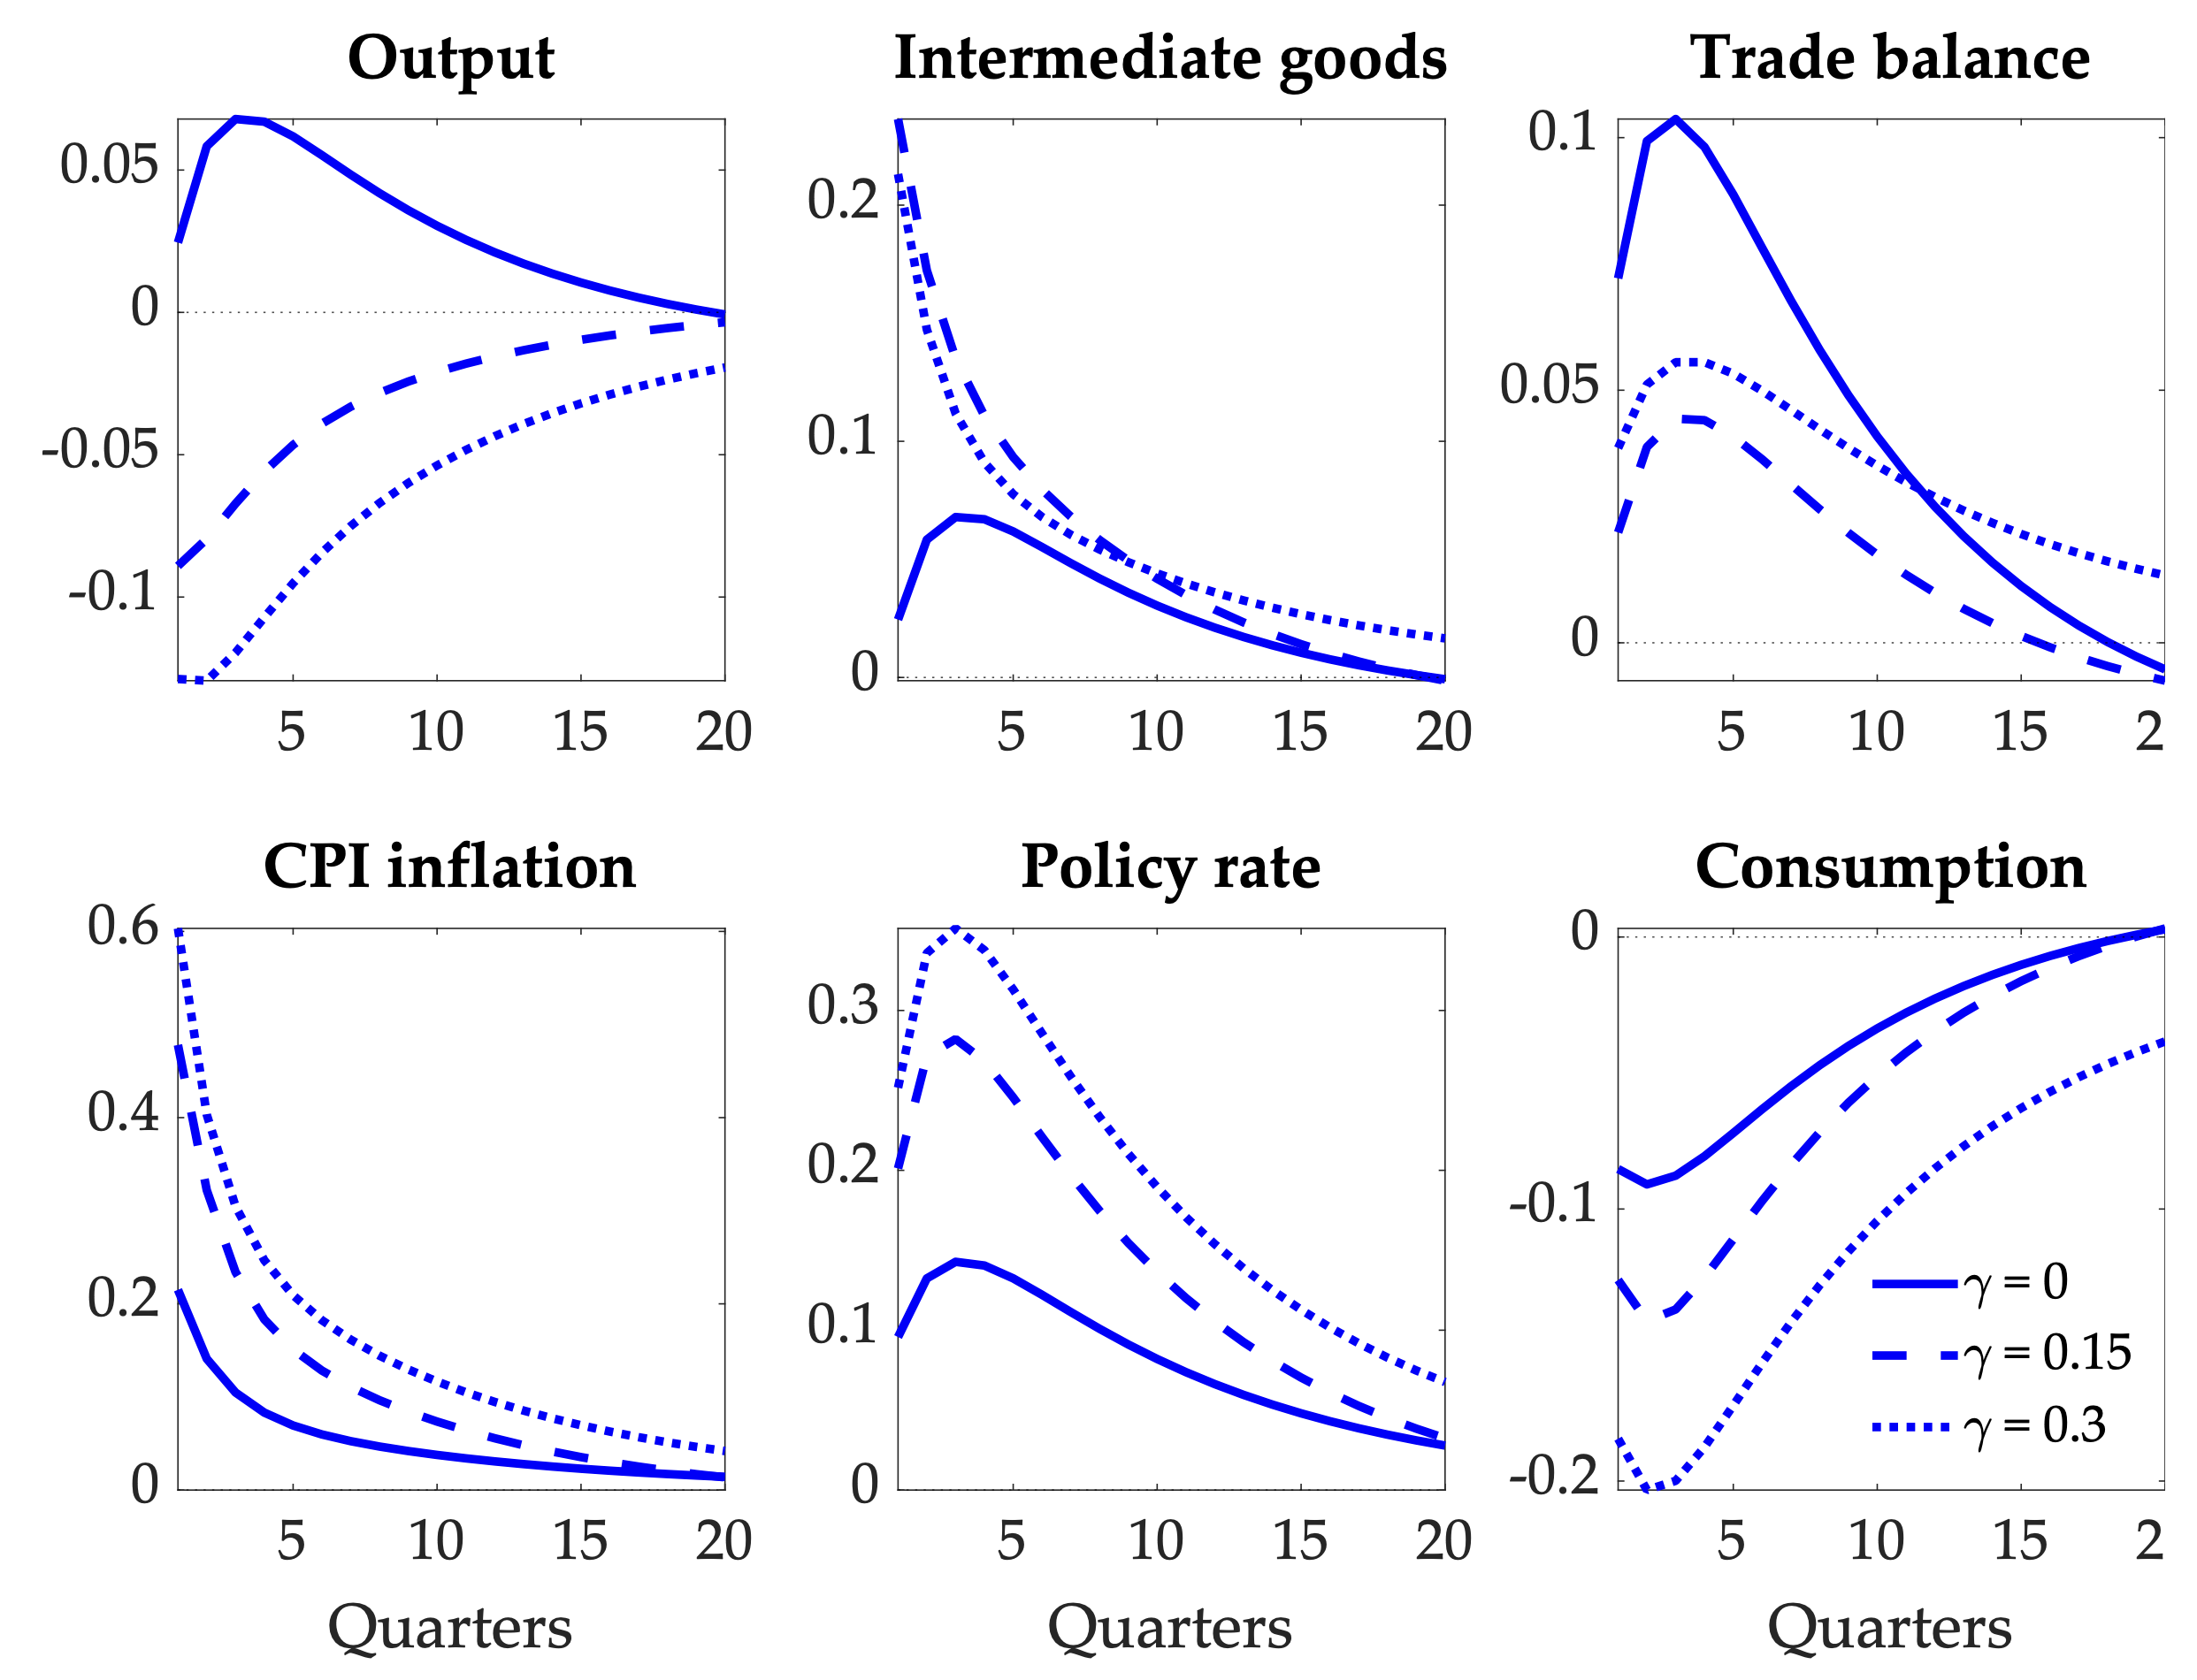
A global supply chain pressure shock resembles that of a domestic demand or supply shock, depending on how much the economy relies on global value chains (Figure 5). When the share of foreign intermediate goods used in the production of final goods is relatively low, the global supply shock has a positive effect on both domestic output and inflation, as would be the case following a positive domestic demand shock. Intuitively, as foreign intermediate goods become more expensive, demand shifts from foreign to (relatively cheap) domestic goods, which leads to an increase in production and prices. However, stronger reliance on global value chains implies that the rise in foreign intermediate input prices has a greater direct effect on domestic goods prices, which results in a decline of domestic production. In that case, the global supply chain pressure shock looks more like a negative domestic supply shock and confronts the central bank with a trade-off between stabilising inflation and output. Under our assumption that the central bank follows a standard Taylor rule,
the interest rate response to the global supply chain pressure shock is positive, and stronger the larger is the economy’s reliance on global value chains. Consequently, consumption declines by more in the latter case.
Figure 5 Responses to a global supply chain pressure shock in the two-country New Keynesian model
Notes: The figure plots the responses of a selection of domestic variables to a 1% negative foreign productivity shock, which we use as a proxy for a global supply chain pressure shock. The importance of global supply chains is governed by the parameter γ, which measures the share of foreign intermediate goods used in the production of domestic final goods. Units are expressed as percentage point deviation from steady state, except for CPI inflation and the policy rate which are expressed in annualised percentage points.
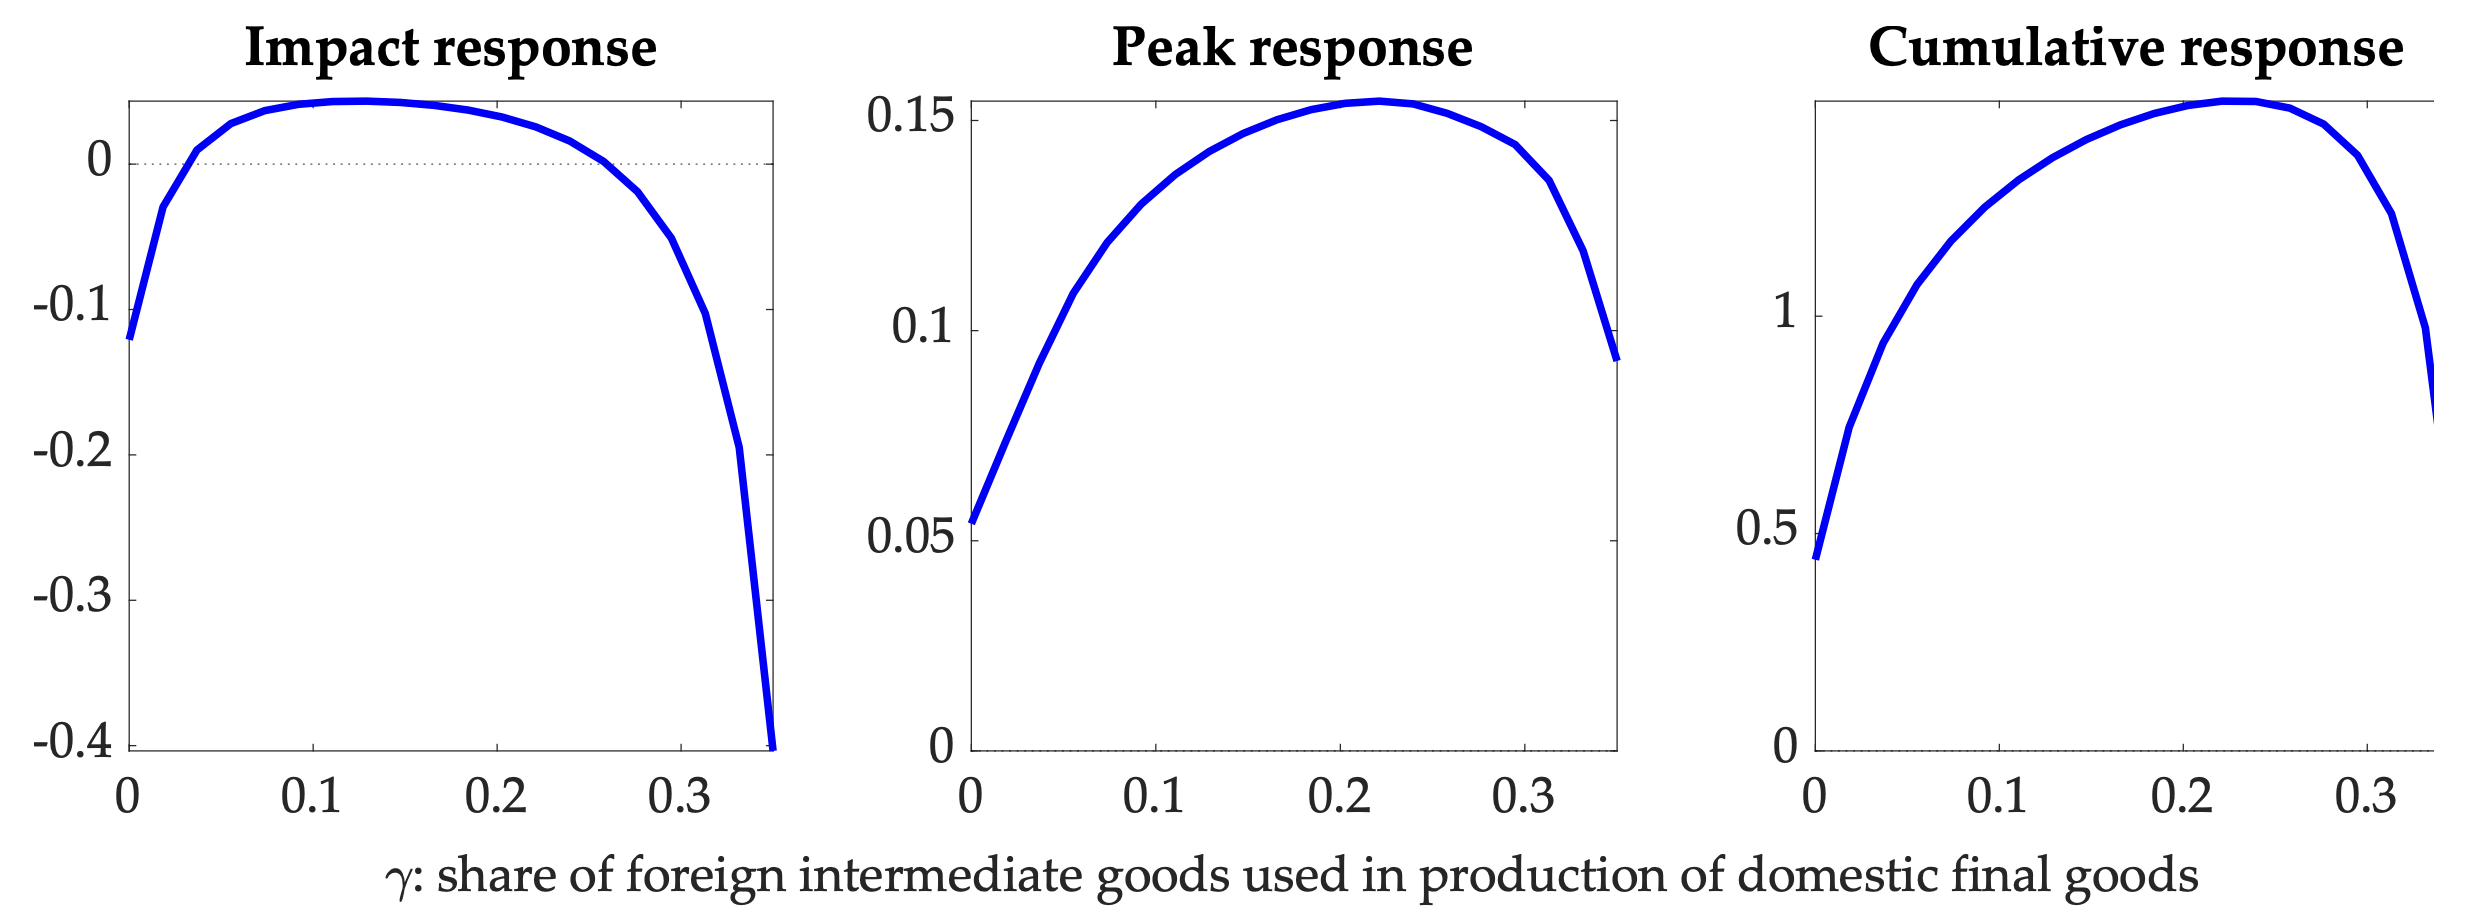
Under optimal monetary policy, the implied interest rate response to a global supply chain pressure shock is a non-linear function of the domestic economy’s reliance on global value chains (Figure 6). When the share of foreign intermediate goods used in the production of domestic final goods is relatively low, the optimal monetary policy response to the global supply chain pressure shock is to provide some accommodation on impact (i.e. to lower the interest rate) and to tighten thereafter. This tightening increases with global value chain reliance, because larger reliance on foreign intermediate goods strengthens the pass-through of foreign price increases to domestic prices, which optimal policy aims to suppress. However, once global value chain reliance reaches a critical threshold, and the global supply shock resembles a domestic supply shock, the optimal monetary policy response weighs more heavily the adverse impact of the shock on domestic production and implies a more muted increase in the interest rate. Hence, depending on how important global value chains are for domestic production, monetary policy should take a more cautionary approach in warding off global supply chain pressure shocks.
Figure 6 Response of domestic interest rate to a global supply chain pressure shock under optimal policy in the two-country New Keynesian model
Notes: Units are expressed as annualised percentage points. The cumulative response is measured over 20 quarters.
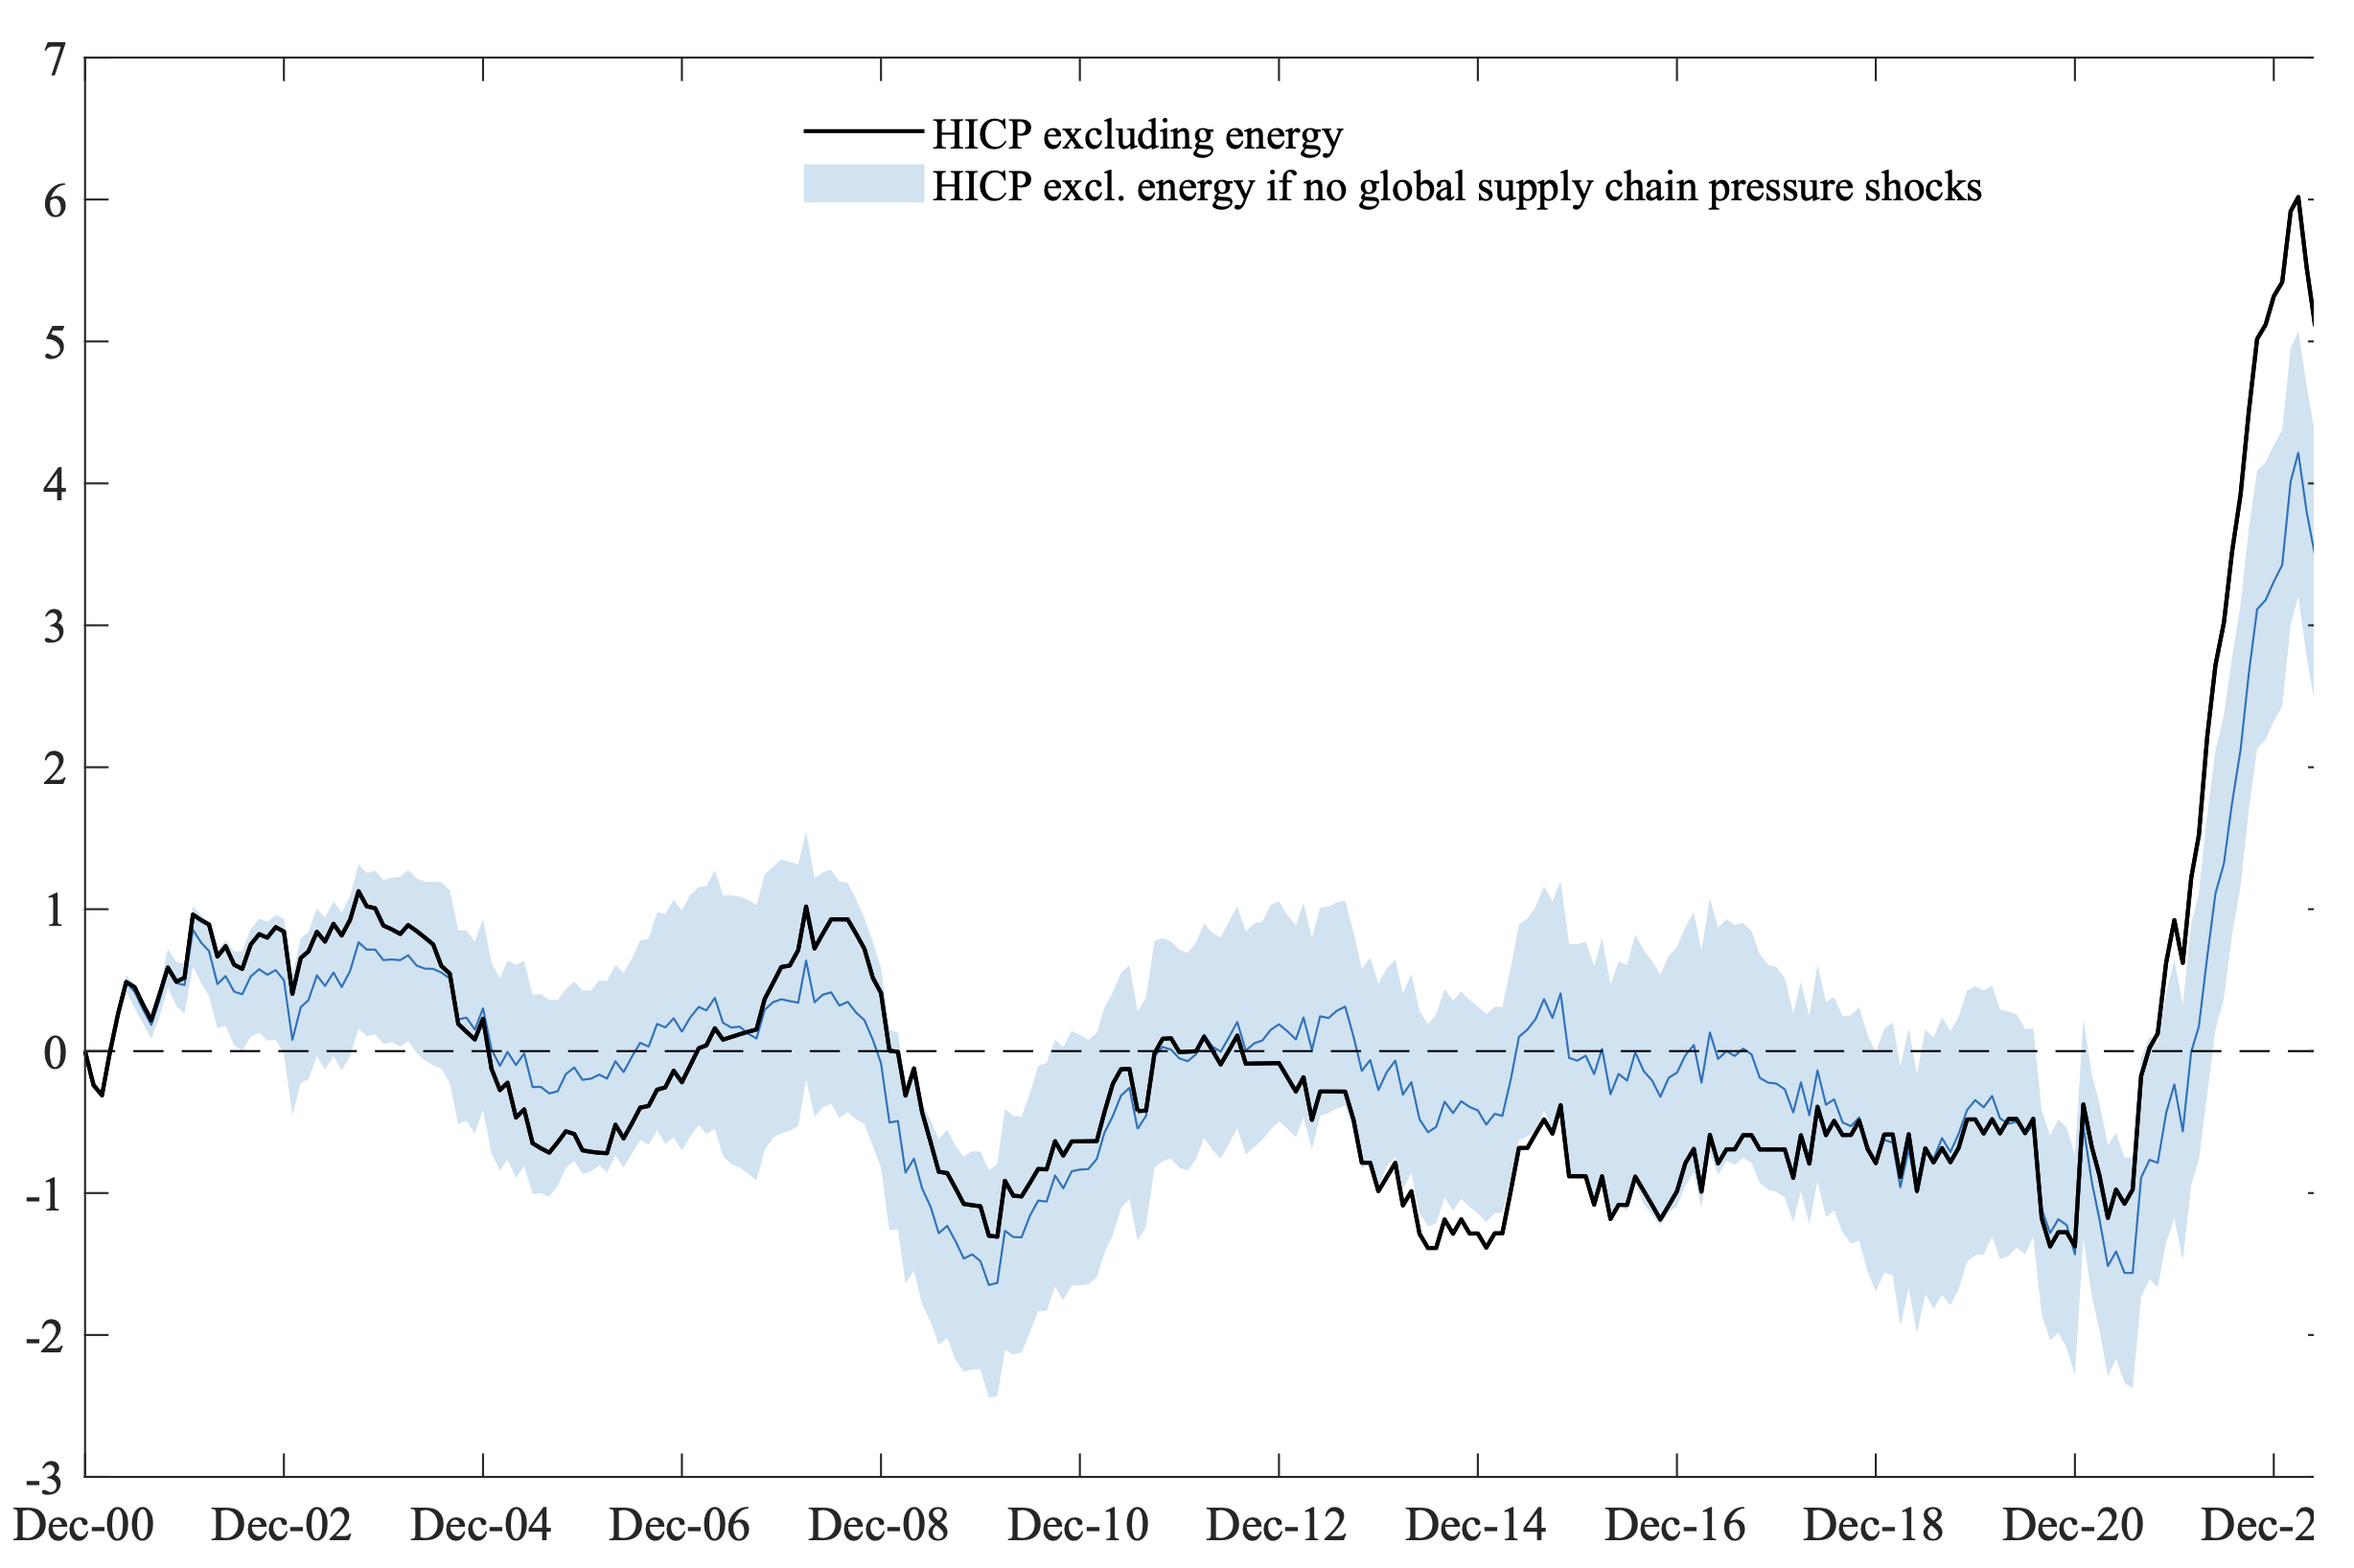
Figure 7 Euro area core inflation in a counterfactual scenario without global supply chain pressure shocks
Notes: The black line represents euro area core inflation measured by the year-on-year percentage change of the HICP excluding energy, while the blue line reports core inflation in a counterfactual scenario without global supply chain pressure shocks. The shaded area represents the corresponding 68% probability bands. Units are expressed in deviations from the mean.
Concluding remarks
Global supply chain disruptions were the dominant force behind the recent inflation surge in the euro area, in part due to the euro area’s dependence on global value chains. While measures like the GSCPI point to an easing of global supply chain disruptions that started already in 2022, their impact was still very much present in 2023 as price increases slowly worked their way through the supply chain and picked up steam through second-round effects. On the flip side, once supply chains are fully restored, we can expect global supply-induced inflationary pressures to be much more muted in the years ahead. Our theoretical model suggests that the optimal monetary policy response to a global supply chain pressure shock depends on the degree of reliance of the economy on global value chains. Specifically, when global value chain reliance is greater, the trade-off between stabilising inflation and output becomes less favourable and monetary policy should respond with greater caution.
Whether these results imply that the central bank should have pursued a less aggressive tightening policy in the recent inflationary episode depends, among other things, on the nature and pervasiveness of other drivers of inflation (such as demand and commodity price shocks), the pass-through from imported intermediate goods prices to domestic goods prices and wages, and the extent to which inflation expectations are anchored to the central bank’s inflation target. According to our empirical results, inflation would still have risen quite substantially in a counterfactual scenario without global supply chain pressure shocks (Figure 7). Hence, even if global supply disruptions were known ex-ante to be temporary, a forceful monetary policy response was still warranted.
Authors’ note: The views expressed are those of the authors and do not necessarily represent the views of De Nederlandsche Bank or the Eurosystem.
References
Acharya, V, M Crosignani, T Eisert and C Eufinger (2024), “The euro area pandemic inflation: A tale of supply chains, household inflation expectations, and firm pricing power”, VoxEU.org, 6 February.
Antolín-Díaz, J and J F Rubio-Ramírez (2018), “Narrative sign restrictions for SVARs”, American Economic Review 108(10): 2802–29.
Ascari, G, D Bonam and A Smadu (2024), “Global supply chain pressures, inflation, and implications for monetary policy”, Journal of International Money and Finance 142.
Ascari, G and L Fosso (2022), “The inflation rate disconnect puzzle: On the international component of trend inflation and the flattening of the Phillips curve”, Technical report, De Nederlandsche Bank Working Paper No. 733.
Attinasi, M G, M Balatti, M Mancini and L Metelli (2022), “Supply chain disruptions and the effects on the global economy”, Economic Bulletin Boxes 8.
Auer, R, C E Borio and A J Filardo (2017), “The globalisation of inflation: The growing importance of global value chains”, CEPR Discussion Paper No. DP11905.
Auer, R A, A A Levchenko and P Sauré (2019), “International inflation spillovers through input linkages”, Review of Economics and Statistics 101(3): 507–521.
Bai, X, J Fernández-Villaverde, Y Li and F Zanetti (2024), “The causal effects of global supply chain disruption on macroeconomic outcomes: Theory and evidence”, Mimeo.
Baldwin, R (2022), “The peak globalisation myth: Part 3 – How global supply chains are unwinding”, VoxEU.org, 2 September.
Banbura, M, E Bobeica and C M Hernández (2023), “What drives core inflation? The role of supply shocks”, Technical report, ECB Working Paper No. 2023/2875.
Benigno, G, J di Giovanni, J J Groen and A I Noble (2022), “The GSCPI: A new barometer of global supply chain pressures”, Federal Reserve Bank of New York Staff Reports 1017, May.
Eyquem, A and G Kamber (2014), “A note on the business cycle implications of trade in intermediate goods”, Macroeconomic Dynamics 18(5): 1172–1186.
Finck, D and P Tillmann (2022), “The macroeconomic effects of global supply chain disruptions”, Technical report, BOFIT Discussion Papers.
Forbes, K J (2019), “Has globalization changed the inflation process?”, Technical report, BIS Working Paper No. 791.
Gong, L, C Wang and H-F Zou (2016), “Optimal monetary policy with international trade in inter-mediate inputs”, Journal of International Money and Finance 65: 140–165.
Kabaca, S and K Tuzcuoglu (2023), “Supply drivers of US inflation since the pandemic”, Technical report, Bank of Canada, Staff Working Paper 2023-19.


