In the last few decades, interest in the distribution of income has grown enormously in academia, policy circles, and popular media. This trend is driven by many concurring factors: its global nature; the observation that higher inequality is often paired with lower economic mobility; the rise of top income shares in some countries; the concern that extreme income disparity may distort the political process; and finally, the belief that the key forces behind this transformation – technological changes and trade liberalisation – have also generated widespread prosperity, highlighting a complex tradeoff between inequality and growth. For recent surveys about these trends and issues, see Saez and Zucman (2020) and Hoffmann et al. (2020), as well as recent Vox columns discussing related issues, such as Ortiz-Juarez et al. (2022) and Foellmi and Baselgia (2022).
Today, virtually every area of economics is contributing to the inequality debate. For the conversation to progress in the right direction, we believe that researchers need rich micro data that accurately represent the evolution of the income distribution in all its facets. A number of cross-country databases documenting trends in world income inequality already exist (such as the World Inequality Database (WID), the World Income Inequality Database (WIID), the Luxembourg Income Study, and several data sources hosted by the OECD). Most of these databases have two defining characteristics: they are cross-sectional, and hence provide no information on income dynamics or economic mobility; and statistics can only be disaggregated for broad demographic groups, with limited information on finely defined subpopulations.
In this column, we introduce the Global Repository of Income Dynamics (GRID), a new open-access, cross-country database of harmonised micro statistics that overcomes these limitations (available at https://www.grid-database.org/). Currently, GRID includes 13 countries: Argentina, Brazil, Canada, Denmark, France, Germany, Italy, Mexico, Norway, Spain, Sweden, the UK, and the US. These countries were chosen not only for the availability of suitable administrative data, but also because they represent a broad spectrum of levels of development and institutions. GRID has been developed over the past four years with the participation of more than 50 economists in the 13 country teams. In addition to producing the GRID statistics, each team has also written research articles (published in the November 2022 special issue of Quantitative Economics) about their respective countries. GRID is built on four pillars that support what we think is the best data infrastructure to inform the analysis of distributional outcomes in social sciences: data must be longitudinal, administrative, granular, and harmonised.
Longitudinal
The first feature of GRID is its longitudinal (or panel) dimension, which enables researchers to study the dynamics of individual income over time, as opposed to static snapshots of distributions as cross-sectional inequality measures do. This distinction is crucial for welfare analyses and for designing redistributive and social insurance programs. Panel data allow researchers to analyse the entire distribution of individual income changes (including tails), document the nature of income risk that workers face (e.g. the size and persistence of individual income shocks, and how they vary with the business cycle), and estimate the rank mobility of individuals within the income distribution over the life cycle.
Administrative
All GRID statistics originate from administrative records (e.g. social security records and other government registers). Administrative data offers several advantages over survey data. Survey data typically suffer from sample attrition, measurement error, and lack of representativeness of the tails (especially at the top). These issues are absent in administrative data, which collect information on either the entire population or very large random samples tracked over time using government identifiers (such as tax identifiers or social security numbers). Since administrative data cover in most cases the entire population, tail statistics (e.g. the top 0.1% share) are estimated reliably. Of course, administrative data have their own limitations. For example, in countries where the informal sector is large, they can miss a significant share of the population. Moreover, for most researchers, access to administrative micro data may be prohibitively costly or infeasible. The vast menu of statistics available in the GRID database should substantially alleviate the need to access the underlying administrative micro data for many users.
Granular
Survey data often have small sample sizes, which generates statistical power problems when trying to conduct nonparametric analyses. Because of its administrative nature, GRID allows granular analyses for detailed subpopulations, the measurement of higher-order moments (e.g. skewness and kurtosis), and nonparametric representations. The current version of GRID includes micro statistics on income inequality, income fluctuations, and mobility for subpopulations defined by year, age, gender, and a measure of permanent income (as a proxy for skills).
Harmonised
A primary goal of the GRID project is to produce statistics that are as comparable as possible across countries. Harmonisation is an inherently challenging task, given the cross-country differences in variable definitions and data collection methods. The statistics in GRID are produced by one single master code, which ensures that critical steps in data construction are carried out uniformly across countries.
Example uses of GRID
To illustrate potential use of GRID, the rest of this column provides a brief summary of the global trends in income inequality and income dynamics that we uncovered from data downloaded from the website. Our recent paper (Guvenen et al. 2022) discusses these trends in more detail.
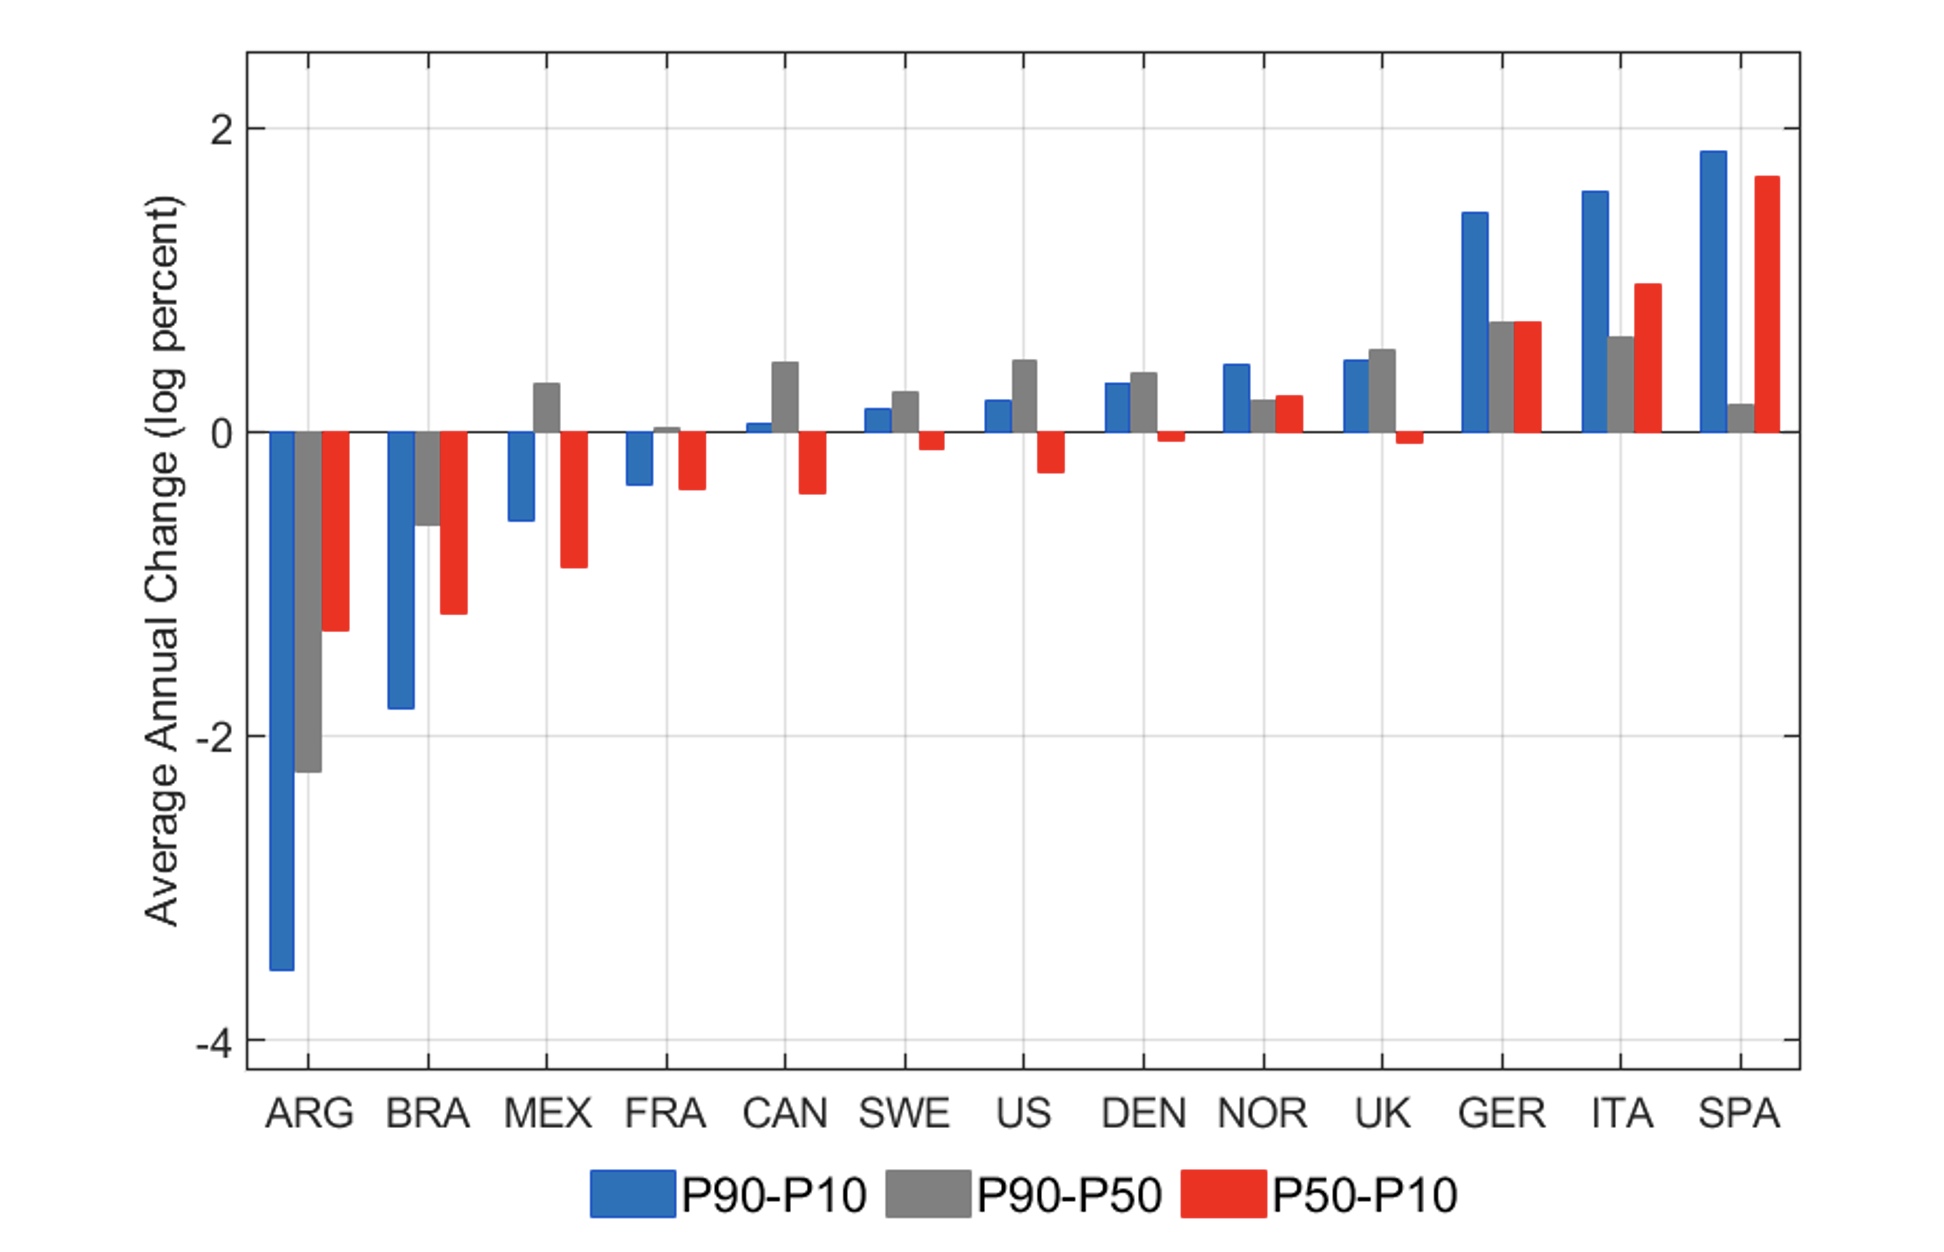
With respect to cross-sectional income inequality, we document a number of facts. First, over a variable time period covering 1985-2015, GRID countries do not display any discernible common global trend toward rising income inequality, despite the often-repeated assertions to that effect. In fact, overall inequality (as measured by the 90th-10th percentile difference) remains fairly stable in about half of the countries, with the rest evenly split between those experiencing a rise and those experiencing a decline in inequality (see Figure 1). Perhaps because of their rapid economic development or declining incidence of informal labour, Latin American countries actually record declining income inequality. In contrast, inequality rises in some continental European countries, perhaps because of various waves of labour market reforms, but increased little in Scandinavian countries. The US data in GRID extends back to 1998 showing that income inequality in the US has been largely stable in the last 20 years after rising strongly during the 1980s and 1990s.
Figure 1 Trends in overall, top-end, and bottom-end income inequality for GRID countries
We also find that, in most countries, income levels at the top 1% and 0.1% do not show faster trend growth relative to growth rates in GDP per capita or average wages. In countries where the top income shares have grown fast, this growth reflects the stagnation of earnings for the rest of the population, especially below the median, rather than accelerating income growth at the top. Finally, the gap between the dispersion in women's and men's earnings has closed in many countries: there is convergence in the level of earnings inequality between genders.
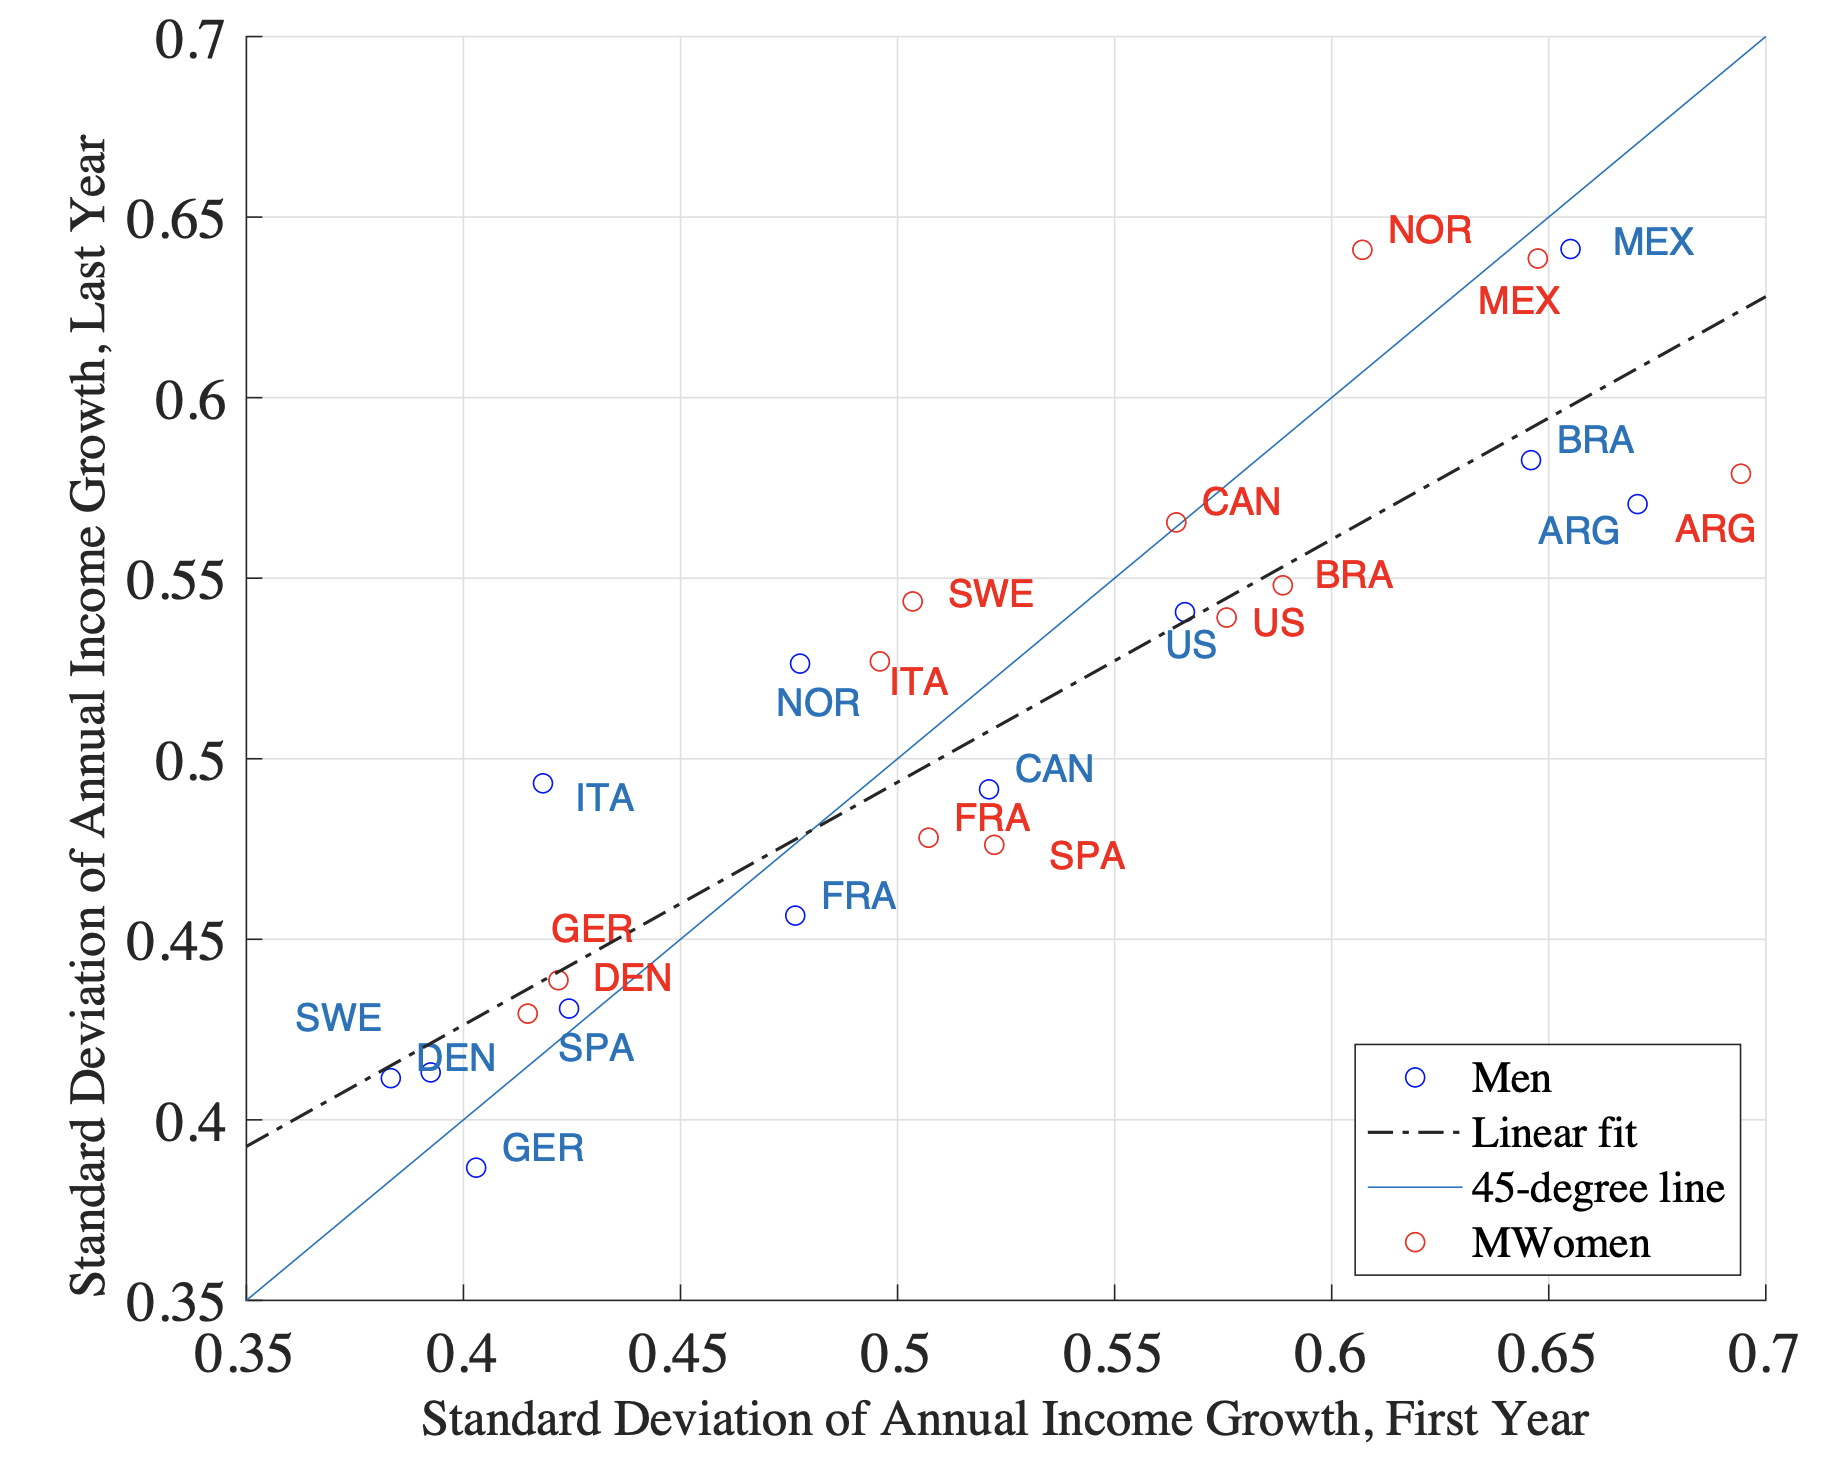
Turning to the distribution of income growth, a question that received much attention is whether income volatility increased over time, which would suggest higher income uncertainty faced by workers. We find that with the exception of Nordic countries and Italy, volatility has been stable or declining over time for GRID countries (Figure 2). The decline has been especially strong for Latin American countries. Volatility has also declined in the US for both men and women (as documented by Bloom et al. 2017), which contrasts with results from survey-based analyses in the previous literature (Gottschalk and Moffitt 2009).
Figure 2 Comparing the volatility of annual income growth in the first versus last year of sample for GRID countries
With the exception of the volatility trends just mentioned, we see a remarkably homogeneous picture regarding income growth across countries, with few exceptions. In particular, in all countries the density of income growth has a very large variance, peaks at the center, and has thick Pareto tails. Furthermore, in all countries, skewness is procyclical, driven by both the upper tail (income changes above the median) compressing and the lower tail expanding in recessions, and vice versa in expansions. As a result, idiosyncratic income risk appears countercyclical and asymmetric over the business cycle.
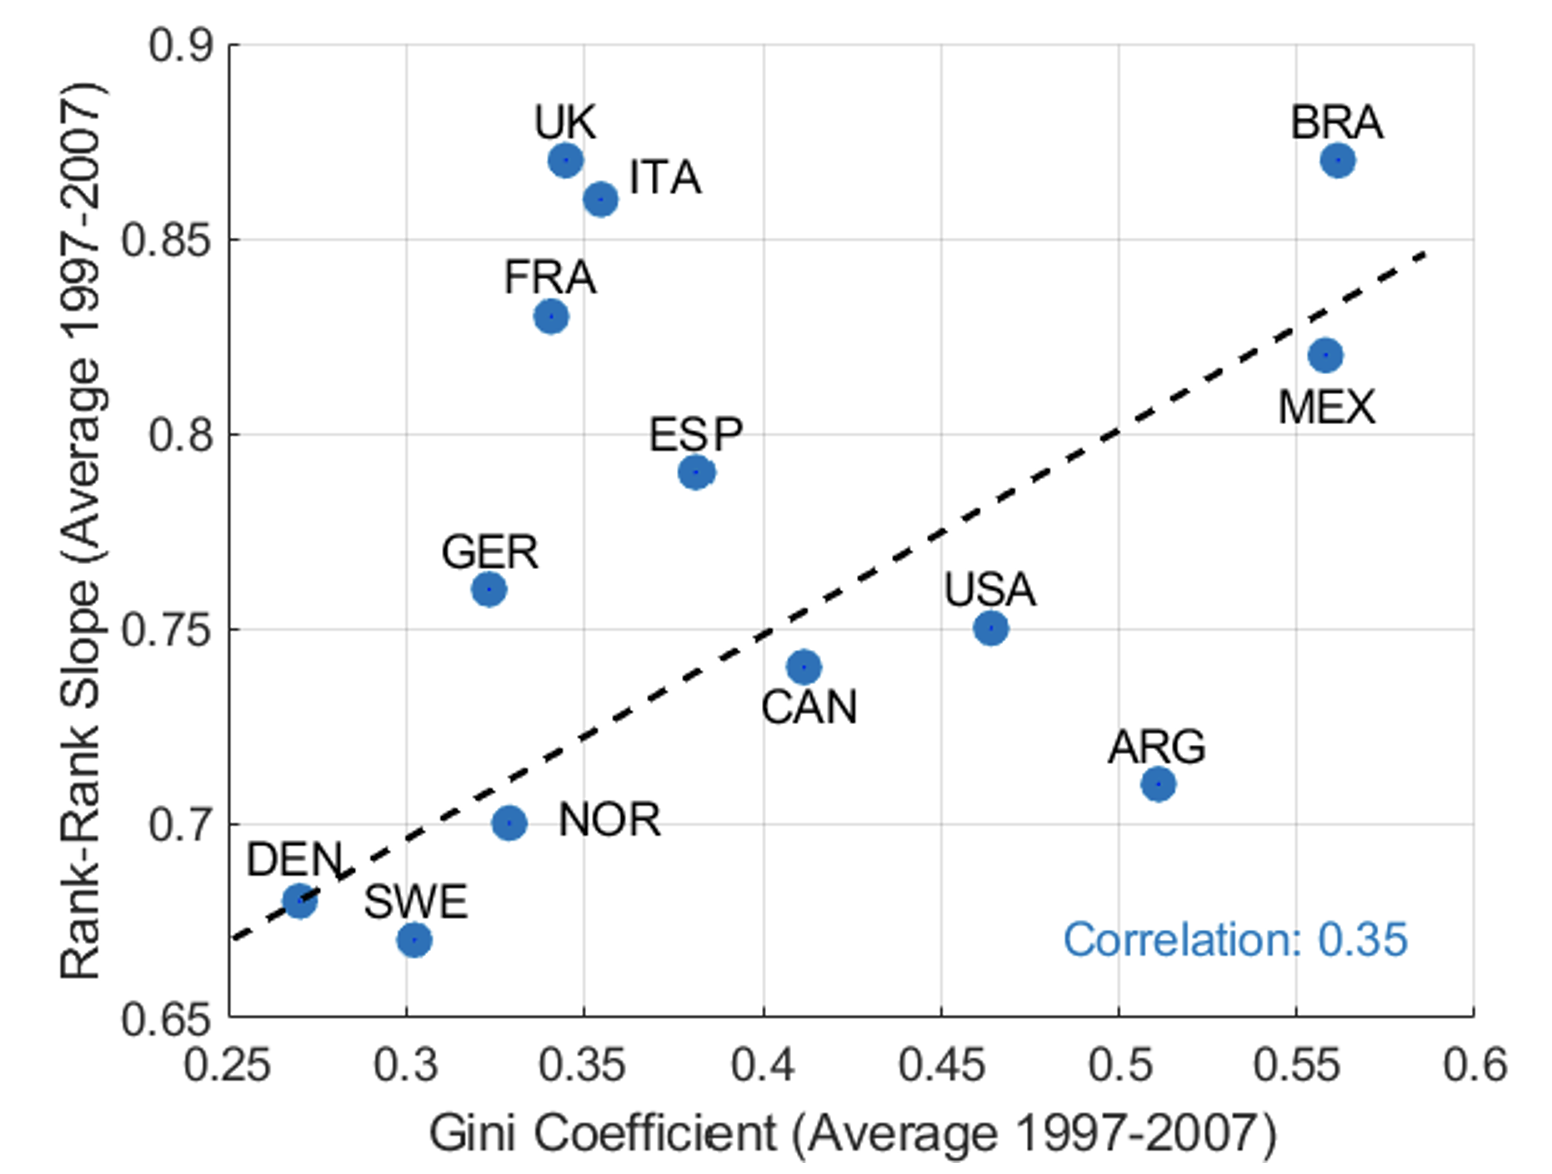
Understanding the extent to which income changes reshuffle workers’ relative positions within the distribution itself is also important. GRID includes measures of 5-year and 10-year rank lifecycle mobility. Perhaps not surprisingly, Scandinavian countries feature the lowest degree of income persistence, and some of the Latin American countries, together with Italy and France, the highest. Intragenerational mobility is, in general, higher for women and for younger workers. We discerned no significant time trend in life cycle mobility over the past two decades, suggesting that the trends in cross-sectional earnings we documented have largely translated into similar trends for permanent earnings. Finally (see Figure 3), we document the existence of a negative cross-country relationship between rank mobility and inequality, an intragenerational version of the so-called ‘Great Gatsby curve’ (Durlauf et al. 2022).
Figure 3 The ‘Great Gatsby curve’ for the GRID countries
References
Bloom, N, F Guvenen, L Pistaferri, J Sabelhaus, S Salgado and J Song (2017), “The Great Micro Moderation”, unpublished manuscript.
Durlauf, S N, A Kourtellos, and C M Tan (2022), “The Great Gatsby Curve,” Annual Review of Economics 14(1): 571-603.
Foellmi, R and E Baselgia (2022), “The inequality-growth nexus: It’s time to move beyond averages”, VoxEU.org, 28 October.
Gottschalk, P and R Moffitt (2009), “The Rising Instability of U.S. Earnings,” Journal of Economic Perspectives 23 (4): 3–24.
Guvenen, F, L Pistaferri and G L Violante (2022), “Global Trends in Income Inequality and Income Dynamics: New Insights from GRID”, Quantitative Economics forthcoming.
Hoffmann, F, D S Lee and T Lemieux (2020), “Growing Income Inequality in the United States and Other Advanced Economies”, Journal of Economic Perspectives 34 (4): 52-78.
Ortiz-Juarez, E, A Sumner and R Kanbur (2022), “The global inequality boomerang”, VoxEU.org, 2 May.
Saez, E, and G Zucman (2020), “The Rise of Income and Wealth Inequality in America: Evidence from Distributional Macroeconomic Accounts”, Journal of Economic Perspectives 34(4): 3-26.


