Integration in global value chains (GVCs) has attracted a lot of attention since the beginning of the COVID-19 crisis. While the interconnectedness of GVCs has contributed to higher productivity, greater variety of goods, and income convergence across emerging economies, the production of some products has become highly concentrated in specialised firms and countries. GVCs have also become longer and more complex, making them more vulnerable to a variety of shocks (Schwellnus et al. 2023).
Trade in value added (TiVA) indicators are increasingly used to monitor countries’ integration into global supply chains. They are constructed by combining national supply and use tables (which show production linkages within countries) with trade statistics (which show exchanges between countries). However, they are published with a significant lag – often two or three years – which reduces their relevance for monitoring recent economic developments.
In a recent paper (Mourougane et al. 2023), we aim to provide more timely insights into the international fragmentation of production by exploring new ways of nowcasting five TiVA indicators (domestic and foreign value-added share of exports, domestic and foreign services value-added share of exports, and the share of domestic value added embodied in foreign final demand) for the years 2021 and 2022 covering 41 economies (all OECD economies and large emerging-market economies) at the economy-wide level and for 24 industries.
Our analysis relies on a range of models, including gradient-boosted trees (GBM) and other machine-learning techniques, in a panel setting and uses a wide range of explanatory variables capturing domestic business cycles and global economic developments and corrects for publication lags to produce nowcasts in quasi-real time conditions. Best nowcast models for each country and each country-sector pair are selected based on their out-of-sample, one-year-ahead predictive performance relative to a first-order autoregressive benchmark model. Confidence bands at 10% around nowcasts are also provided.
Resulting nowcasting models significantly improve compared to the benchmark model and exhibit relatively low prediction errors at a one- and two-year horizon. Best models outperform the autoregressive benchmark in about 75% of the cases, with generally very good performance of GBM-based models.
Model performance differs across countries and sectors
Overall, the performance, measured in terms of root mean square errors (RMSEs), is very good for OECD aggregates, and at world level. But models for larger countries – in particular the US, Japan, Germany, and China – perform on average across indicator-sector instances much better than others (on average, 0.6 to 0.9 percentage points lower than the average of countries). Other large economies – such as France, Italy, the UK, Canada, India, Indonesia, Brazil – also display relatively lower RMSEs (0.5 percentage points or less than the average). By contrast, Ireland, Iceland, Greece, Lithuania, Luxembourg, Latvia, the Slovak Republic and, to a lesser extent, Estonia, Hungary and the Netherlands present higher errors across all TiVA indicators considered. This relatively poor performance could reflect a higher volatility of the target variable, structural changes in the country’s engagement in global value chains, or poor performance during specific episodes, such as the 2008 global financial crisis.
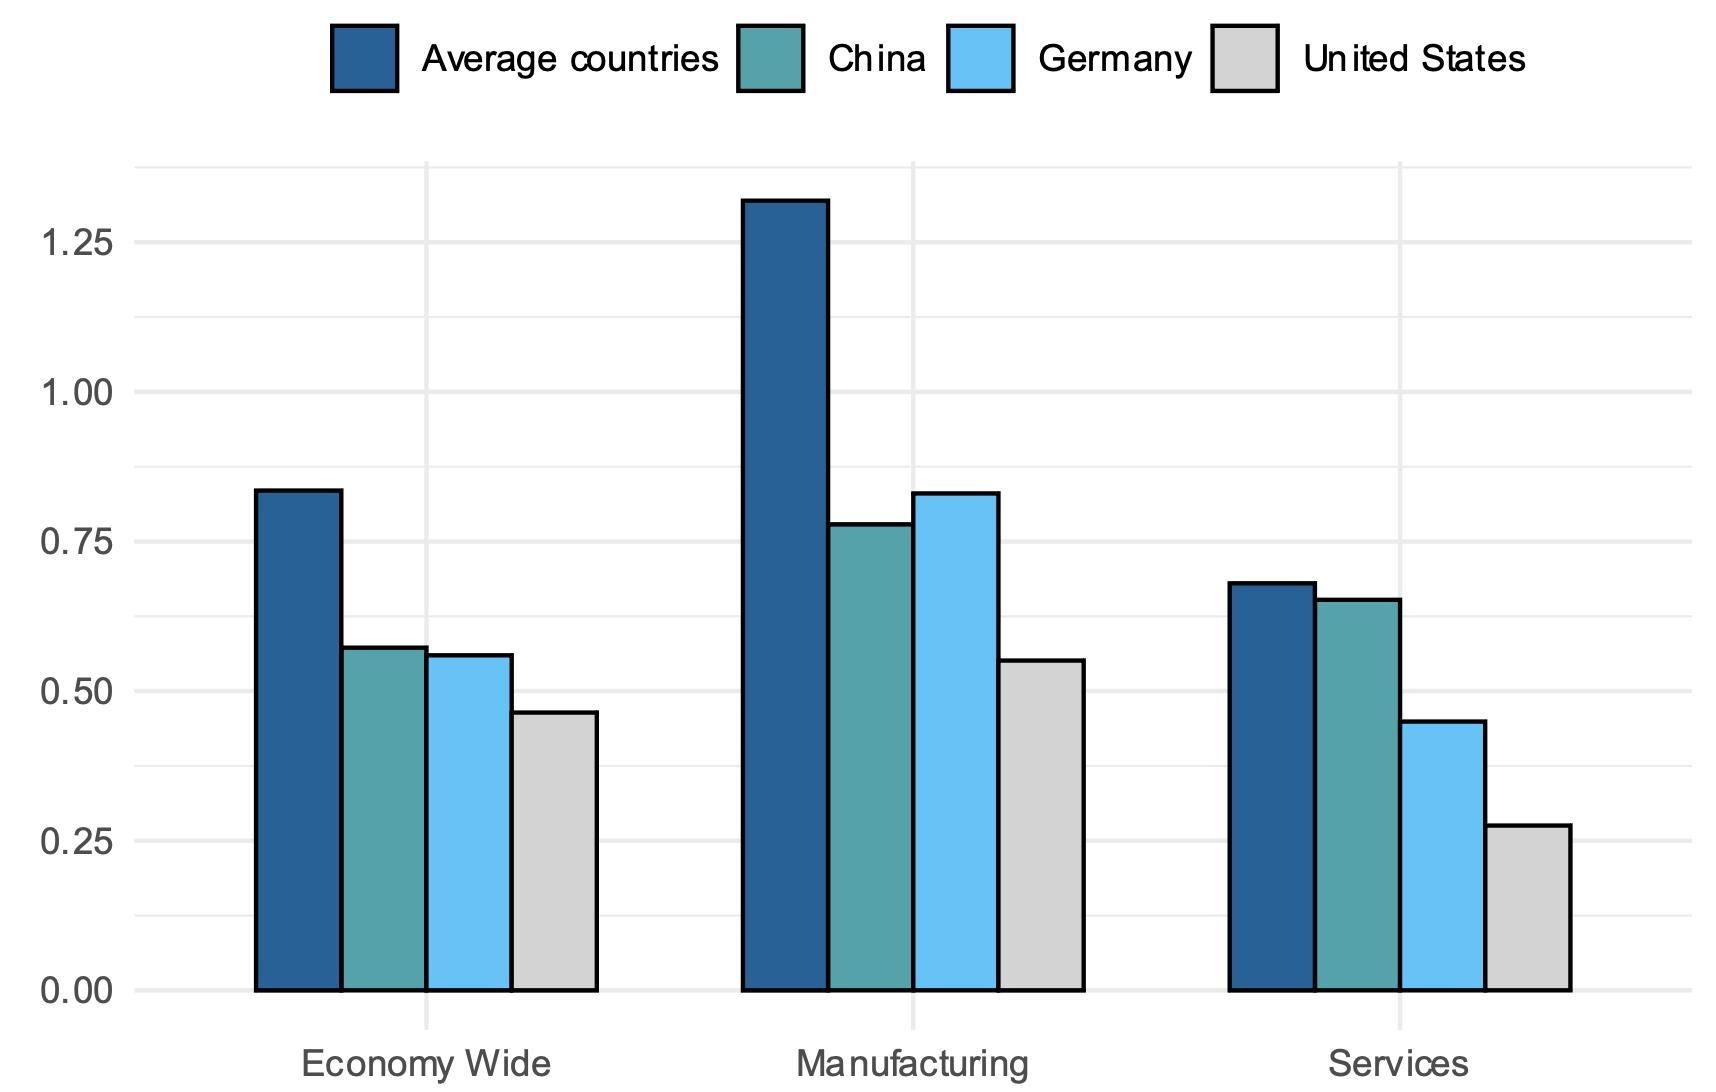
Performance across sectors also differs. Indeed, predictions errors for services and the aggregate economy are found to be lower than those for manufacturing. This is true on average across countries and for the US, China, and Germany, which display the lowest RMSEs overall (Figure 1). Differences between country averages and those countries are also larger in manufacturing than in services and in the economy as a whole. This reflects large errors in a handful of countries (Ireland, Luxembourg, Australia, Greece, Republic Slovak, Mexico, and Lithuania) which drive the average RMSEs in the manufacturing upwards.
Figure 1 RMSE economy-wide, manufacturing and services, selected economies (percentage points)
Note: RMSEs were averaged for the 41 countries at economy wide, manufacturing and services level.
Source: Authors’ calculations.
The share of domestic value added in exports is estimated to have fallen in 2021-22
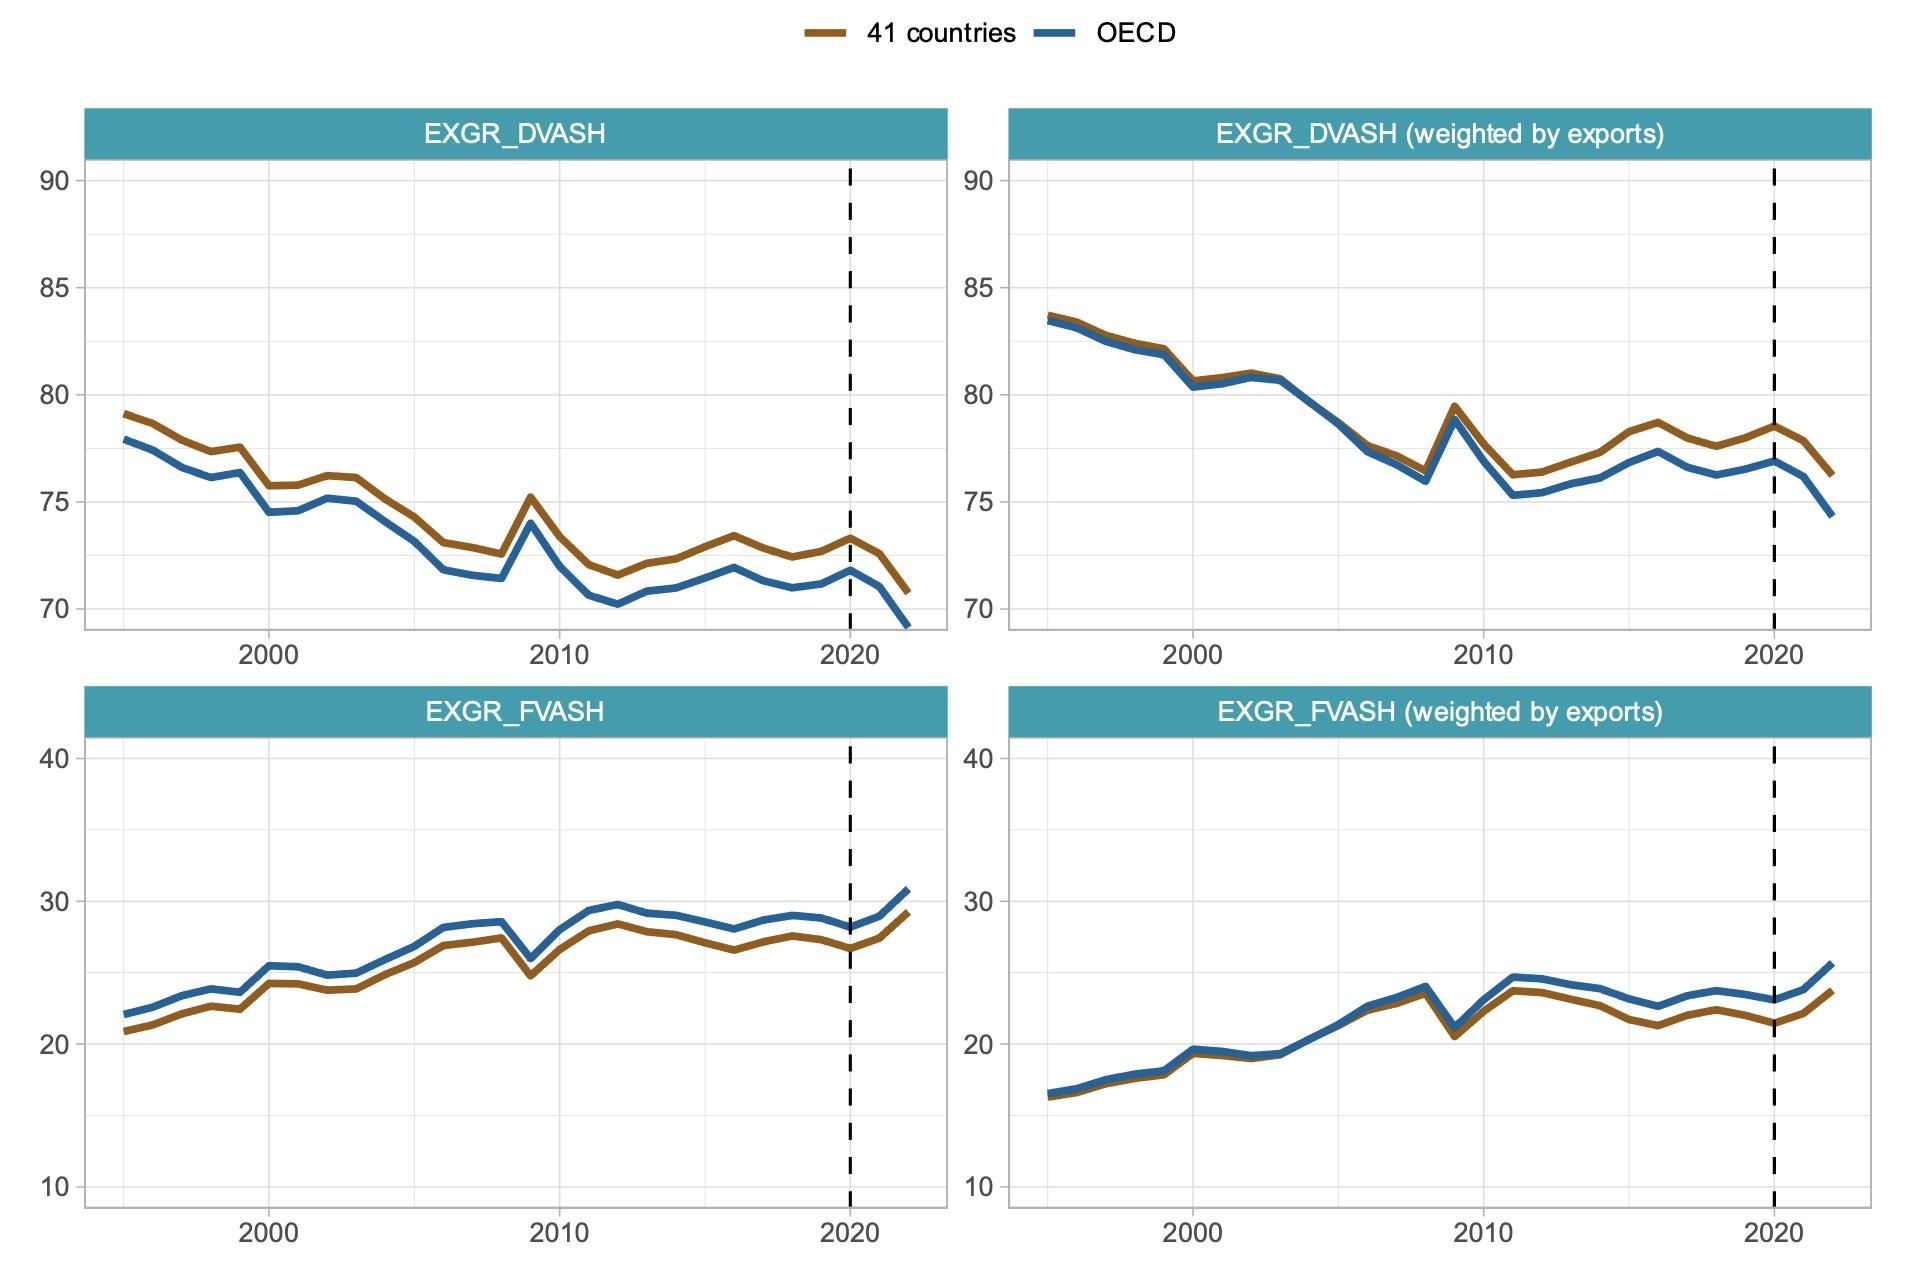
At the economy-wide level, the share of domestic value added in exports declined from 1995 up until the global financial crisis, as countries across the globe engaged in global value chains and substituted domestic value added with imported intermediates to produce exportable goods and services (Figure 2). This is consistent with Andras and Chor (2022). Since the financial crisis, the indicator has been broadly stable, a phenomenon often called ‘deglobalisation’ or ‘slowbalisation’ (Jaax et al. 2023). Using a different methodology, the authors of study from the Asian Development Bank also found a decline in domestic value added in 2020 for most of the economies in their sample (ADB 2022).
Figure 2 Evolution of the share of domestic value-added in exports at the economy-wide level (%)
Note: EXGR_DVASH stands for domestic value added share of gross exports. EXGR_FVASH stands for foreign value added share of gross exports. Average over the corresponding country’s domestic value-added shares of exports weighted with exports, not corrected for intra-region trade. This differs from estimates reported in the OECD TiVA database (Guilhoto, Webb and Yamano, 2022[6]). The OECD aggregate does not include Chile and Costa Rica. The OECD aggregate in TiVA database treats the OECD as a single economy and thus value added flows between OECD countries are regarded as domestic flows, while exports are to non-OECD members only.
Source: Authors’ calculations.
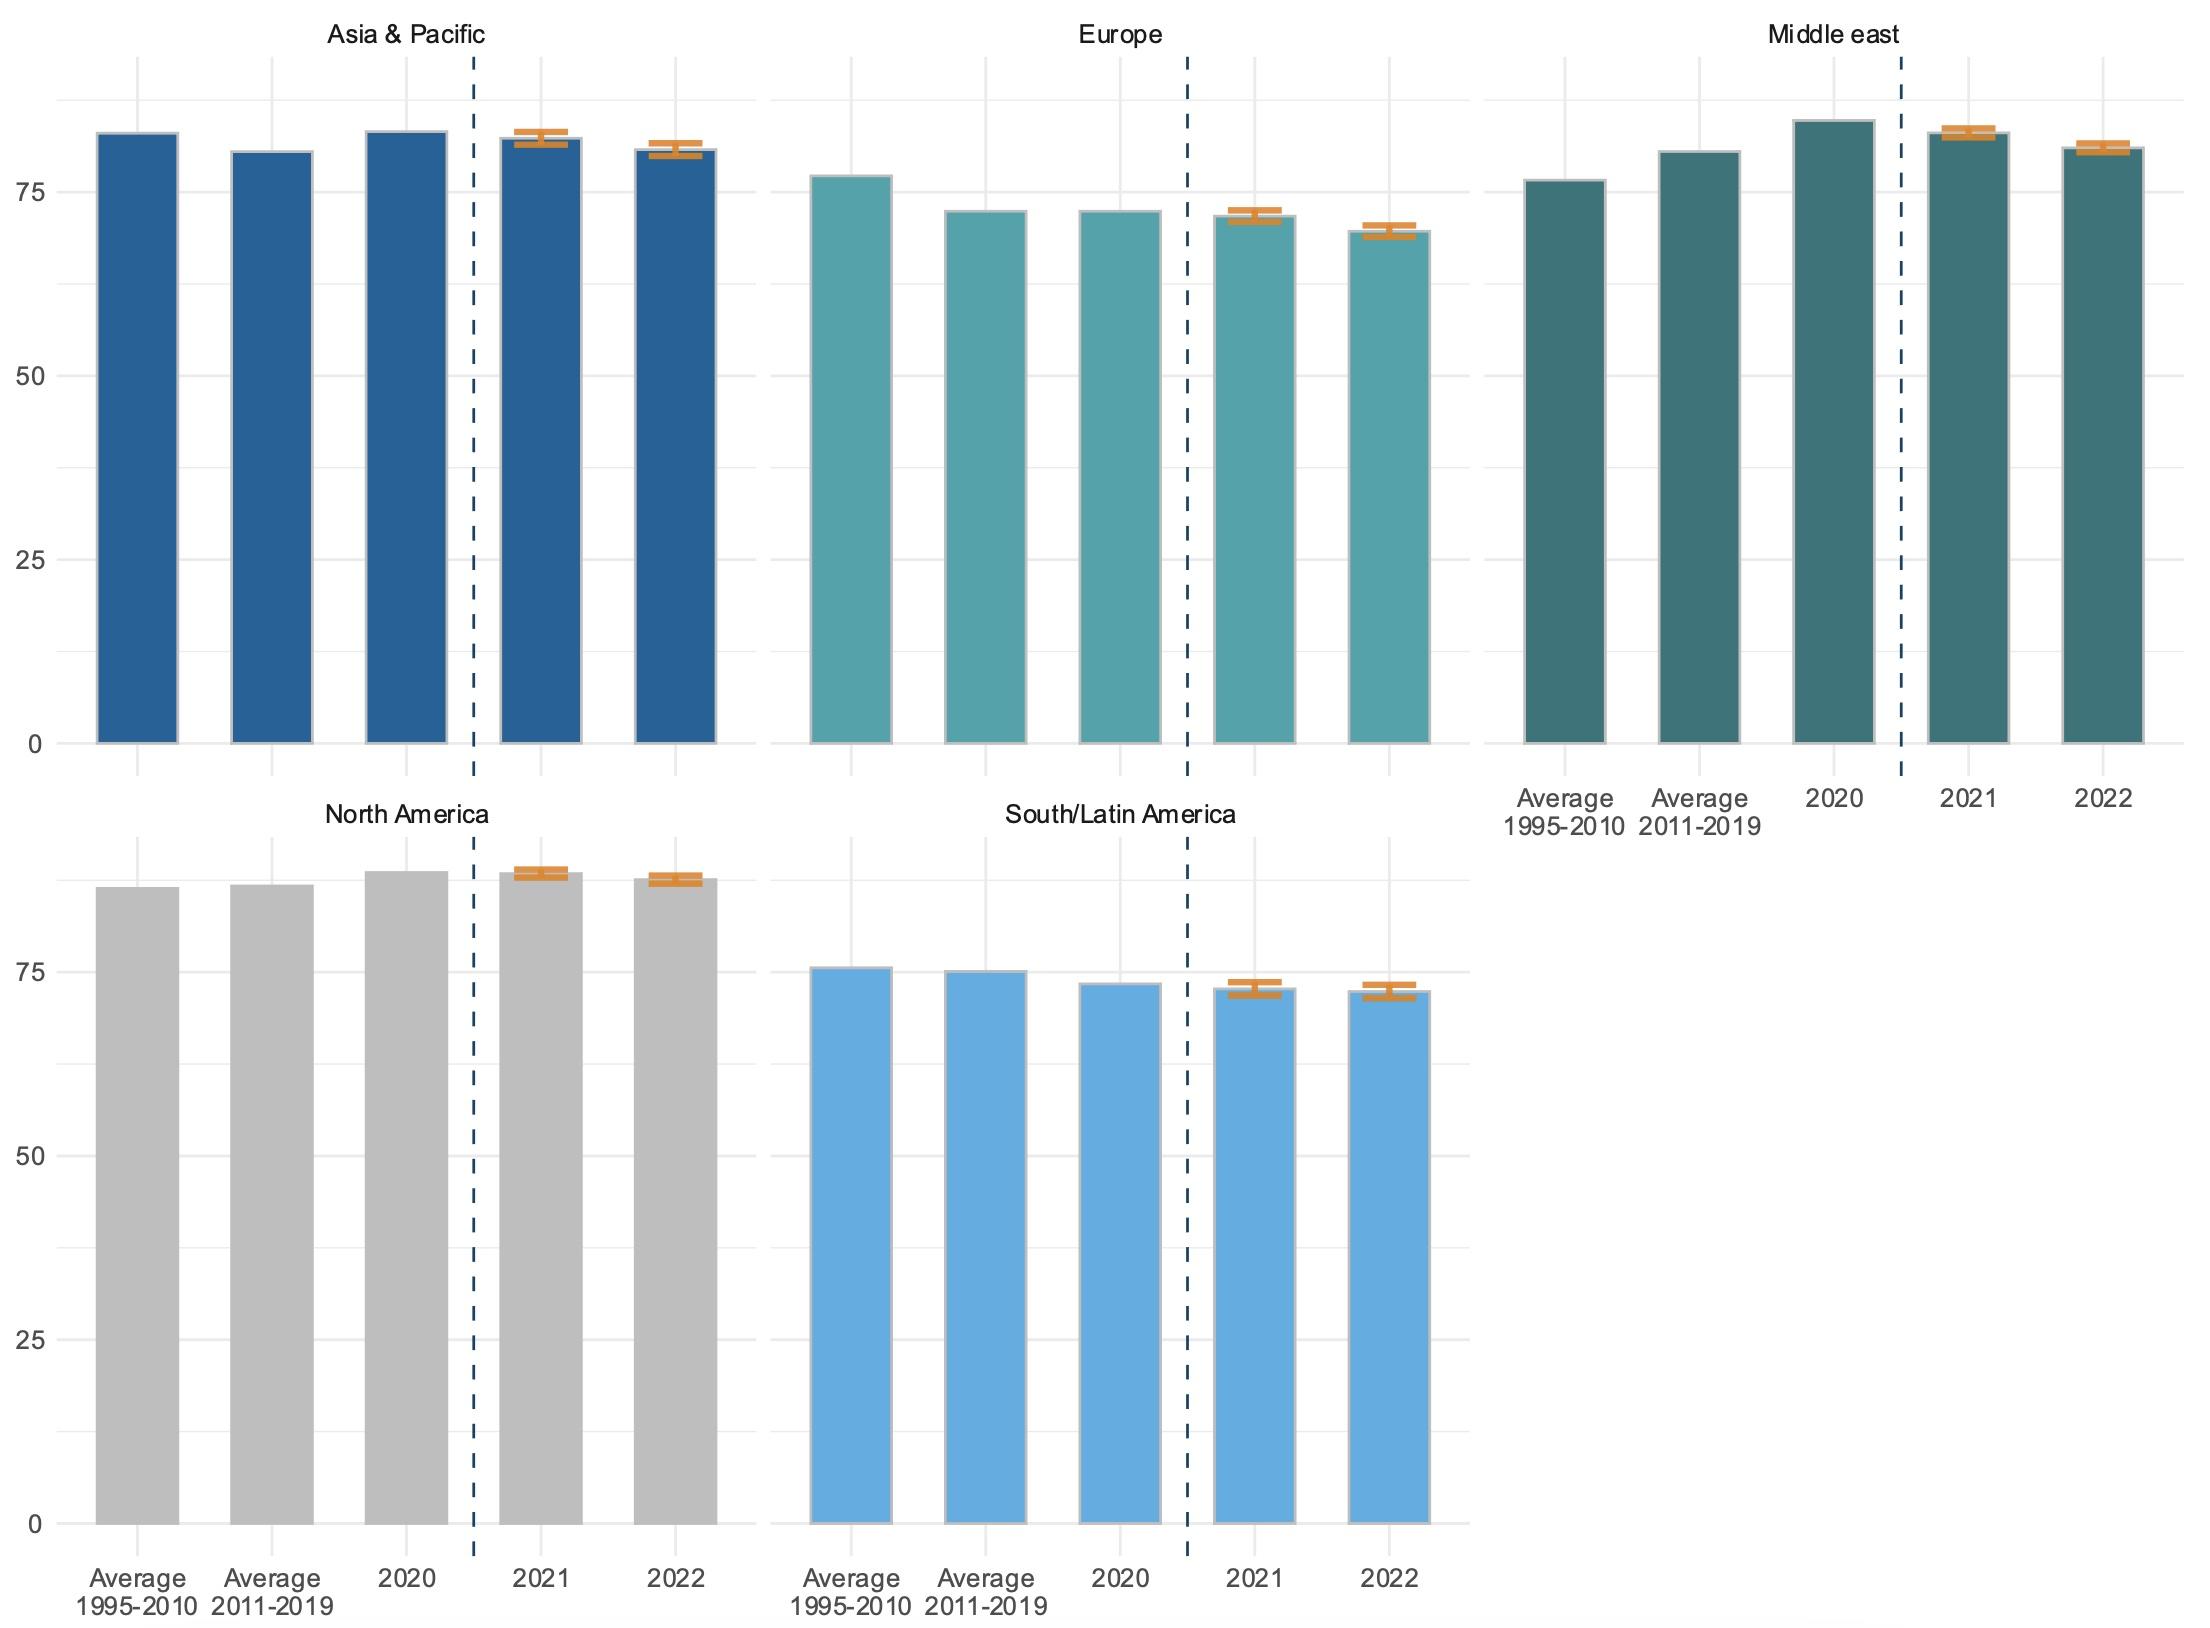
Nowcasts for 2021-22 suggest that the content of domestic value added in exports fell in 2021 and 2022, both on average across OECD countries, and at a more global level. The fall was widespread, with all the regions and the vast majority of the 41 countries covered in the analysis experiencing a drop in the domestic value-added content of exports (Figure 3). A reason for this could be the increases in commodity prices, most notably oil, in 2021 and 2022, which may have led to an increase in the foreign value-added of exports. It may also reflect the recovery in trade after the COVID-19 pandemic.
Figure 3 Share of domestic value-added in exports at the economy-wide level by region (%)
Note: Regional averages over the corresponding country’s domestic value-added shares of exports weighted with exports, not corrected for intra-region trade. This differs from estimates reported in the OECD TiVA database (Guilhoto, Webb and Yamano, 2022[6]). The OECD aggregate does not include Chile and Costa Rica. The OECD aggregate in TiVA database treats the OECD as a single economy and thus VA flows between OECD countries are regarded as domestic flows, while exports are to non-OECD members only. Error bands correspond to the nowcasted value -/+ the correspondent RMSE.
Source: Authors’ calculations.
Aggregates at the economy-wide level are mirrored by developments at the sectoral level. Most countries experienced a decline in the domestic value-added share in exports in 2021 and 2022 in manufacturing and services. At the same time, global trade did not contract in 2021-22 (CPB 2023).
The magnitude of the decline differs across sectors and appear stronger in manufacturing than in services for most economies. The contraction in manufacturing was particularly marked in Greece, India, and Korea. Germany stands out with a more pronounced fall predicted in services rather than in manufacturing.
A group of countries, most notably China, Mexico, and Australia, experienced only very light negative changes in the domestic value-added share in exports at both economy and sectoral level. Norway is the only country that recorded an increase in 2021, at the economy-wide manufacturing and services levels. In Canada, the indicator is nowcasted to decrease in 2022 after a very small increase in 2021. But those moves are marginal and within the confidence bands.
Domestic services value-added shares of exports are expected to have been broadly stable, while the foreign counterpart has increased
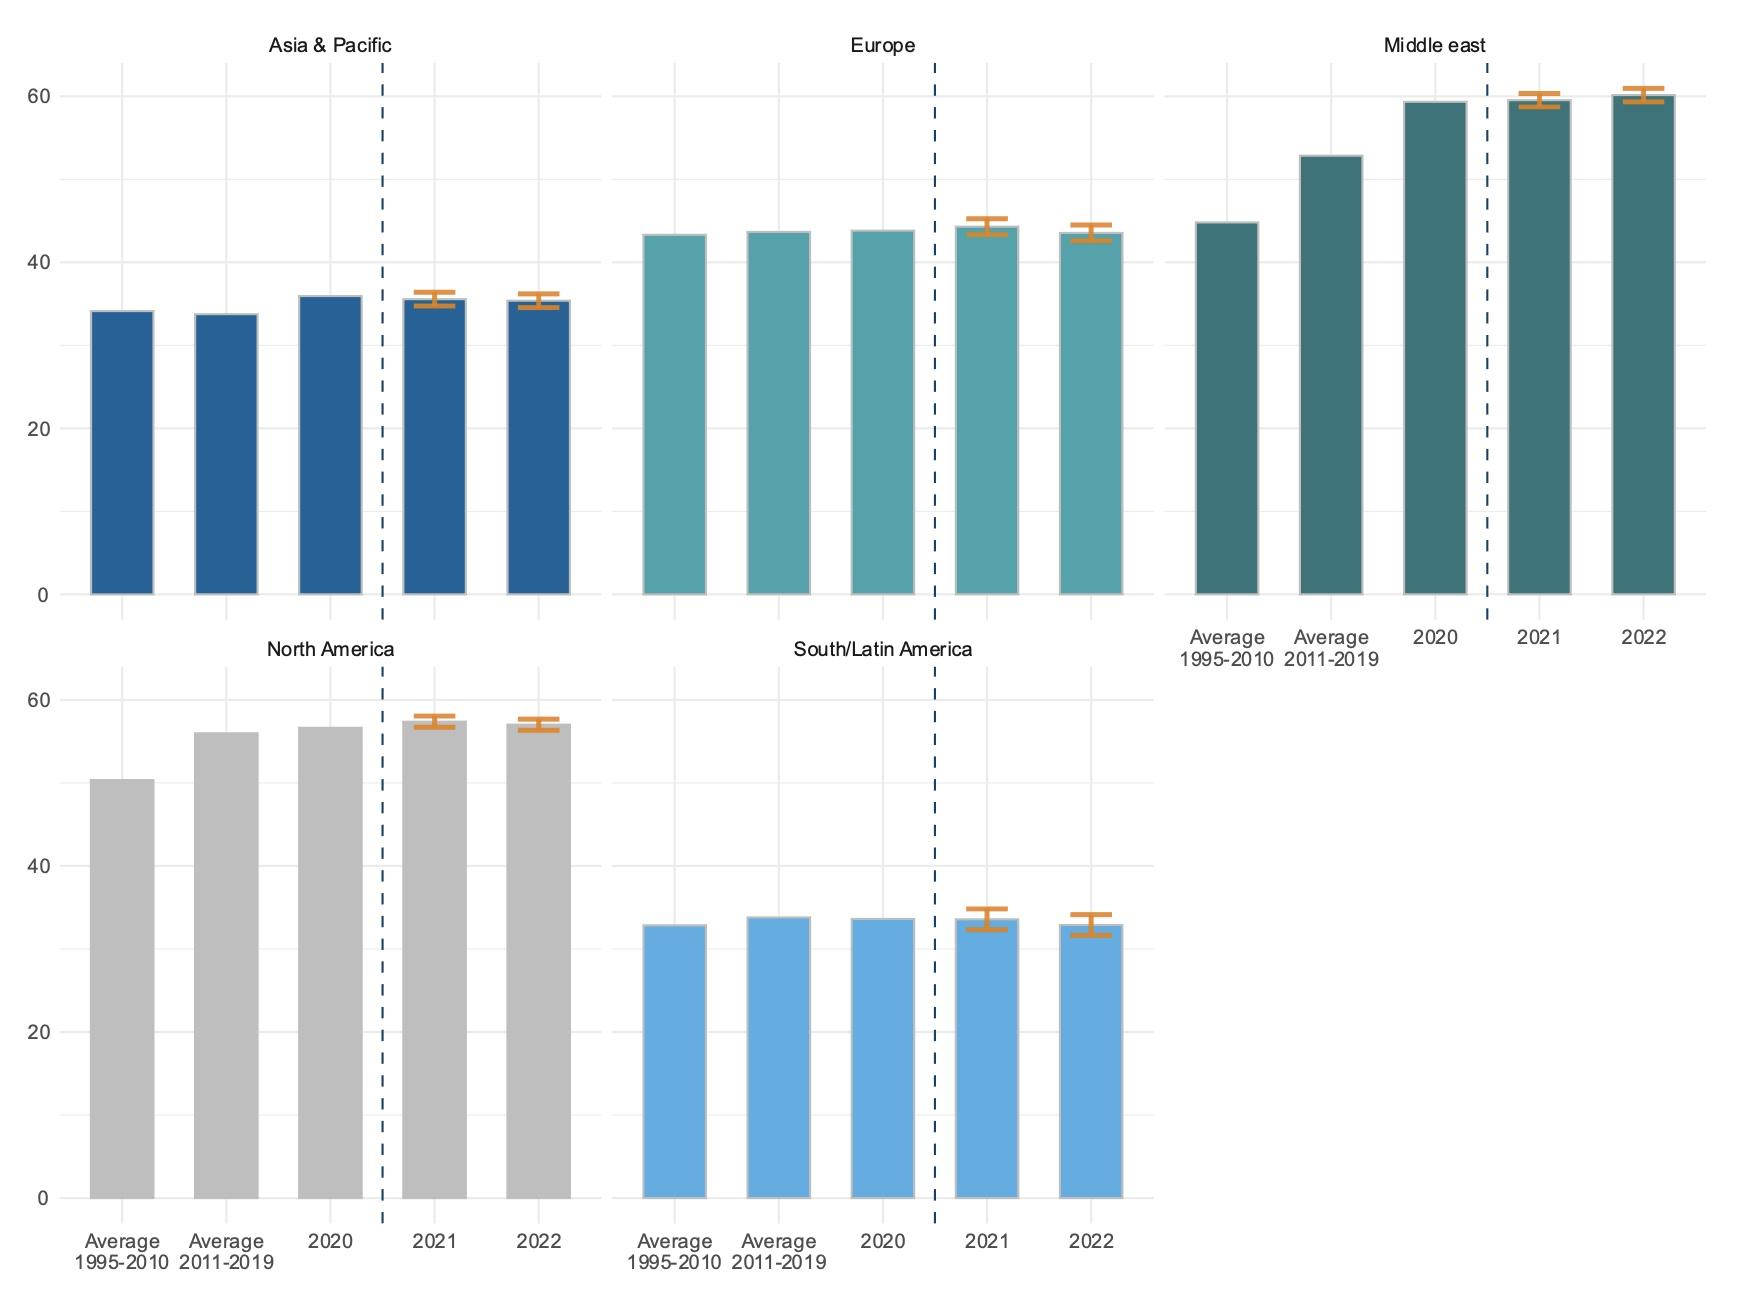
Nowcasts point to little movement in the domestic services content of exports in 2021 and 2022 in all the regions (Figure 4). This stability masks a wide disparity in the direction of the nowcast across countries, but also across sectors. While most countries experienced a decline in the indicator related to the manufacturing sector in 2021-22 and an increase in the agriculture sector, outcomes were much more diverse in the services sectors.
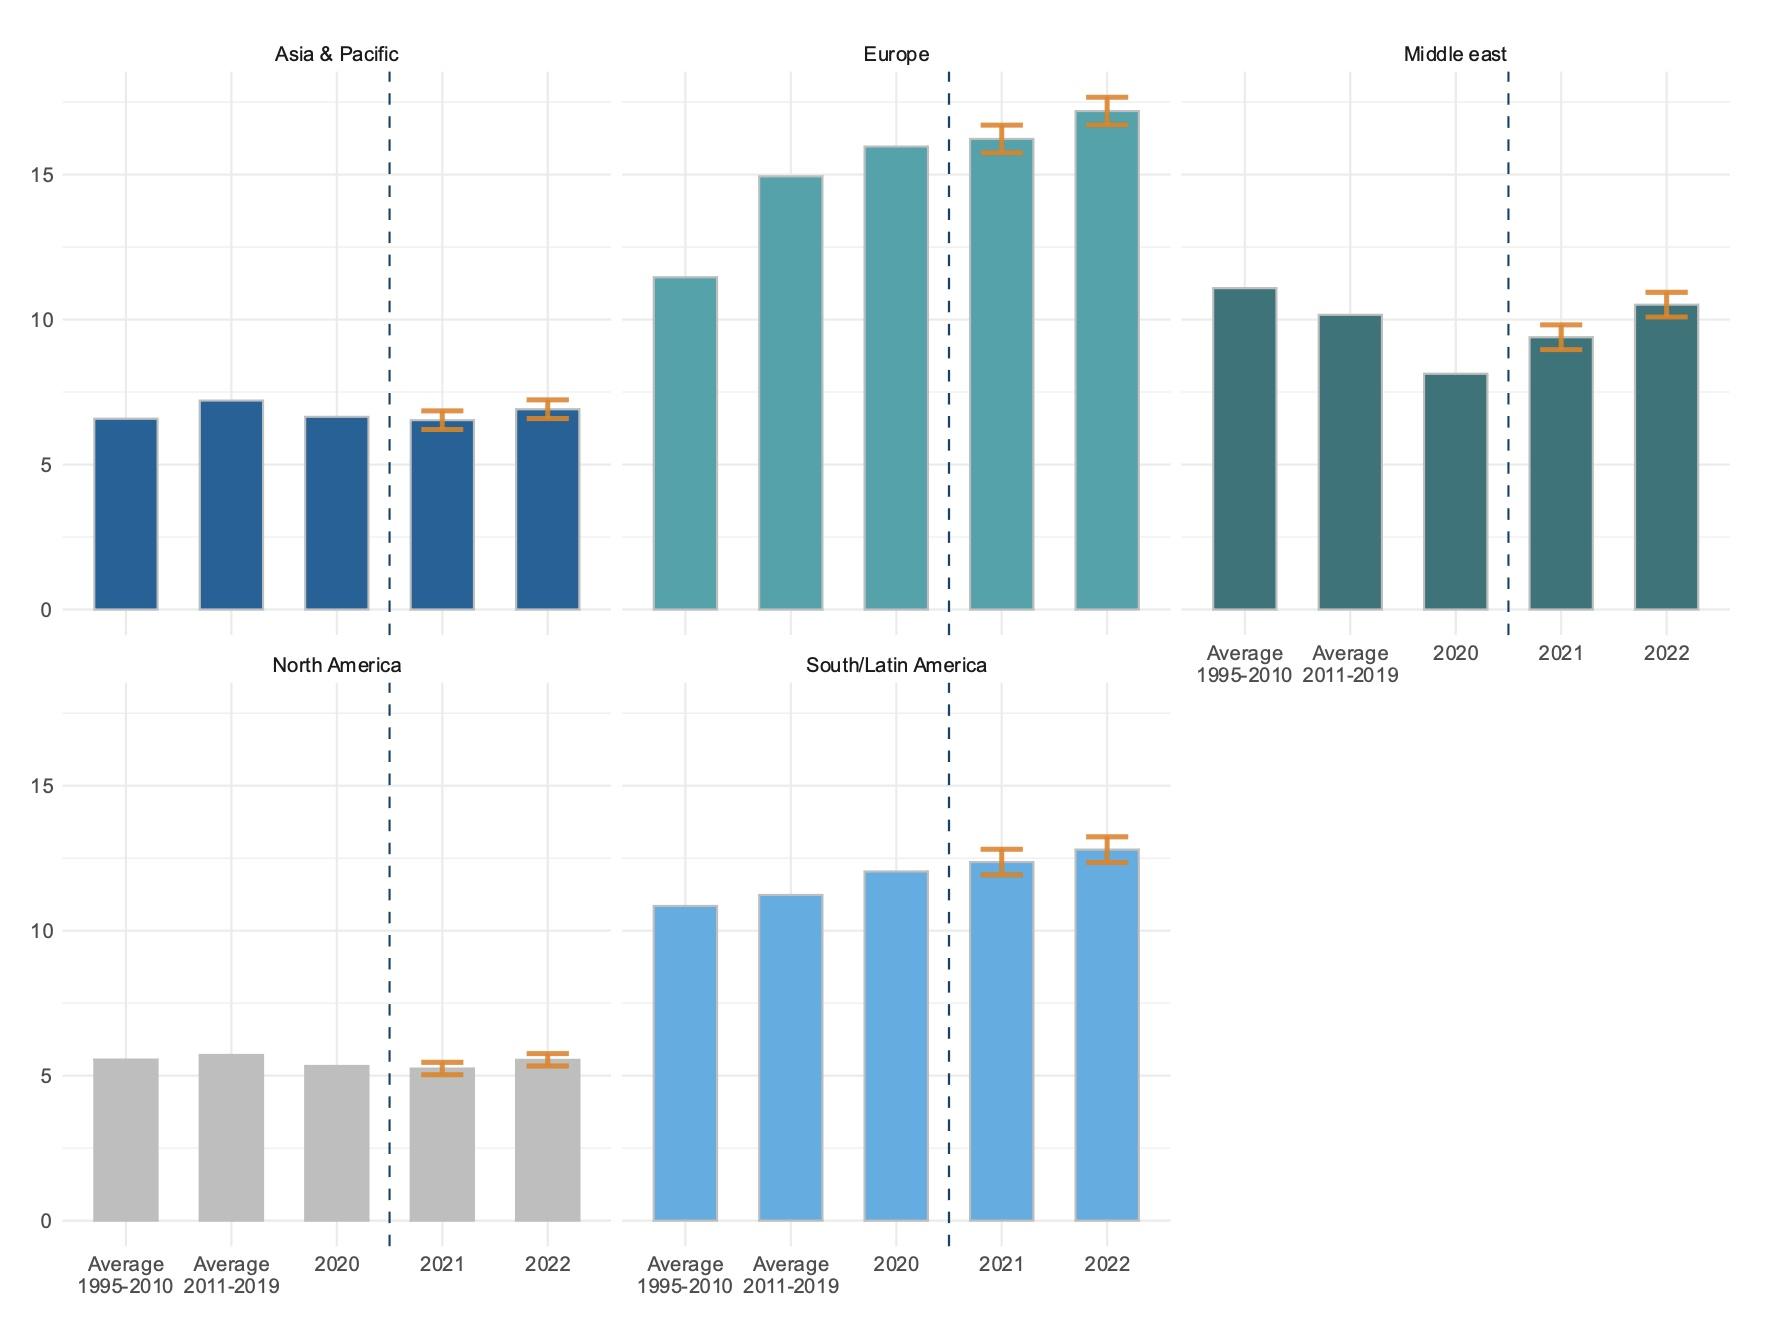
Figure 4 Services content of exports by region (%)
A) Domestic
B) Foreign
Note: Regional averages over the corresponding country’s domestic value-added shares of exports weighted with exports, not corrected for intra-region trade. This differs from estimates reported in the OECD TiVA database (Guilhoto, Webb and Yamano, 2022[6]). The OECD aggregate does not include Chile and Costa Rica. The OECD aggregate in TiVA database treats the OECD as a single economy and thus value added flows between OECD countries are regarded as domestic flows, while exports are to non-OECD members only. Error bands correspond to the nowcasted value -/+ the correspondent RMSE.
Source: Authors’ calculations.
By contrast, the foreign services content of exports is found to have increased during the period, notable in Europe (from 16% in 2020 to almost 18% in 2022) and the Middle East (from 9.4% in 2020 to 10.5% in 2022). This increase was broad-based across sectors.
The share of domestic value added embodied in foreign demand is nowcasted to have recovered in 2021-22
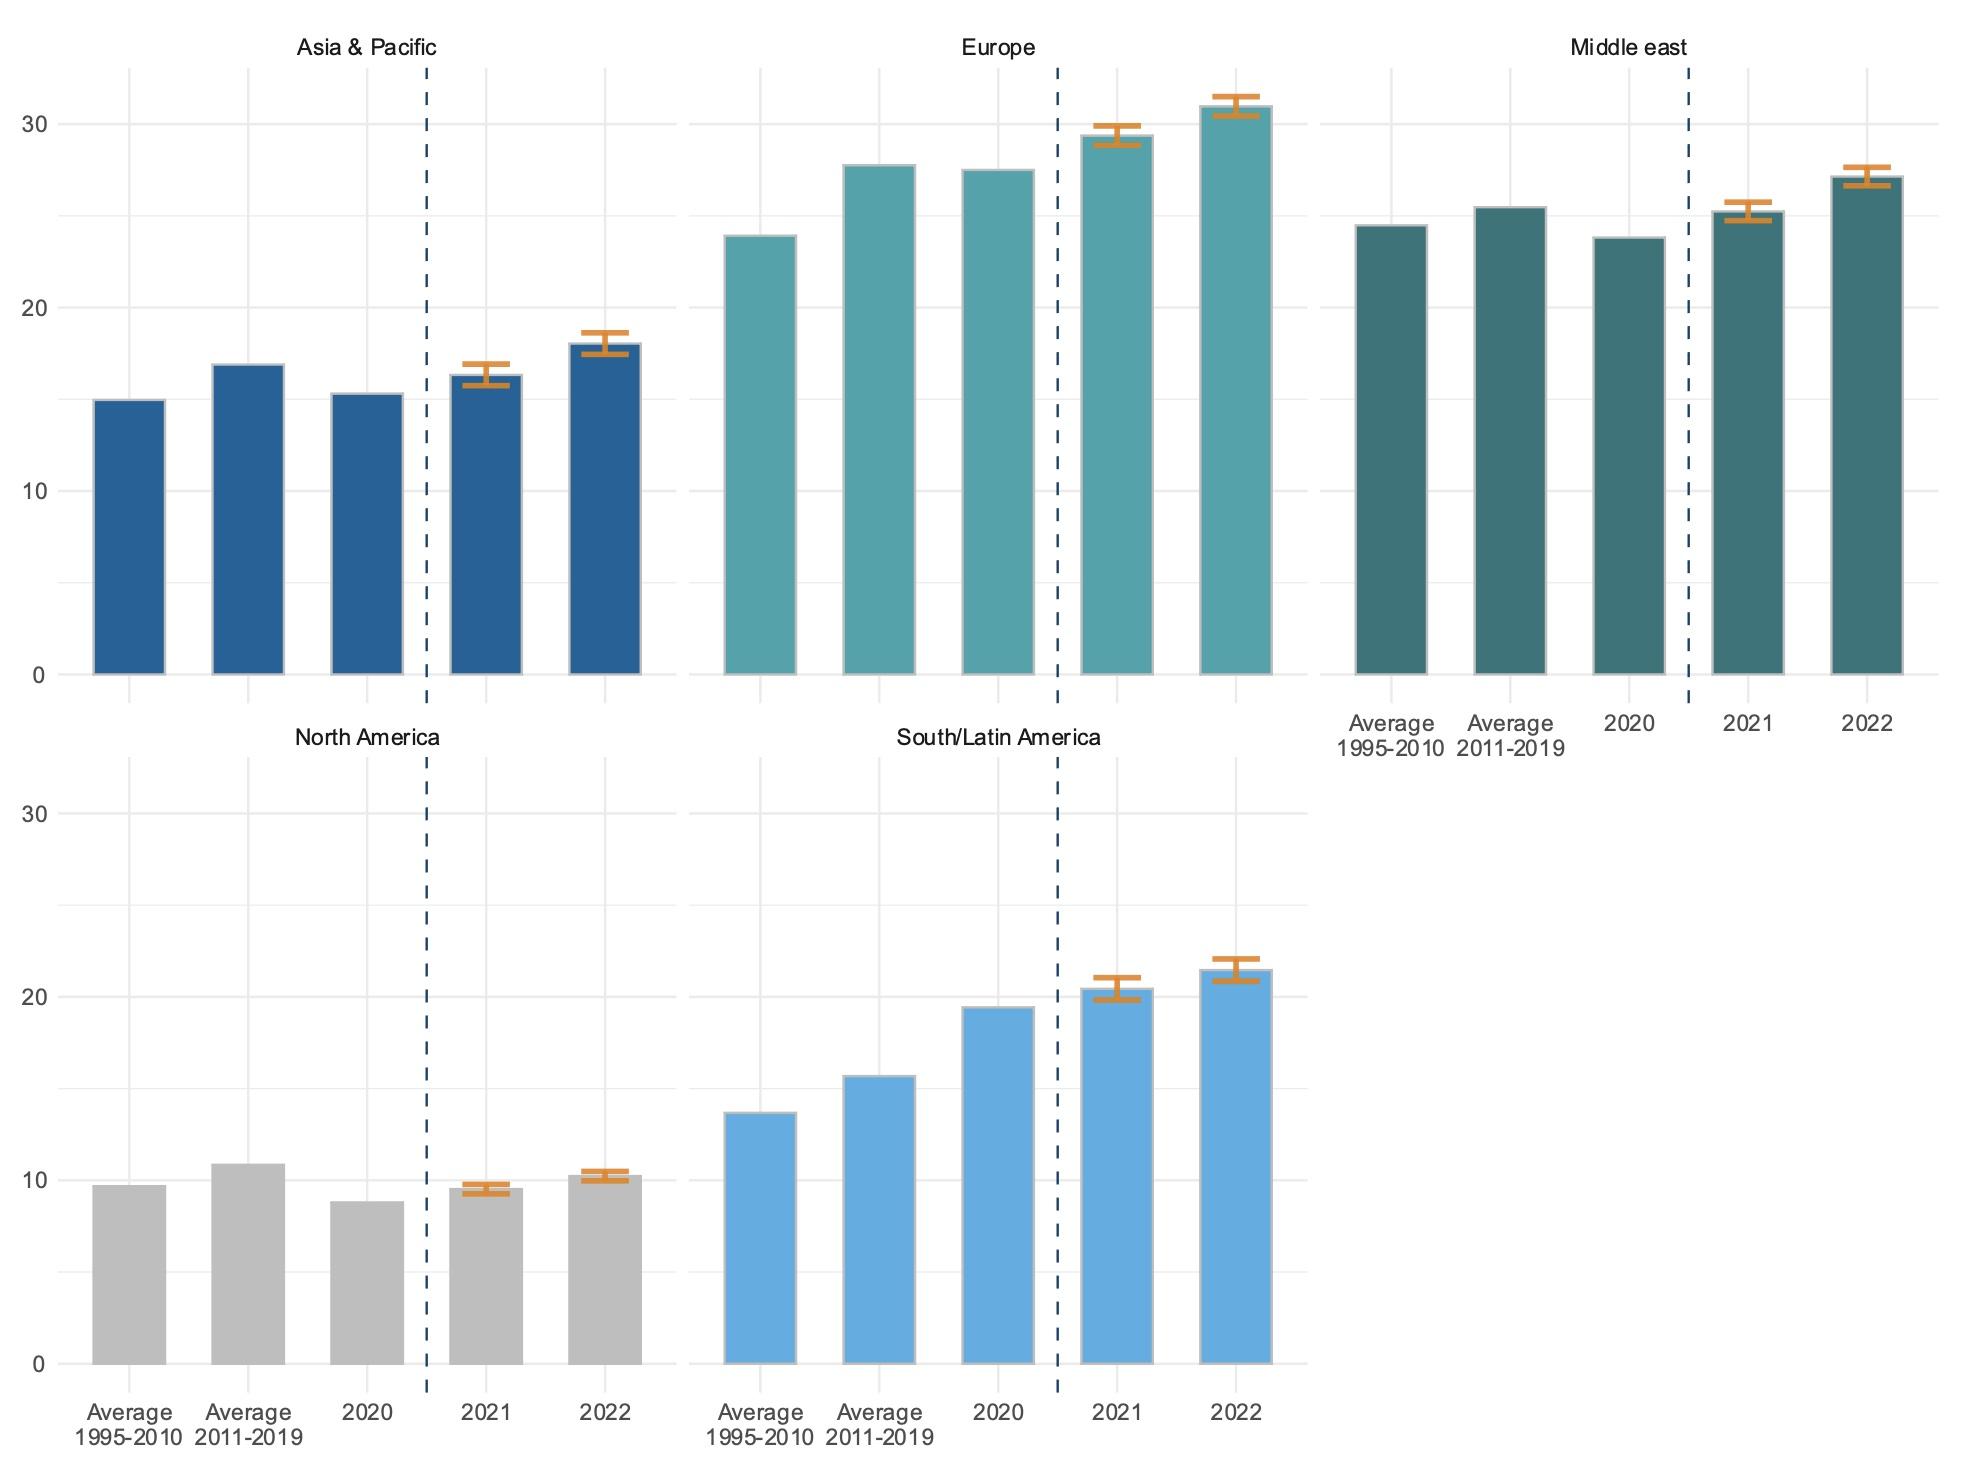
The share of domestic value added embodied in foreign final demand declined in most regions in 2020. But the fall is nowcasted to have been short-lived, and the share is estimated to have recovered steadily in 2021 and 2022 (Figure 5). Marked increases in the share can be observed in Europe (from 27.5% in 2020 to 31% in 2022), the Middle East (from 23.8% in 2020 to 27.1% in 2022) and South and Latin America (from 19.4% in 2020 to 21.5% in 2022). In all regions but North America, the indicator is expected to have exceeded in 2022 its pre-crisis level. While this stands in contrast to the decline of domestic value added as share of exports, other drivers of exports, influencing the competitiveness across countries may lead to the nowcasted increase of the domestic value added embodied in foreign demand.
Figure 5 Share of domestic value added embodied in foreign final demand by region (%)
Note: Regional averages over the corresponding country’s domestic value-added shares of exports weighted with exports, not corrected for intra-region trade. This differs from estimates reported in the OECD TiVA database (Guilhoto et al. 2022). The OECD aggregate does not include Chile and Costa Rica. The OECD aggregate in TiVA database treats the OECD as a single economy and thus value added flows between OECD countries are regarded as domestic flows, while exports are to non-OECD members only. Error bands correspond to the nowcasted value -/+ the correspondent RMSE.
Source: Authors’ calculations.
The increase is estimated to have occurred in most sectors and countries, with different magnitude. In the manufacturing sector, large increases are observed for the UK, Canada, China, and Mexico. In the services sectors, the rise is estimated to have been more homogenous across countries.
References
ADB - Asian Development Bank (2022), Economic Insights from Input-Output Tables for Asia and the Pacific.
Antras, P and D Chor (2022), Global Value Chains, Elsevier.
CPB Netherlands Bureau for Economic Policy Analysis (2023), World Trade Monitor 2023.
Guilhoto, M, C Webb and N Yamano (2022), “Guide to OECD TiVA Indicators”, OECD Science, Technology and Industry Working Paper 2022/02.
Jaax, A, S Miroudot and E van Lieshout (2023), “Deglobalisation? The reorganisation of global value chains in a changing world”, OECD Trade Policy Paper No. 272.
Mourougane, A, P Knutsson, R Pazos, J Schmidt and F Palermo (2023), "Nowcasting trade in value added indicators", OECD Statistics Working Paper 2023/03.
Schwellnus, C, A Haramboure and L Samek (2023), “Resilient global supply chains and implicatios for public policy”, VoxEU.org, 21 April.


