One purpose of macroeconomics is to make sense of stylised facts – observations that appear again and again across time and space. One such stylised fact is the Beveridge curve, the negative correlation between unemployment and vacancies, which was observed by Beveridge (1944). Currently, the dominating explanation of this relationship is that it is a result of search frictions, which are typically modelled by postulating a matching function (e. g. Petrongolo and Pissarides 2001, Mortensen and Pissarides 1994, Yashiv 2007, Daly et al. 2012). In the words of Elsby et al. (2015), the Beveridge Curve is considered to be a “close cousin” of the matching function.
According to the basic search-matching model, there are many vacancies when unemployment is low because it takes a longer time to fill the vacancies. When there are few workers looking for jobs, the duration of the vacancies increases, so there will be a larger stock for a roughly unchanged inflow. In a recent paper (Gottfries and Stadin 2023), my co-author and I argue that this cannot be the main explanation for the Beveridge curve. There are many vacancies in a boom, but it is not primarily because they are hard to fill. Instead, it is mainly because there is a large inflow of new vacancies when the labour market is tight.
We estimate matching functions on a large panel of monthly register data from the Public Employment Service in Sweden. The great advantage of register data compared to most survey data is that we have data not only on the stock but also on the inflow and outflow of vacancies. Estimating a ‘matching function’ with the outflow of vacancies as the dependent variable, we find no (or very weak) evidence that high unemployment speeds up the filling of vacancies. Still, there is a clear Beveridge curve in these data.
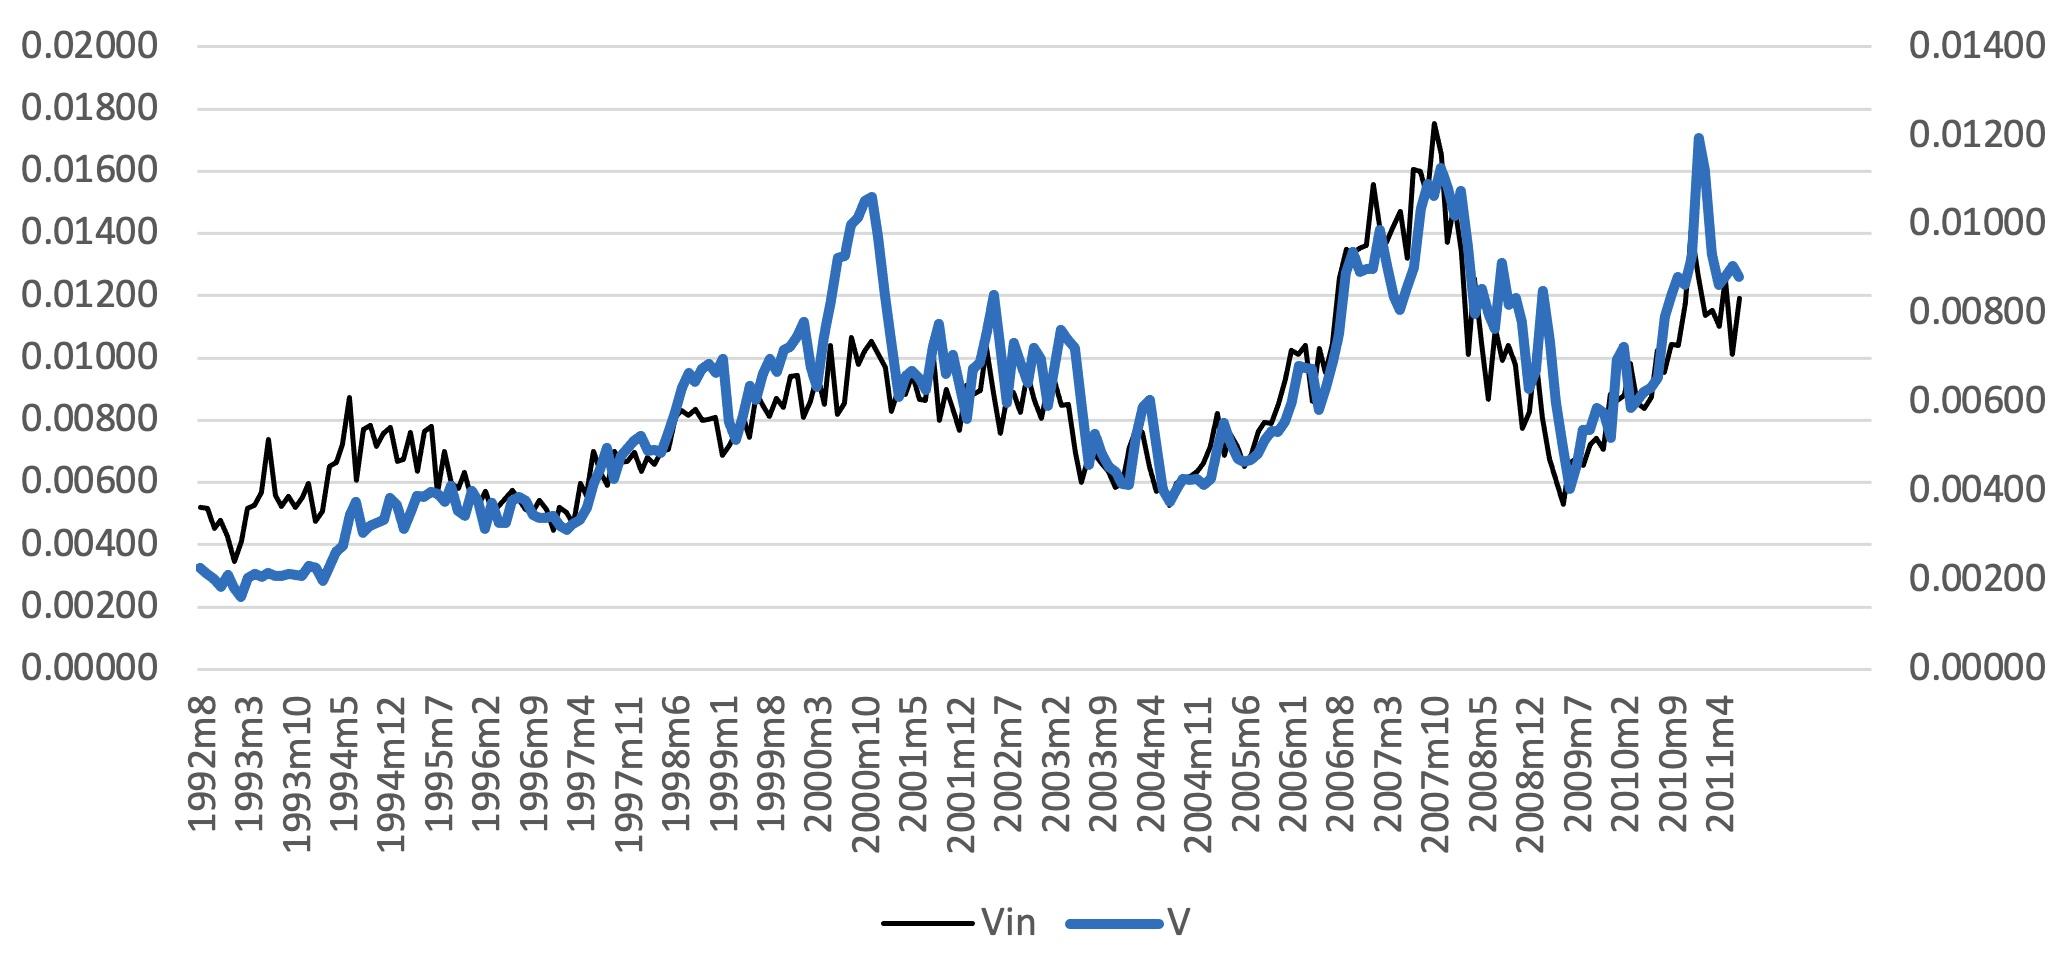
The empirical reason for this finding can be seen in Figure 1, which shows that the inflow and the vacancy stock for the period we investigate 1992-2011.
We see that variations of the stock of vacancies are almost completely explained by variations of the inflow. Hence, variations in the duration of vacancies must play a small role.
Figure 1 Inflow and stock of vacancies, Sweden
Note: Inflow and stock are measured relative to the labour force and seasonally adjusted.
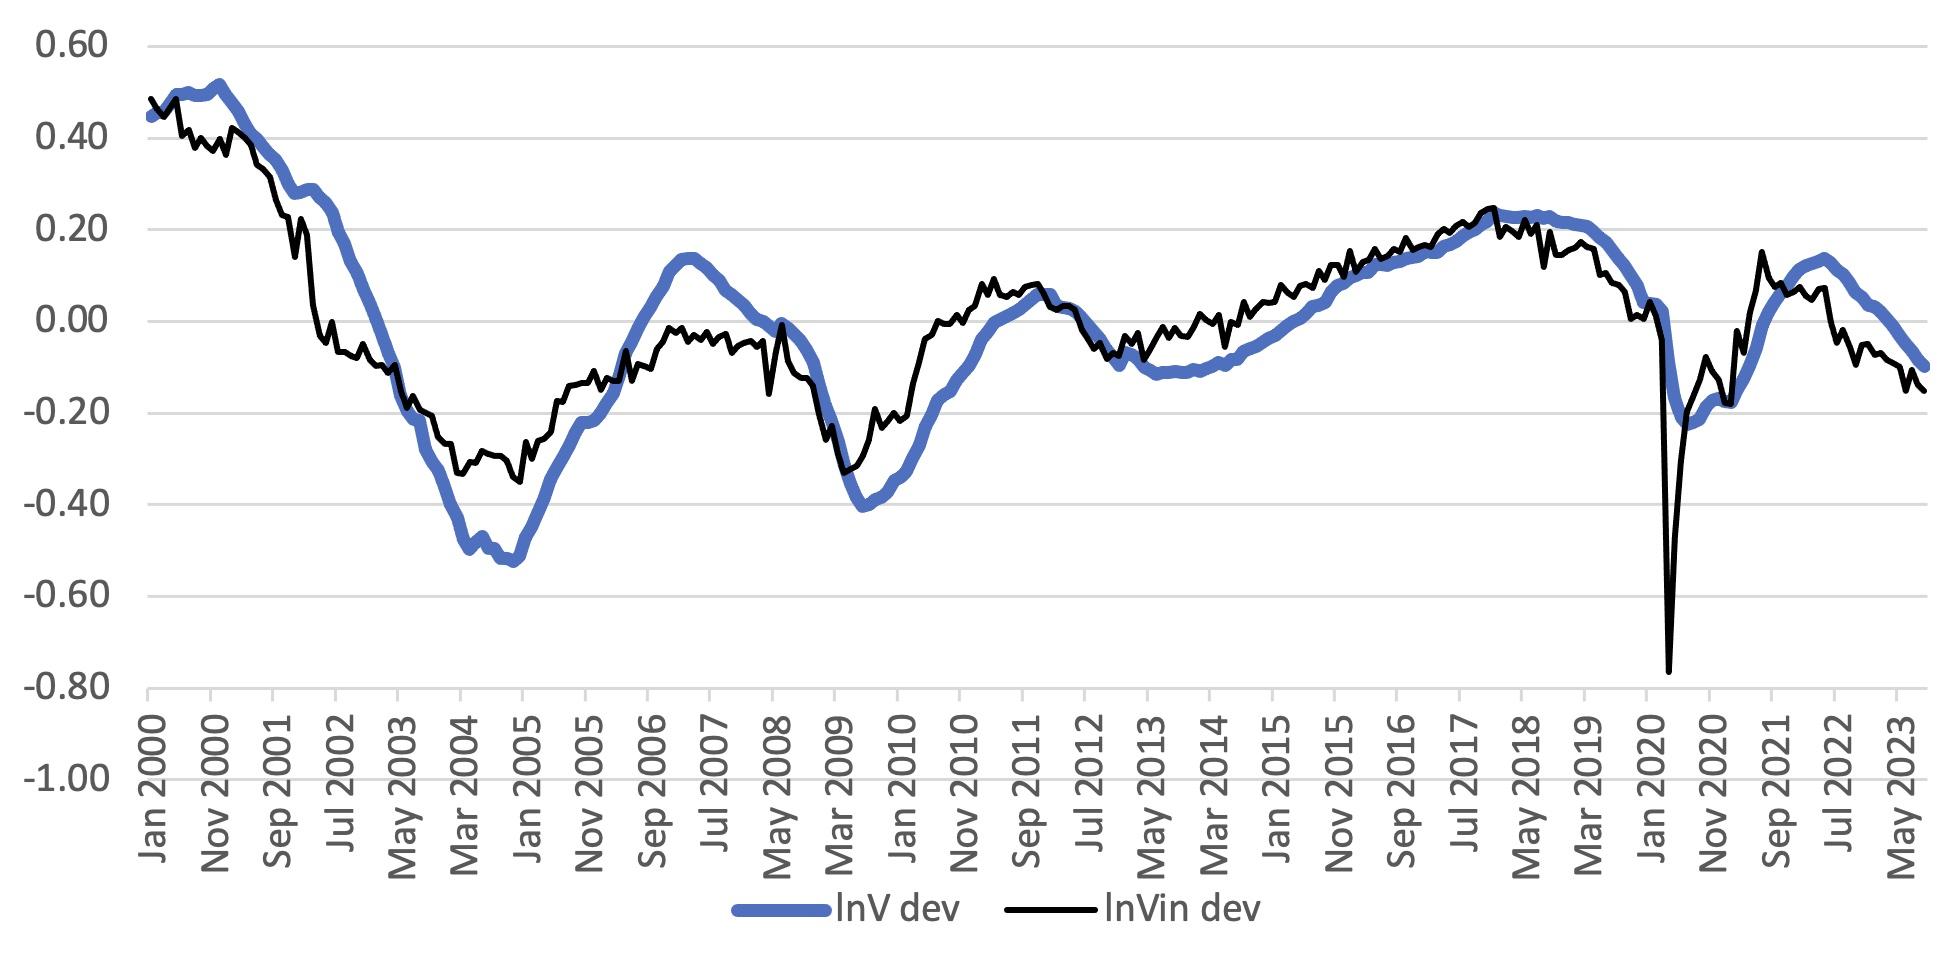
Many colleagues and referees appear to think that our finding is a peculiar anomaly, which must be specific to Sweden or to the time period that we study. However, a quick look at German data reveals a very similar pattern. After removal of log-linear trends, we find a very strong correlation between the inflow of new vacancies and the stock, again suggesting that medium-term variations of the stock are mostly the result of variations of the inflow rather than the duration.
Figure 2 Inflow and stock of vacancies, Germany
Note: Seasonally adjusted data, log deviations from trend.
Comparing our results to findings in the literature, we find mixed results, but papers that use similar panel data have found similar results. Kangasharju et al. (2005) used very similar panel data for Finland and found a very small effect of unemployment on the outflow of vacancies. On the other hand, Sunde (2007) found a positive effect using data for occupations in Germany. One reason for the difference may be that he used yearly data and only initial stocks as explanatory variables. We have monthly data and stocks as well as inflows of vacancies and unemployed workers as explanatory variables.
Studies which use total hires as the dependent variable typically find hires per vacancy to be countercyclical (e.g. Davis et al. 2013), but this is not proof that vacancies are harder to fill in good times because most of the hires are not hires for the vacancies that we have in our data. It is reasonable to assume that hires via informal contacts (such as recalls) are less pro-cyclical than hires via reported vacancies, and then total hires per reported vacancy will be countercyclical.
Our estimates are consistent with the view that employers typically receive many applications for a job opening. They screen and rank the applicants and make an offer to the best applicant and, if that person turns down the offer, they quickly make an offer to the next person in line, similarly to what happens in the economist job market. This interpretation is consistent with the findings of van Ours and Ridder (1993), who argued that vacancy durations are periods of selection rather than search.
But what then explains the Beveridge curve? Why is there a large inflow of vacancies in a tight labour market? A natural explanation is that there is high turnover. When it is easy to find a job, many employed job seekers find new jobs, leaving vacancies to be filled by new workers, who may also come directly from other jobs. This leads to vacancy chains, which become longer when the labour market is tight. This explanation of the Beveridge curve was proposed by Akerlof et al. (1988) and Mercan and Schoefer (2020) report recent evidence of vacancy chains.
In our study, we show that a turnover model without search frictions can explain the Beveridge curve, the job finding rate, and the countercyclical flows in and out of unemployment.
In order to match the data, we add some features to the Akerlof-Rose-Yellen model. First, we assume that firms can recruit workers without posting vacancies at the Public Employment Service. They may recall workers who were previously laid off or use other informal channels. Second, we assume that unemployed workers are at a disadvantage in the competition for jobs compared to employed job seekers. Both these features turn out to be important for matching the data. With these additions, we estimate the parameters of the model and we find that our model gives a reasonably good explanation of the Beveridge curve, the job finding rate, and the countercyclical flows in and out of unemployment.
On-the-job search has been incorporated into search-matching models, and Fujita and Ramey (2012) and Fujita and Nakajima (2016) show that its inclusion helps to explain the volatility of vacancies. We go further, showing that (1) estimation of a matching function for vacancies does not support an important role of search frictions, and (2) a model with on-the-job search can explain the Beveridge curve quantitatively without search frictions. The bottom line is that when we see a lot of vacancies, we should not conclude that firms have trouble finding workers but that there is a lot of turnover in the labour market.
How we understand the Beveridge curve is important for policy. If the main problem is information frictions, giving unemployed workers and firms assistance and incentives to search should be an efficient way to combat unemployment. If unemployed workers are unable or unwilling to compete for many of the jobs, skill formation, wage flexibility, job subsidies, and incentives to accept jobs are more important factors that policy needs to focus on.
References
Akerlof, G A, A K Rose and J L Yellen (1988), “Job Switching and Job Satisfaction in the U.S. Labor Market”, Brookings Papers on Economic Activity 1988(2): 495-594.
Beveridge, W H (1944), Full Employment in a Free Society, Allen.
Daly, M C, B Hobijn, A Sahin and R G Valletta (2012), “A Search and Matching Approach to Labor markets: Did the Natural Rate of Unemployment Rise?”, Journal of Economic Perspectives 26: 3-26.
Davis, S J, R J Faberman and J C Haltiwanger (2013), “The Establishment-Level Behavior of Vacancies and Hiring”, The Quarterly Journal of Economics 128: 581-622.
Elsby, M W L, R Michaels and D Ratner (2015), “The Beveridge Curve: A Survey,” Journal of Economic Literature 53: 571-630.
Fujita, S and G Ramey (2012), “Exogenous and Endogenous Separation,” American Economic Journal: Macroeconomics 4: 68-93.
Fujita, S and M Nakajima (2016), “Worker Flows and Job Flows: A Quantitative Investigation,” Review of Economic Dynamics 22: 1-20.
Gottfries, N and K Stadin (2023), “Matching and the Beveridge Curve – A Reinterpretation,” revised version of CESifo Working Paper 7689.
Kangasharju, A, J Pehkonen and S Pekkala (2005), “Returns to Scale in a Matching Model: Evidence from Disaggregated Panel Data,” Applied Economics 37: 115-118.
Mercan, Y and B Schoefer (2020), “Jobs and Matches: Quits, Replacement Hiring, and Vacancy Chains,” American Economic Review: Insights 2: 101-124.
Mortensen, D T and C A Pissarides (1994), “Job Creation and Job Destruction in the Theory of Unemployment,” Review of Economic Studies 61: 397-415.
Petrongolo, B and C A Pissarides (2001), “Looking into the Black Box: A Survey of the Matching Function,” Journal of Economic Literature 39: 390-431.
Pissarides, C A (2000), Equilibrium unemployment theory, MIT Press.
Sunde, W (2007), “Empirical Matching Functions: Searchers, Vacancies, and (Un-)biased Elasticities,” Economica 74: 537-560.
van Ours, J and G Ridder (1993), “Vacancy Durations: Search or Selection?,” Oxford Bulletin of Economics and Statistics 55: 187-198.
Yashiv, E (2007), “Labor Search and Matching in Macroeconomics,” European Economic Review 51: 1859-1895.


