If we were to believe technology cheerleaders, cash is about to disappear. It has already almost done so in Sweden (Skingsley 2017) and thanks to both new hardware (mobile phones and near-field communication) and software (internet, instant payment systems), it will disappear everywhere else soon.
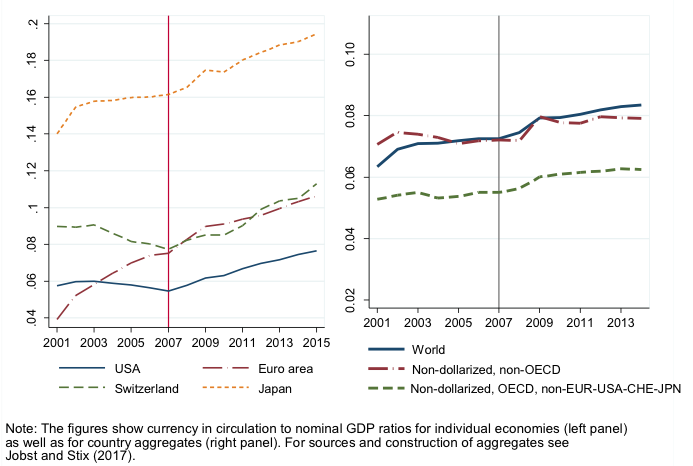
Appealing as it might be, however, this story does not match with the empirical evidence. Goodhart and Ashworth (2014) noted a “remarkable” increase in the ratio of currency to GDP in the UK from 13.3% in 2007 to 16.1% in 2014. In the US and the Eurozone, people not only hold sizeable amounts of physical cash – in 2016 per capita holdings were around $4,200 and €3,400, respectively – but, even more puzzling, cash holdings relative to nominal GDP have increased in recent years (Figure 1, left panel).
Figure 1 Currency in circulation over nominal GDP (%)
Attempts to explain this apparent paradox typically consider currency-specific factors. US dollars, euros, and Swiss francs are commonly used and hoarded abroad (Bartzsch et al. 2013, Judson 2017, Assenmacher et al. 2017), so increasing circulation might reflect foreign demand. In the case of sterling, which is not an international currency, Goodhart and Ashworth (2014, 2017) attribute the increasing use of cash after 2007 to a thriving shadow economy.
The increase in cash demand is a widespread phenomenon
As we show in a recent paper, the increase in cash demand is not restricted to a handful of currencies but is a broader phenomenon (Jobst and Stix 2017). We collected data on currency circulation for a sample of economies covering 96% of world GDP from 2001 until 2014. Three stylised facts stand out:
- Aggregate currency circulation at the world-level has increased significantly, from 6.5% of nominal GDP in 2001 to close to 8.5% in 2014 (Figure 1, right panel).
- Sub-aggregates reveal that circulation increased for both international and non-international currencies as well as OECD (i.e. richer) and non-OECD (i.e. less rich) economies (Figure 1).1
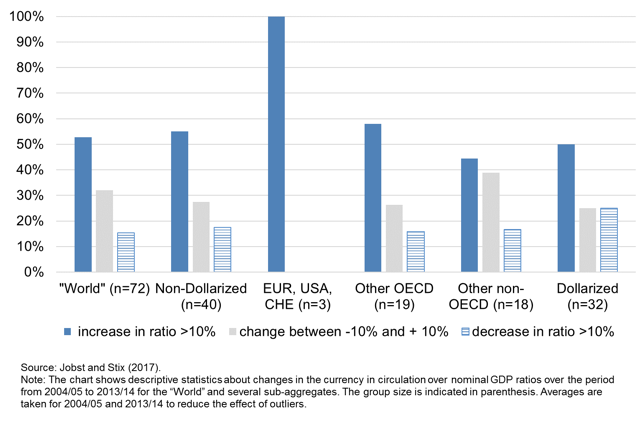
- Finally, also within sub-aggregates the increase in circulation is broad-based and not limited to a handful of larger economies (Figure 2). While the ratio declined by more than 10% in 11 economies, for the sample of 72 economies, the median change between 2004 and 2014 was +13%.
Figure 2 Changes in currency in circulation over nominal GDP ratios, 2004 to 2014
Both the magnitude of cash circulation and its increase over the past decade raise crucial questions for central banks and policymakers. What explains the puzzling size of cash circulation? Can the increase over time be explained by conventional economic forces (e.g. lower interest rates), or are there alternative explanations? What does the apparent demand for cash imply for considerations to phase out or to restrict the use of cash?
How big is big? The recent increase in cash demand is large in a long-run perspective
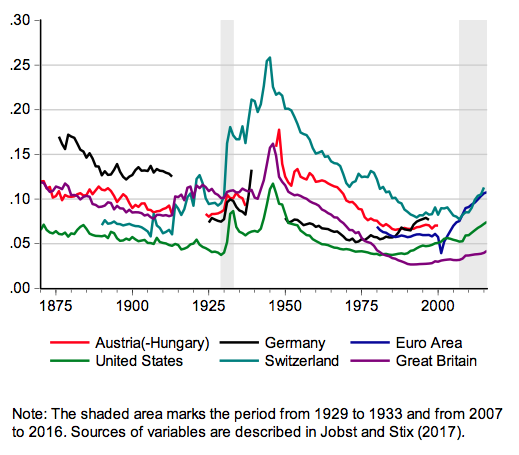
To put the recent development in cash demand into perspective, we looked at the evolution of cash circulation over the past 150 years for a sample of five countries for which such data are available, plus the Eurozone.2 The following main observations stand out:
- While over the long-term cash demand declined between 1890 and 1990, as expected, the decline is not uniform. In particular, the high point in currency in circulation was reached not in the 19th century but during WWII.
- Consequently, the common focus on post-WWII data that shows a continuous decline in cash usage from very high levels, usually associated with innovations in payment technology, give a ‘biased’ picture of the longer-term trend covering the past century.
- Since the 1980s/90s the declining trend has come to a halt or even reverted in all economies considered.3
- Large shocks seem to have persistent effects on the level of circulation as is evidenced by data for the financial crises of the 1930s (shaded in grey in Figure 3) and WWII.
- In the long-run perspective, the recent increases are sizeable.
Figure 3 A longer term view on currency in circulation over nominal GDP (%)
Low interest rates can only explain part of the recent increases in currency demand
Several arguments could rationalise the recent increase in cash demand: low interest rates, an increase in shadow economic and/or criminal activities, and low confidence in banks or increased uncertainty that bolster the role of cash as a safe (haven) asset.
To analyse the relative importance of these factors, we estimated a panel money demand model for the period from 2001 to 2014. We focus on domestic demand factors and therefore disregard all currencies which are internationally demanded. Estimated income and interest rate elasticities – the two standard determinants in money demand functions – are within plausible ranges. But we also include year fixed effects, which measure any average change (across economies) that cannot be explained by these conventional economic forces. These year fixed effects are close to zero before 2007, but positive and increasing thereafter. Low interest rates after 2007/08 can thus account for some part of the increase in cash demand; however, there seems to be a shift in cash demand after 2007 that remains unexplained.
What can explain the level shift in currency demand after 2007?
Accounting for criminal activities (e.g. drug trafficking) in the panel models is almost impossible due to missing data. Taking into account shadow economic activities is difficult, but at least proxy variables exist. Goodhart and Ashworth (2017) conduct individual country regressions for the US and the UK and report a positive effect of (proxy variables for) shadow economic activities. We employ an estimate of shadow economic activities from Schneider (e.g. Schneider 2015) which is available for all economies in our sample and which does not employ currency circulation as an input for its calculation. Our results suggest that changes in shadow economic activity between 2001 and 2014 had no effect, on average across economies, on changes in currency circulation.4 Clearly, it would be preferable to have alternative measures of shadow economic activities to reach more conclusive results.
The Global Crisis is another potential driver, lowering trust in banks or increasing uncertainty. As measures for trust are not available for a broad range of economies, we instead split the sample into groups of economies. We find that, on average, in economies without a systemic banking crisis in the recent past (Laeven and Valencia 2012), demand for cash did not increase. This result contrasts with an increase in currency demand in economies that experienced a systemic banking crisis in 2007/08.5 While these findings seem to make sense, the phenomenon is more complex. In fact, an unexplained increase in the currency-to-GDP ratio is also found in economies without a systemic banking crisis in 2008, but which had experienced such a crisis before – which applies mainly to higher GDP economies.
Keeping in mind that these findings are only indicative as unobserved variables might be correlated with this grouping, we conjecture that reports of banking problems in some countries might have affected sentiment everywhere. This could have led to a situation in which bank deposits and cash were no longer seen as perfect substitutes (which does not necessarily entail a sudden or strong shift in deposit to currency ratios as would be typical for banking crises). Or, in the words of Friedman and Schwartz (1963: 673): “The more uncertain the future, the greater the value of [the] flexibility [of cash] and hence the greater the demand for money is likely to be”.
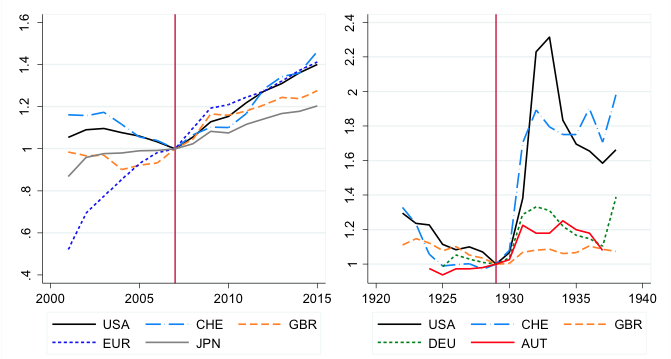
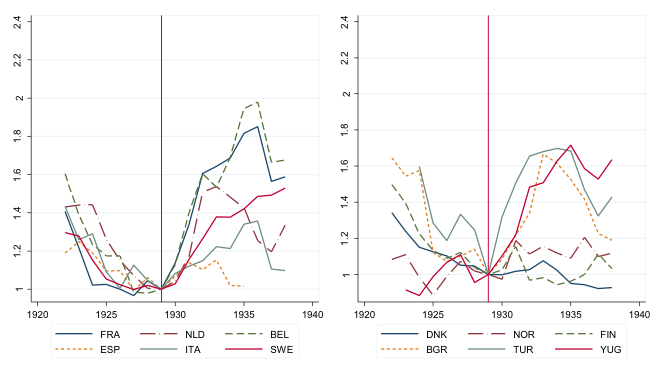
In order to explain the observed pattern in cash demand, however, the argument requires a rather persistent increase in uncertainty going well beyond the short-term shock in 2007/08, for which evidence is also difficult to come by. News-based indices (Baker et al. 2016) indicate that economic policy uncertainty increased substantially in 2008 and remained at elevated levels, at least in Europe. In this respect, it is interesting to look back in history once more. Figure 4 shows the evolution of currency in circulation over nominal GDP for a range of countries during the 1920s and 1930s, a period characterised by banking crises and significant economic uncertainty.[vi] To be sure, in some of the most affected countries like the US, the currency ratio increased in the 1930s much more than after 2008. What is striking, however, is the persistence of the increases well after the banking crises had been overcome or deposit insurance was instituted, as in the US in 1933.
Figure 4 Increase in currency circulation around financial crises, 2008 versus 1930s
Note: The figure shows the temporal evolution of the CiC over nom. GDP ratio for the Great Recession (upper left panel) and the Great Depression (remaining panels). The ratios are indexed to one in 2007 and 1927. For sources, see Jobst and Stix (2017).
We need a better understanding of non-transaction cash demand
Cash use for transactions most likely will decline. But cash balances for transactions comprise only a modest share of overall cash demand (a rough estimate of 15% might be a good guess across richer economies). Instead, changes in currency in circulation are dominated by motives like hoarding. While transaction demand is reasonably well researched – for example, through the use of payment diary surveys (e.g. Bagnall et al. 2016) – still too little is known about non-transaction demand in general, and recent increases in particular. Overall, there is a need for better data and more research to improve our understanding of people’s use of cash.
References
Assenmacher, K, F Seitz and J Tenhofen (2017), “The use of large denomination banknotes in Switzerland”, International Cash Conference 2017 – War on Cash: Is there a Future for Cash? 25 - 27 April 2017, Island of Mainau, Germany.
Baker, S R, N Bloom and S J Davis (2016), “Measuring economic policy uncertainty”.
Bagnall, J, D Bounie, A Kosse, K P Huynh, T Schmidt, S Schuh, and H Stix (2016), “Consumer cash usage and management: A cross-country comparison with diary survey data”, International Journal of Central Banking 12(4): 1–61.
Bartzsch, N, G Rösl and F Seitz (2013), “Currency movements within and outside a currency union: The case of Germany and the euro area”, The Quarterly Review of Economics and Finance 53: 393–401.
Goodhart, C A E and J Ashworth (2014), “Trying to glimpse the ‘grey economy’”, VoxEU.org, 8 October.
Goodhart, C A E and J Ashworth (2015), “Measuring public panic in the Great Financial Crisis”, VoxEU.org, 28 April.
Goodhart, C A E and J Ashworth (2017), “The surprising recovery of currency usage”, Paper presented at the 3rd International Cash Conference, Deutsche Bundesbank, April 2017.
Jobst C and H Stix (2017), “Doomed to disappear? The surprising return of cash across time and across countries”, CEPR, Discussion Paper No 12327.
Judson, R (2017), “The death of cash? Not so fast: Demand for US currency at home and abroad, 1990-2016”, International Cash Conference 2017 – War on Cash: Is there a Future for Cash? 25 - 27 April 2017, Island of Mainau, Germany.
Laeven, L and F Valencia (2012), “Systemic banking crises database: An update”, IMF, Working Papers No 12/163.
Schneider, F (2015), “Size and development of the shadow economy of 31 European and 5 other OECD countries from 2003 to 2015: Different developments”.
Skingsley, C (2017), “How the Riksbank encourages innovation in the retail payments market”, Speech at World Economic Forum Davos.
Endnotes
[1] One exception is dollarised economies. These are special, however, as the circulation of foreign-denominated currency cannot be observed. The domestic component of cash circulation increased strongly up to 2008 and then stayed roughly constant.
[2] Generating long time series involves several compromises and judgments. The most important concerns nominal GDP as a scale variable, which suffers from significant uncertainty the further we are going back in time. Second, all series in Figure 3 include gold and silver coins. Until about the mid-1920s, countries differed considerably with respect to the circulation of gold coins, which in some countries substituted for lower to medium denomination banknotes in payments and/or served as a store of wealth. The inclusion of specie money makes a substantial difference in Germany and to a lesser extent in the UK and Austria-Hungary.
[3] There are some other economies which did not experience this halt/reversal (e.g. France, Norway, Sweden).
[4] Intuitively, this is clear as the shadow economy measure follows a declining trend while cash demand has increased. The result does of course not rule out that shadow economic activities have played a role in some economies, as suggested by Ashworth and Goodhart (2014, 2017).
[5] This finding is based on only a rough descriptive account as our sample comprises only four economies with a systemic banking crisis in 2007/08 but not before (the reason being that all Eurozone economies and the US are excluded from the sample as the euro and the US dollar are international currencies). In three of these four economies cash demand increased after 2007.
[6] See also Goodhart and Ashworth (2017), who discuss the evolution of deposit-to-currency ratios around 2007 and in the 1930s. Also, a tabulation of ratios from 1930 to 1936 is presented for a broad list of economies.

