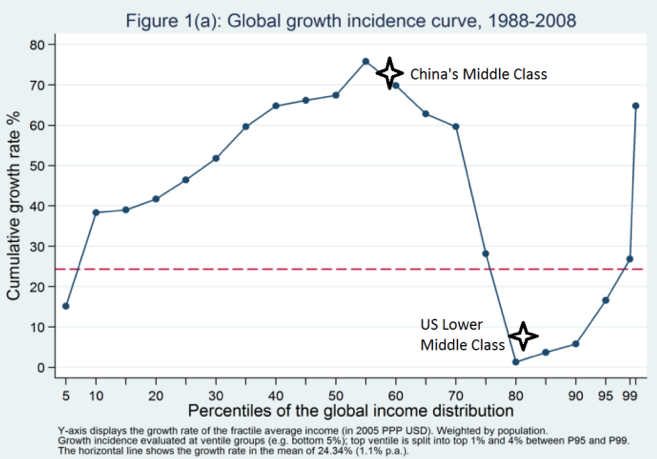
Do trade shocks cause inequality? Figure 1 (originally from Lakner and Milanovic 2013) was Paul Krugman’s ‘chart of the year’ for 2014. It shows that the percentiles of the world’s income distribution coinciding with the lower-middle class in the US and other developed countries saw their incomes grow slowly from 1988 to 2008. Over the same period, the upper-middle classes in China and India experienced rapid income growth as millions of people were lifted out of poverty. The obvious question to ask is whether globalisation was a significant cause of the slow growth in lower-middle class incomes in the US and other developed economies.
Figure 1. Global growth incidence curve, 1988-2008
This is an especially pertinent question given that recent research – including Autor et al (2013), Pierce and Schott (2015), and Ebenstein et al. (2012) – indicates that the rise of China had a large impact on American manufacturing in the early 2000s. Campbell (2016) finds that the dollar’s sharp appreciation in the late 1990s and early 2000s also contributed to manufacturing’s surprisingly sudden collapse. Autor et al. (2014), in what is a seminal paper in the trade and inequality literature, find that higher-wage workers exposed to Chinese competition were easily able to move employers and to limit earnings declines, but that lower-wage workers were not.
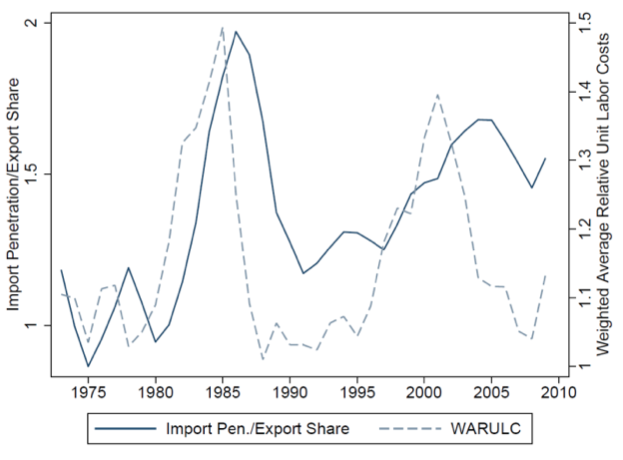
However, it is also the case that inequality in the US increased more in the 1980s and early 1990s – before trade with China was large enough to have had a major impact on the income distribution – than it has since. Thus, to try to understand how much trade shocks have increased inequality, in a recent paper we use three distinct and complementary methods (Campbell and Lusher 2016). First, we recognise that the volatile history of US relative prices can help with the problem of identification. Figure 2 below shows that in periods when the dollar appreciates, imports surge relative to exports. It’s also the case that not all sectors are equally affected. Some sectors, such as concrete manufacturing, are inherently less exposed to international trade than furniture. Thus, our methodology will be to compare workers in sectors which are more versus less exposed to trade in periods of trade shocks versus other periods.
Figure 2. Real exchange rate movements versus trade
Notes: WARULC = Weighted Average Relative Unit Labour Costs, a measure of the Real Exchange Rate, produced by Campbell (2016). Import Pen. = Import Penetration, equal to imports/domestic demand. Export Share = exports divided by total domestic production.
We find that workers in sectors more exposed to trade are more likely to be unemployed or out of the labour force, and less likely to be employed a year later during periods when the dollar is overvalued. We also find that less-educated workers do relatively worse, and additionally experience declines in wages conditional on being employed. Yet, we also find that higher wage workers tend to have larger declines in wages. How can this be? It turns out that, in our sample which comes from the BLS’s Merged-Outgoing Rotation Group (MORG) sample, poorly educated manufacturing workers who happened to have high-wage jobs are hurt very badly.
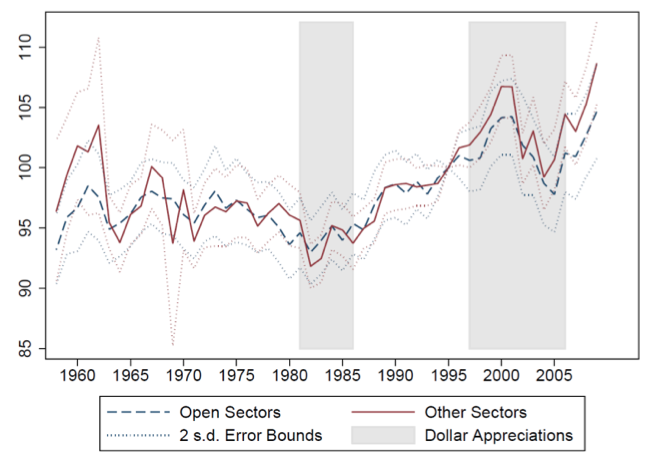
Second, using the same methodology, we look at what happens to within-sector inequality during trade shock periods using data from the Annual Survey of Manufactures. We find no evidence that initially more open sectors experienced any relative increases in inequality during periods of trade shocks (Figure 3). China-competing sectors, as well, did not experience larger increases in inequality than other sectors after trade with China began to increase in the 1990s and 2000s. Offshoring, the rise of robots, and skill-biased technological change may be huge drivers of inequality in the minds of many economic theorists, but none of these factors appears to be very well correlated with changes in measured inequality at the sector level.
Figure 3. The evolution of inequality by degrees of sectoral openness to trade
Notes: The graph shows the evolution of inequality, proxied by the ratio of non-production worker wages to production worker wages in the manufacturing sector, in the ‘Open sectors’ those which trade the most versus sectors that trade less.
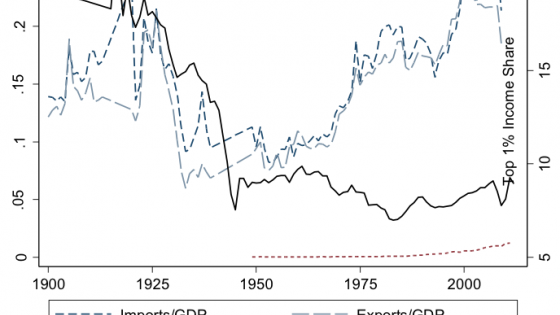
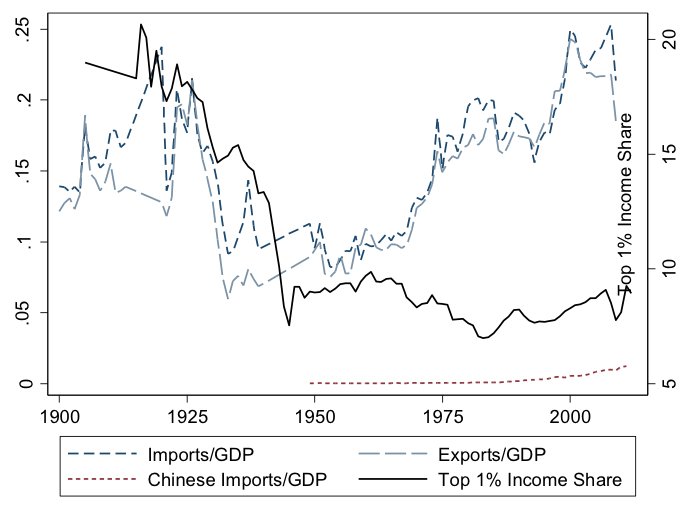
Third, we look internationally, and ask what happens to countries’ overall distribution of income as they begin to trade more with poor, developing countries such as China.1 The biggest movement in the US income distribution since 1980 has happened at the very top, but there is little reason to believe this was caused by offshoring. Others – including Roine et al. (2009) and Piketty et al. (2014) – have argued that this increase in inequality in some Anglo countries after 1980 was a product of the Reagan-Thatcher revolution, which dramatically lowered marginal tax rates on top incomes. However, it has also recently become clear that many findings in the social sciences are spurious, and that there is a real need to test the robustness of important findings.2 Do the results in Piketty et al. (2014) hold out of sample? We went out and collected new data on historical top marginal tax rates and checked, and also used more recent data for a much larger sample of countries. We confirm Piketty et al.’s results, with a slight twist – the level of top marginal rates determines changes in top income shares, indicating that the current distribution of income is a product of historical top marginal rates. Perhaps it shouldn’t be too surprising that history matters for the income distribution as well as trade patterns and manufacturing employment – hysteresis is everywhere economists choose to look for it.
Figure 4. Trade versus the top 1% share of income, France
Notes: Imports and Exports/GDP are ex-oil. French trade increased quickly after Bretton Woods, but in France, inequality actually declined slightly. More recently, inequality has increased slightly following cuts in the top marginal tax rate. Trade with China is not generally correlated with changes in the income distribution.
Thus, the answer seems to be that trade shocks, which certainly had a large impact on the labour market in the early 2000s, are not responsible for all of society’s ills. The dramatic rise in inequality experienced in the US since 1980 can be traced to the Reagan tax cuts, not to trade.
References
Acemoglu, D, D Autor, D Dorn, G H Hanson and B Price (2016) “Import competition and the great US employment sag of the 2000s”, Journal of Labor Economics, 34(S1 Part 2): S141-S198.
Autor, D, D Dorn and G H Hanson (2013) "The China syndrome: Local labor market effects of import competition in the United States", The American Economic Review, 103.6: 2121-2168.
Autor, D, D Dorn, G H Hanson and J Song (2014) "Trade adjustment: Worker-level evidence", The Quarterly Journal of Economics, 129.4: 1799-1860.
Campbell, D L (2013) "Estimating the impact of currency unions on trade: Solving the glick and rose puzzle", The World Economy, 36.10: 1278-1293.
Campbell, D L (2016) "Relative prices, hysteresis, and the decline of American manufacturing", Working Papers w0212, Center for Economic and Financial Research (CEFIR).
Campbell, D L and L Lusher (2016) "Trade shocks, taxes, and inequality", Working Papers w0220, Center for Economic and Financial Research (CEFIR).
Ebenstein, A, M McMillan, Y Zhao and C Zhang (2012) “Understanding the role of China in the ‘Decline’ of US Manufacturing”.
Glick, R and A Rose (2002), “Does a Currency Union Affect Trade? The Time Series Evidence”, European Economic Review 46(6): 1125-1151.
Pierce, J R and P K Schott (2015) “The surprisingly swift decline of US manufacturing employment”, American Economic Review, forthcoming.
Lakner, C and B Milanovic (2013) "Global income distribution: From the fall of the Berlin Wall to the Great Recession", World Bank, Policy Research Working Paper 6719.
Piketty, T, E Saez and S Stantcheva (2014) "Optimal taxation of top labor incomes: A tale of three elasticities", American Economic Journal: Economic Policy 6(1): 230-271.
Roine, J, J Vlachos and D Waldenström (2009) "The long-run determinants of inequality: What can we learn from top income data?" Journal of Public Economics 93(7): 974-988.
Endnotes
[1] Here we use the World Wealth and Incomes database.
[2] For instance, see http://andrewgelman.com/2015/12/19/a-replication-in-economics-does-genet.... Separately, Campbell (2013) shows that the seminal Glick and Rose (2002) finding on the apparent impact of currency unions on trade does not survive the inclusion of time trends.
