With aftershocks of the recent global financial earthquake still being felt in some parts of the world, it would be useful to have a set of “early warning indicators” to tell us what countries are most vulnerable. Many scholarly papers in the past have been devoted to identifying leading indicators of crises (e.g. Rose and Spiegel 2009a).
The bar for finding good indicators has sometimes been set too high. Nobody should be surprised that it is not easy to forecast crises with high reliability; the efficient markets hypothesis – under assault as it is – still warns us not to expect easy, low-risk opportunities for profits. Thus it is especially hard to predict the timing of the crisis.
But to say that such indicators are not 100% accurate is not to say they are entirely useless, as some economists do. A common assessment is that such indicators have failed in the sense that in each historical round of emerging-market crises seems to turn on a different set of factors. One can find particular variables that appear statistically significant for each round crises – those of 1982, 1994-2001, and 2008 – but the same variables do not perform well in the subsequent round. This is not the right conclusion to draw.
The early literature
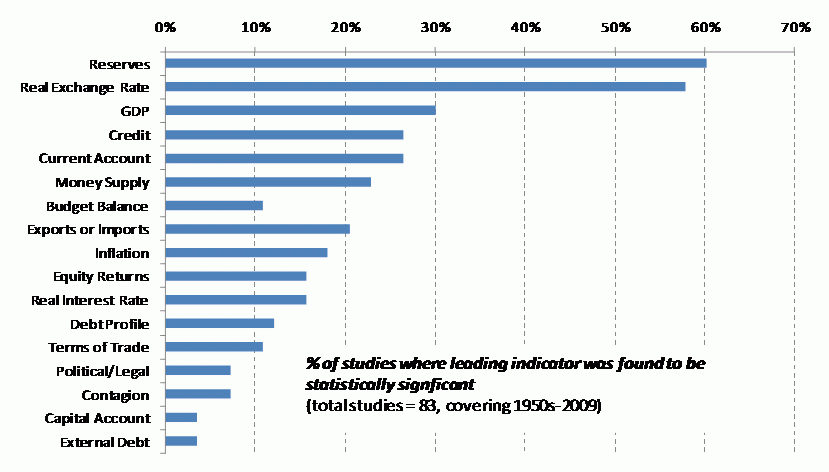
In a recent paper (Frankel and Saravelos 2010) we began by examining more than 80 contributions to the pre-2008 literature on crisis indicators. Figure 1 reports which variables were most often found to have performed consistently well in predicting crises in the past. Among 17 categories of indicators, two stand out as by far the two most useful leading indicators:
- level of international reserves, and
- movements in the real exchange rate in the run up to the crisis.
Figure 1. Percentage of studies where leading indicator was found to be statistically significant
The consistency of these results is impressive. They hold across different crisis episodes stretching from the 1950s to the early 2000s, even though different authors have defined “crisis” and “useful” in different ways. Credit growth and other indicators have also been useful in many studies. The current-account balance has been frequently tested, sometimes with success but sometimes not.
The 2008-09 global crisis
The recent global crisis was a near-perfect experiment for testing the performance of such indicators because it started with a shock that was exogenous as far as many countries of the world are concerned, namely a liquidity crisis in US financial markets. This hit everyone at the same time, so we don’t have to worry about the issue of timing. We can focus on what economic variables indicate vulnerability to such a shock.
We find that the crisis indicators from the pre-2008 literature do relatively well in predicting which countries got hit in 2008-09. Moreover, foreign exchange reserve holdings – the indicator that was found to be the top performer in past crises -- was also the top performer this time, especially when expressed as a ratio, for example, with respect to debt. Other indicators did not have such strong results.
The first wave of analysis of the global crisis -- by top economists including Blanchard, Obstfeld, and Rose – found that few, if any, indicators were useful in explaining which countries got hit the most (see Berkmen et al. 2009.Blanchard et al. 2009, Obstfeld et al. 2009, Rose and Spiegel 2009 a and b).
Why do we get stronger results? Including data for 2009 matters
These papers necessarily defined the crisis period as the year 2008. They lacked data on 2009 at the time when they were written. We define the global crisis as beginning in earnest in the latter part of 2008 – recall that the failure of Lehman Brothers came in September.
We extend the period under consideration through early 2009, because many aspects of global financial markets and the real economy did not begin to recover until the second quarter of that year.1 We surmise that the difference in the period that is defined to be the crisis is the reason for the difference in results. Sure enough, we have now tried re-running our tests with the calendar year 2008 taken to be the crisis period as in Rose and Spiegel (2009a) and many of our indicators such as reserves lose their significance. This confirms that the period of observation is what makes the difference.
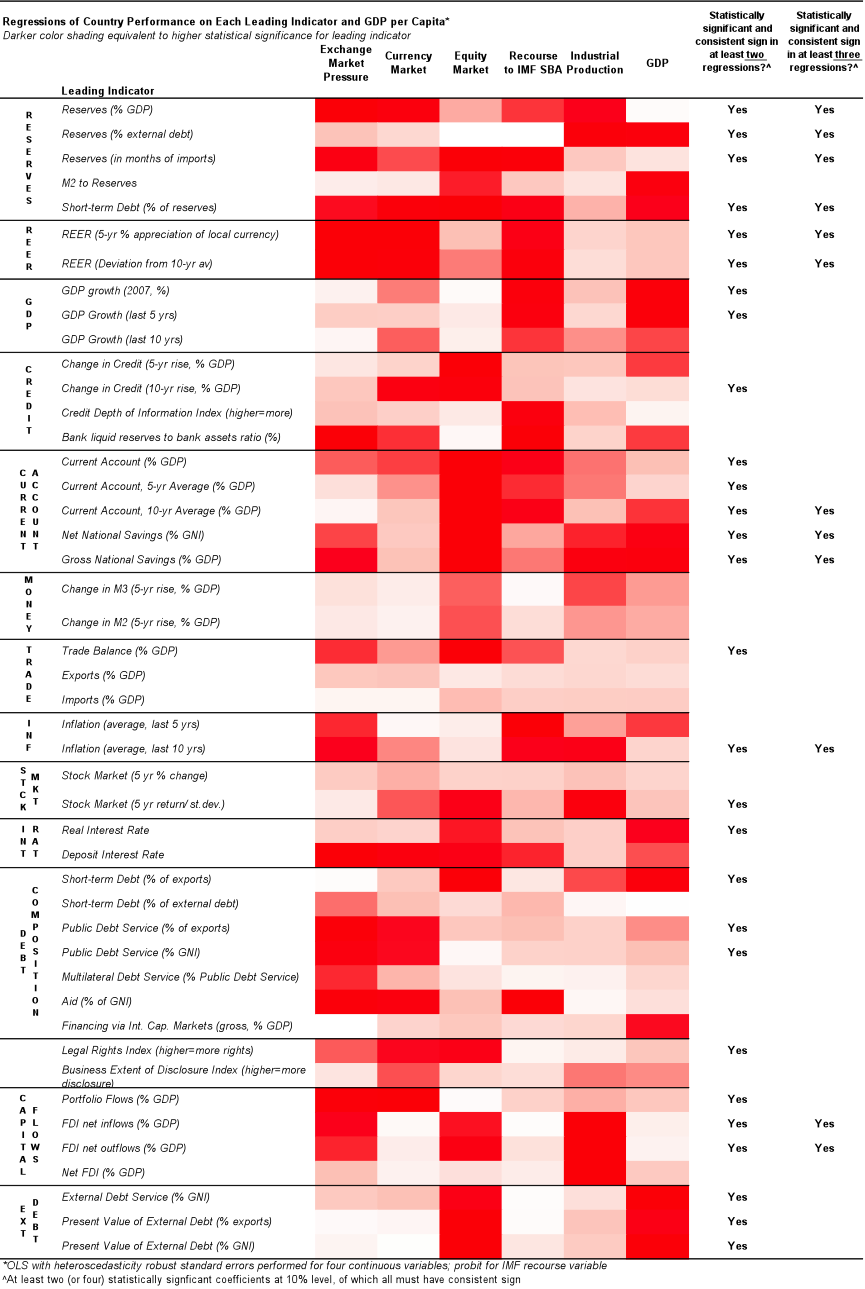
Table 2 summarises our results. Each column represents another criterion for gauging the severity of the 2008-09 Crisis in a particular country. We consider a country to have suffered more from the crisis if it experienced larger output drops, bigger stock market falls, loss in demand for its currency,2 or a need for access to IMF funds. We regressed each of these dependent variables against the list of useful early warning indicators indentified in our literature review. A darker colour in the figure indicates greater statistical significance for that indicator.
We controlled for GDP per capita, allowing us to mix high-income and low-income countries in the same data set. The last three years have featured a historic role reversal in which some “advanced countries” were badly hit (Iceland, Greece, and others on the periphery of Europe) while some big emerging markets did much better (China, Brazil, Indonesia and others).
Table 2. Regression Heatmap
What works?
At the top of the list is the level of central bank reserves.
- Similar to the findings of the earlier literature review, we find that the level of reserves in 2007 was a statistically significant predictor of crisis incidence in 2008-09, i.e. nations with high levels of reserves did well in this crisis.
Four out of five of the reserve measures used have statistically significant coefficients at the 5% level or better, across half or more of the crisis intensity measures considered.
- The best-performing of the reserve measures expresses them relative to short-term debt.
This is consistent with earlier findings, including the Guidotti Rule that tells emerging market central banks to hold reserves equal to at least the amount of debt maturing within one year. (Guidoti 2003 and see Aizenman 2009). Our findings are robust to alternative definitions of crisis incidence.
Next on our literature review list is past movements in the real effective exchange rate. These are not helpful when crisis incidence is measured in terms of real output losses or stock market performance, but are statistically significant in predicting currency weakness against the dollar, exchange market pressure and access to IMF stand-by arrangement programs.
A few of the other leading indicators stand out as well.
- A higher current account balance or level of national savings is associated with lower crisis intensity.
Other variables with some explanatory power but less consistently useful across different measures include the level of external debt, its composition (e.g. short-term vs. long-term), and the extent of foreign direct investment.
Conclusion
We conclude that early warning exercises can indeed be a useful tool for assessing future vulnerabilities. The same variable that topped the list of indicators in the earlier literature, central bank reserves, also worked the best in predicting who got hit in the 2008-09 crisis. Other useful early warning indicators include real effective exchange rate overvaluation, current accounts, and national savings. Many Eastern European countries were hurt by these factors in the crisis, while many Asian countries did much better.
References
Aizenman, Joshua (2009), “On the Paradox of Prudential Regulations in the Globalized Economy: International Reserves and the Crisis – A Reassessment,” NBER Working Paper 14779, March.
Berkmen, Pelin, Gaston Gelos, Robert Rennhack, and James P Walsh (2009), "The Global Financial Crisis: Explaining Cross-Country Differences in the Output Impact", IMF Working Paper 09/280.
Blanchard, Olivier, Hamid Faruqee, and Vladimir Klyuev (2009), "Did Foreign Reserves Help Weather the Crisis", IMF Survey Magazine, October.
Frankel, Jeffrey and George Saravelos (2010), “Are Leading Indicators of Financial Crises Useful for Assessing Country Vulnerability? Evidence from the 2008-09 Global Crisis,” NBER Working Paper 16047, June.
Guidotti, Pablo (2003), in J Antonio Gonzalez, V.Corbo, A.Krueger, and A.Tornell, (eds.), Latin American Macroeconomic Reforms: The Second Stage, University of Chicago Press.
Obstfeld, Maurice, Jay Shambaugh, and Alan Taylor (2009), “Financial Instability, Reserves, and Central Bank Swap Lines in the Panic of 2008,” American Economic Review, 99(2):480-486.
Obstfeld, Maurice, Jay Shambaugh, and Alan Taylor (2010), “Financial Stability, the Trilemma, and International Reserves”, American Economic Journal: Macroeconomics.
Rose, Andrew and Mark Spiegel (2009a), “The Causes and Consequences of the 2008 Crisis: Early Warning,” Global Journal of Economics, forthcoming. NBER Working Paper 15357.
Rose, Andrew, and Mark Spiegel (2009b), “The Causes and Consequences of the 2008 Crisis: International Linkages and American Exposure,” Pacific Economic Review, forthcoming.
Yacine, Aït-Sahalia, Jochen Andritzky, Andreas Jobst, Sylwia Nowak, and Natalia Tamirisia (2010), “Market Response to Policy Initiatives During the Global Financial Crisis,” NBER Working Paper 15809, March.
1 The same dating of the global crisis is adopted by Yacine et al. 2010.
2 Our first measure of currency demand was depreciation, as in the 1990s literature on currency crashes. But many more emerging market countries float today than in the past, and often with success. Poland appears to have been hit much worse than Estonia if one looks at currency depreciation, because the zloty floated while the kroon was locked in to the euro. But by any other measure, Poland did much better than Estonia; it was the only EU country that did not lose output. So we try replacing currency depreciation with exchange market pressure, which combines depreciation with loss of reserves, to get a better overall measure of loss in demand for a country’s currency.


