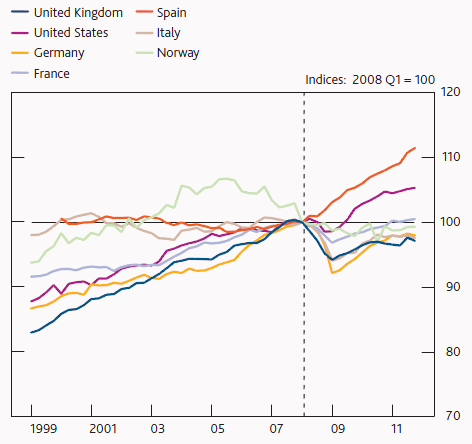
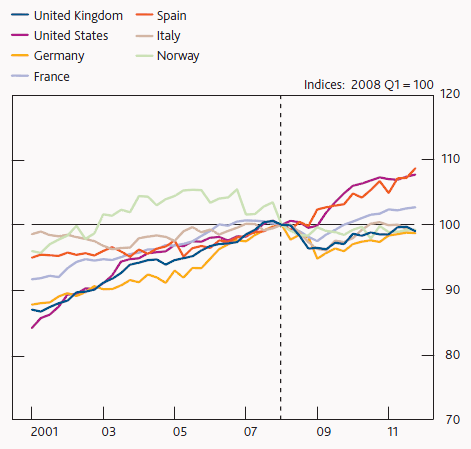
Productivity in the UK and a number of other countries has been recovering only slowly since the start of the financial crisis (Figure 1 and Figure 2). While productivity often falls in the initial stages a recession, persistently weak productivity four years into a crisis is more unusual to see. The real worry is that the crisis has damaged the supply potential of the economy, implying bleaker prospects for growth and less downward pressure on inflation.
Figure 1. Labour productivity across countries (output per person)
Sources: Eurostat, Office for National Statistics, Thompson Datastream, and Bank of England calculations.
Note: Dotted line shows 2008 Q1.
Figure 2. Labour productivity across countries (output per hour worked)
Sources: Eurostat, Office for National Statistics, Thompson Datastream, and Bank of England calculations.
Note: Dotted line shows 2008 Q1.
Interpreting the weakness in productivity
The fall in actual productivity could partly reflect a fall in underlying productivity - the level of productivity that could be achieved if companies fully utilised their existing levels of capital and labour.
But weak productivity could also be a consequence of companies retaining labour during the downturn. If that labour is currently underutilised it would imply that, even after four years, companies are operating with a margin of spare capacity (Martin and Rowthorn 2012).
These two hypotheses have very different implications for future growth and inflation . Under the first, a significant deterioration in the supply potential of the economy, there would be less spare capacity so that increases in demand ceteris paribus would be more likely to put upward pressure on inflation sooner. Under the second interpretation, a recovery in demand could initially be absorbed by the margin of slack in companies, and so would be less likely to put immediate upward pressure on inflation.
Can historical evidence help policymakers understand the weakness in productivity?
We know that recessions that are accompanied by financial crises are different to normal recessions: the fall in output is larger and more prolonged (IMF 2009 and Reinhart and Rogoff 2009).
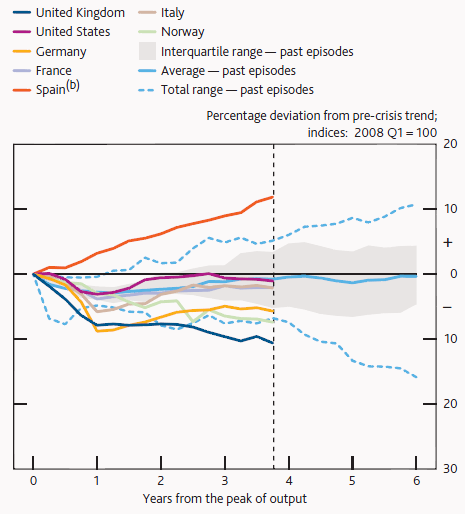
Figure 3. Productivity in the recent crisis compared to previous episodes of financial crisis
Source: Eurostat, OECD, Office for National Statistics, Thomson Datastream and Bank calculations.
Notes: The vertical dashed line shows the latest data point for the recent crisis, 2011q4. Pre-crisis trends are computed using the IMF (2009a) method. The trend is given by the average growth rate over a seven year period that ends three years prior to the start of the crisis; the past three years are excluded to ensure the pre-crisis trend is not boosted by any elevated growth that often precedes a recession. (b) For Spain, the pre-crisis trend is computed 2000q1 - 2004q4 due to lack of historical data.
Figure 3 puts the recent financial crisis into historical context by comparing labour productivity following the most recent crisis with a grey swathe of historical episodes in advanced economies. It shows that, in the past, productivity has typically recovered back to its pre-crisis trend after about four years. Our recent work suggests that this usually happened because the falls in output were eventually accompanied by falls in employment, rather than because output recovered (Hughes and Saleheen 2012).
This time has been different. Many European countries have seen persistently weak productivity, often weaker than has typically been seen in previous crises. The UK stands out as having the weakest performance in our sample, with the current level of labour productivity being 10% below a simple pre-crisis trend. In our sample only Spain has been different with a large rise in unemployment being accompanied by an acceleration in productivity.
A different approach – considering productivity across countries and sectors
Table 1 shows that, before the crisis, the UK’s average productivity growth rate was one of the highest in our sample, averaging at 2.4% per year and in line with Sweden and the US. But, since the recovery started, productivity in the UK has grown at a mere 0.5% per year, well below its pre-crisis average rate making it one of the weakest performers. In contrast, the US and France have returned to their pre-crisis growth rates and Germany has grown faster, making some progress in catching-up towards its pre-crisis path.
Table 1. Average annual productivity growth before and after the crisis
| Pre-crisis (1998 Q1-2004 Q4) |
| |
UK |
US(c) |
Germany |
France |
Italy |
Spain(d) |
Sweden(e) |
Norway |
Denmark |
| Total |
2.4 |
2.2 |
1.0 |
1.0 |
0.1 |
-0.1 |
2.3 |
1.6 |
1.4 |
| Manufacturing |
4.3 |
7.1 |
2.7 |
3.2 |
0.1 |
1.9 |
|
3.5 |
2.5 |
| Services |
2.3 |
1.7 |
0.1 |
0.4 |
-0.2 |
-0.8 |
|
1.3 |
1.0 |
| Business Services (a) |
2.6 |
2.1 |
-1.8 |
-0.8 |
-2.2 |
-4.0 |
|
1.9 |
-0.7 |
| Consumer Services (b) |
0.8 |
1.8 |
2.4 |
1.5 |
0.6 |
2.7 |
|
2.5 |
4.4 |
| Recovery (2009 Q3-2001 Q4) |
| |
UK |
US(c) |
Germany |
France |
Italy |
Spain(d) |
Sweden(e) |
Norway |
Denmark |
| Total |
0.5 |
2.2 |
1.3 |
1.0 |
0.8 |
2.9 |
2.4 |
0.0 |
1.8 |
| Manufacturing |
2.9 |
8.5 |
4.9 |
4.2 |
3.2 |
5.8 |
|
3.2 |
5.7 |
| Services |
0.4 |
1.2 |
0.5 |
0.8 |
0.2 |
2.0 |
|
0.8 |
1.9 |
| Business Services (a) |
0.2 |
2.6 |
-1.4 |
0.2 |
-0.2
|
2.5 |
|
1.1 |
2.4 |
| Consumer Services (b) |
0.8
|
1.8 |
2.4 |
1.5 |
0.6 |
2.7 |
|
2.5 |
4.4 |
Source: Bureau for Economic Analysis, Eurostat, Office for National Statistics and Bank calculations.
Notes: (a) Business services include financial intermediation, real estate, renting and other business activity. (b) Consumer services include wholesale & retail, hotels & restaurants and transport. (c) US data are only available at an annual frequency and on a consistent sectoral basis from1998. The top and bottom panel show average growth over the period 1999-2004 and 2009-2010 respectively, as the latest data are for 2010. (d) For Spain the average is computed over the period 2001q1-2004q4 due to lack of data. (e) Eurostat does not report sectoral data for Sweden.
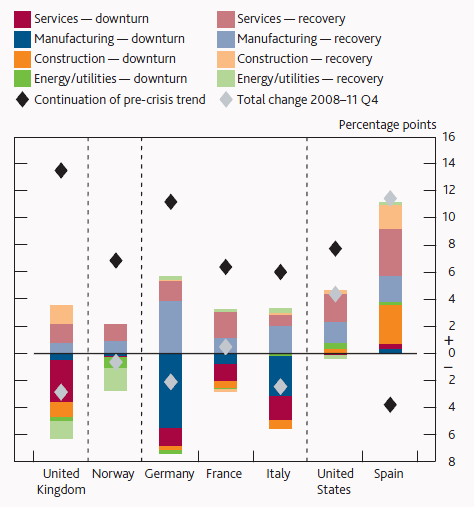
Figure 4. Change in the level of productivity across countries by sector
Source: Bureau for Economic Analysis, Bureau for Labor Statistics, Eurostat, ONS and Bank calculations.
Notes: The bars below the zero line show the extent to which total labour productivity fell during the recession, split into the contribution of manufacturing, services, construction and extraction. The bars above the zero line show the recovery in productivity by sector. The black diamonds show where the economy would be if productivity had continued along the pre-crisis trend.
It shows that the falls in productivity in Germany, France and Italy in the recession were concentrated in manufacturing. Over the recovery, manufacturing productivity has grown faster in these countries than in the UK, which explains why they have started to reclaim some of their lost ground.
In contrast to other countries, much of the sustained weakness in UK productivity is concentrated in services, where the level is still below its pre-crisis peak. This is particularly disappointing given that prior to the crisis, productivity in the UK service sector averaged 2.3% per year, the highest in our sample. At 0.4% per year since the crisis, it is now one of the lowest.
On top of that the UK and Norway have both seen a fall in energy and utilities productivity over both the recession and recovery period, because production from the North Sea has fallen as the oil fields have aged. These changes are likely to be structural in nature and suggest a fall in underlying productivity.
The contrast between labour productivity in the UK and US is of particular interest given that these two countries have a very similar industrial structure, but companies in the two countries have reacted differently in the extent to which they have shed and held on to labour. In the US productivity has continued to grow since the crisis started as there has been a larger labour market shake out there. This suggests there is little spare capacity within US companies, but there may nonetheless not be immediate upward pressure on inflation as demand recovers, if companies are able to tap into the spare capacity available in the labour market.
Summing up
Since the crisis, productivity growth in many countries has been persistently weak, with growth in the UK among the slowest in our sample. Understanding why productivity has deteriorated and whether it reflects a fall in the supply potential of the economy is important for assessing the growth and inflation outlook.
We find that persistently weak productivity is not normally a feature of financial crises in advanced economies – this time has been different. Looking sector by sector, the biggest falls in most countries have been in manufacturing. The UK stands out in having also seen a dramatic fall in service sector productivity growth, now one of the slowest in our sample of countries.
References
Bank of England (2011a), “Minutes of the Monetary Policy Committee Meeting, May 2011”.
Bank of England (2011b), “Minutes of the Monetary Policy Committee Meeting, September 2011”.
Hughes, A and J Saleheen (2012), “UK labour productivity before and after the crisis – an international and historical perspective”, Bank of England Quarterly Bulletin, 52(2):138-146.
IMF (2009a), “What’s the damage? Medium term output dynamics after financial crises", October World Economic Outlook, Chapter 4, 121-151.
Martin, B and R Rowthorn (2012), ”Is the British economy supply constrained?”, Centre for Business Research, University of Cambridge.
Reinhart, C and K Rogoff (2009), This time is different: Eight centuries of financial folly, Princeton University Press.


