Trends in average incomes at different points in the income distribution have become the subject of considerable popular and policy interest. At the top end of the income distribution, the work of Anthony Atkinson, Thomas Piketty, and their collaborators has drawn attention to trends in average incomes of the top 10% and 1% of the distribution (Atkinson and Piketty 2010, Atkinson et al. 2011). At the other end of the income distribution, the World Bank has promoted the concept of ‘shared prosperity’, defined as the growth rate of average incomes of those at the bottom 40% of the income distribution (World Bank 2013).
The consequences of income mobility for trends in group incomes
While income trends in such groups are often referred to as growth rates of the ‘rich’ or the ‘poor’, an underappreciated point is that membership in these groups is far from stable over time. When there is mobility in the income distribution, over time some of the initially poor will rise out of the bottom 40%, while others will fall from the top 60% into the bottom 40%. The same is true at the top end, with some fortunate individuals ascending into the top 10% while others drop out of this group.
This has consequences for how to interpret trends in group average incomes. For example, the policy implications, and even the political acceptability, of a given change in average income in the top 1% of the income distribution depends crucially on whether this group of top earners consists of the same people over time, or instead whether some of the initially rich fall out of the top group and are replaced with those who were initially poorer. This distinction matters just as much at the lower end of the income distribution. For example, when evaluating interventions designed to benefit those starting out at the bottom 10% of the income distribution, it is of considerable policy importance to be able to track the same group of individuals over time, and particularly to be able to track the experiences of those who were able to increase their incomes sufficiently to rise out of the bottom 10%.
However, growth rates of group average incomes typically are measured on an ‘anonymous’ basis, comparing, for example, average incomes of the richest 1% at two points in time, while disregarding the fact that this comparison involves two different groups of people. The main reason for this is pragmatic – true panel datasets that follow the same respondents over time are rare, particularly in developing countries, given the formidable logistical costs of designing and maintaining such surveys. The cost of this pragmatism is that we usually cannot observe the corresponding ‘non-anonymous’ growth rate that tracks the fortunes of the same group of individuals over time.
A new method of measuring income mobility and non-anonymous income growth rates
In a recent paper, we propose an approach to fill this measurement gap (Kraay and Van der Weide 2017). We show that it is possible to build approximate measures of income mobility, together with corresponding non-anonymous growth rates, using nothing more than the readily available data used to calculate trends in average incomes and inequality (such as Gini coefficients or top income shares). This makes it possible for the first time to compare anonymous and non-anonymous growth rates for a large number of countries, instead of only for the handful of countries where true panel datasets are available.
We use data from the World Income and Wealth database, which is derived from published summaries of income tax records to measure average incomes and top income shares in a sample of mostly advanced economies, as well as the World Bank’s PovcalNet database, which reports data on average incomes and summary measures of inequality based on household surveys for a large number of mostly developing countries. Some of the cross-country patterns we observe in estimates of income mobility seem quite plausible given our priors. For example, among the high-income countries, the Scandinavian countries and much of Europe show relatively high levels of income persistence, while the US, Singapore, and Taiwan rank among the countries with low levels of income persistence.
To illustrate the consequences of mobility for growth rates of group average incomes for each country in our dataset, we take the latest available ten-year period and compute the conventionally available anonymous growth rate of average incomes for the top 10% (for countries in the World Income and Wealth database) and bottom 40% (for PovcalNet countries) of the income distribution. We then compare these to estimates of the corresponding non-anonymous growth rates obtained using our approach.
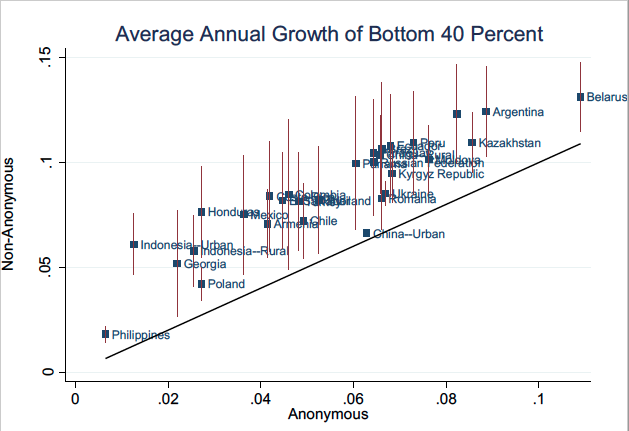
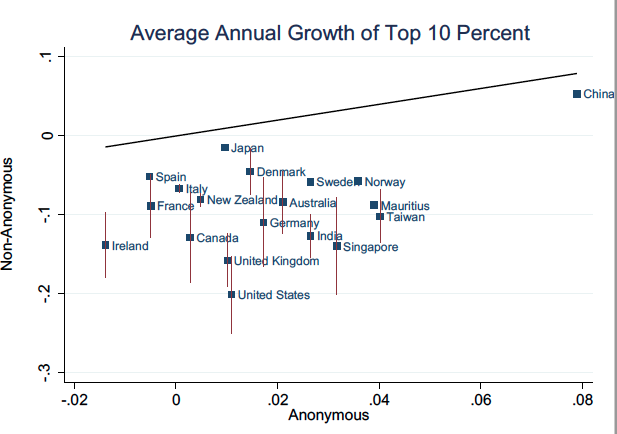
Figure 1 shows that the difference between the two types of growth rates is large. The horizontal axis reports the anonymous growth rate, and the vertical axis reports the bounds on the non-anonymous growth rate as a vertical line, with the mid-point of the range marked and labelled with the country’s name. The solid diagonal line is the 45-degree line of equality – points above the line correspond to cases where the non-anonymous growth rate exceeds the corresponding anonymous growth rate, while the opposite is true for points below the line.
Figure 1. Anonymous and non-anonymous growth rates of bottom 40% and top 10%
Notes: This figure plots average annual anonymous growth rates (on the horizontal axis) against average annual non-anonymous growth rates (on the vertical axis) of the bottom 40% (top panel) and top 10% (lower panel) over the most recent ten-year period available for each country (the terminal year for the majority of surveys ranges between 2010 and 2013). The solid diagonal line represents the 45-degree line. The vertical lines represent the range from the lower- to the upper-bound estimates of the non-anonymous growth rate, and the squares represent the midpoint of the range. Note that for some countries the estimated lower and upper bounds coincide and so only the midpoint is shown.
In the case of the bottom 40%, the non-anonymous growth rate is considerably higher than the corresponding anonymous growth rate (the World Bank’s measure of ‘shared prosperity’). The difference is economically significant, averaging about 3% per year. This gap reflects the fact that the non-anonymous growth rate captures the experience of those who started out in the bottom 40% but had faster-than-average growth and thus rose out of the bottom 40% by the end of the period over which the growth rate is calculated. Conversely, the anonymous growth rate is lower because it reflects the experience of those who started out above the 40th percentile but had slower-than-average growth and thus fell back into the bottom 40%. Putting these observations together, this means that by tracking shared prosperity anonymously, policymakers could inadvertently overlook the success of some initially poor individuals. Or more succinctly, those who start out poor on average grow faster than you might think based on commonly reported anonymous growth rates.
The exact opposite holds true when tracking growth at the top end of the income distribution. Growth of top incomes is larger when measured anonymously than when measured non-anonymously. This gap is again substantial, averaging more than 10% per year. The gap reflects the fact that the non-anonymous growth rate captures the experience of those who started out in the top 10% but had slower-than-average growth and thus dropped out of the top 10% by the end of the period over which the growth rate is calculated. As a result, commonly available anonymous growth rates of top incomes exaggerate the fortunes of the rich, often by a considerable margin. Or more succinctly, those who start out rich grow more slowly than you might think based on anonymous growth rates.
Concluding remarks
The analytical framework underlying our approach can also be applied to intergenerational mobility, providing a means of rationalising some of the empirical regularities that have been reported in recent studies. One prominent regularity is that higher levels of intergenerational mobility are more likely to be observed in countries with lower levels of income inequality (e.g. Corak 2013, Chetty et al. 2014). In an ongoing companion study, we show how growth and inequality jointly determine intergenerational mobility, and demonstrate how much growth it would take to offset a rise in inequality. This analysis also helps interpret the results of a recent study by Chetty et al. (2017) which reports a dramatic decline in absolute mobility in the US over the last 60 years.
References
Atkinson, A and T Piketty (eds) (2010), Top incomes: A global perspective, Oxford and New York: Oxford University Press.
Atkinson, A, T Piketty and E Saez (2011), “Top incomes in the long run of history”, Journal of Economic Literature 49: 3-71.
Chetty, R, N Hendren, P Kline and E Saez (2014), “Where is the land of opportunity? The geography of intergenerational mobility in the United States”, Quarterly Journal of Economics 129: 1553-1623.
Chetty, R, D Grusky, M Hell, N Hendren, R Manduca and J Narang (2017), “The fading American dream: Trends in absolute income mobility since 1940”, Science 356: 398-406.
Corak, M (2013), “Income inequality, equality of opportunity and inter-generational mobility”, Journal of Economic Perspectives 27: 79-102.
Kraay, A and R Van der Weide (2017), “Approximating income distribution dynamics using aggregate data”, World Bank Policy Research Department Working Paper No. 8123.
World Bank (2013), “The World Bank goals: End extreme poverty and promote shared prosperity”.


