Increased caloric intake, while decreasing food insecurity in some developing countries, has been linked to so-called "diseases of affluence" such as obesity, high levels of cholesterol, and diabetes, particularly in developed nations. As well as the overall level of caloric intake, the source of the calories determines nutrition, and so also directly affects population health. The United Nations (WHO 2011) identified unhealthy diet as one of the four global causes of non-communicable diseases.
An increase in caloric intake may not necessarily be associated with better nutrient intake. For instance, in poor areas in developed nations we know that children can be simultaneously obese and malnourished (Averett and Yang 2015). If we examine nutrient intake and the composition of foods consumed, we can shed light on how people substitute across food categories over time, and highlight the independent effects on health of caloric intake and nutrition. In recent research, we assembled data for 209 countries spanning 51 years to find out more about these issues (Dave et al. 2016).
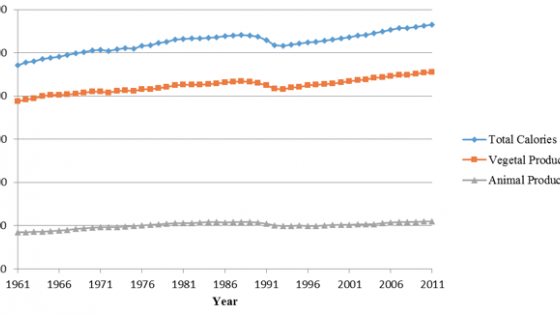
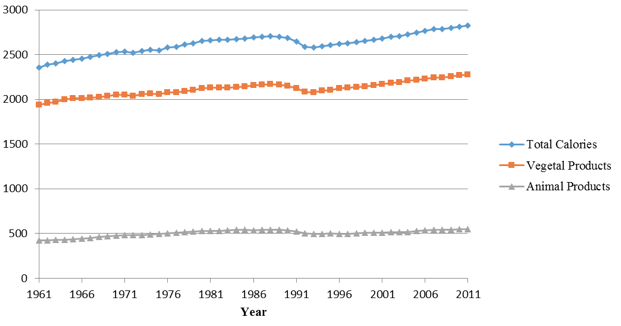
Figure 1 Average caloric intake, 1961-2011
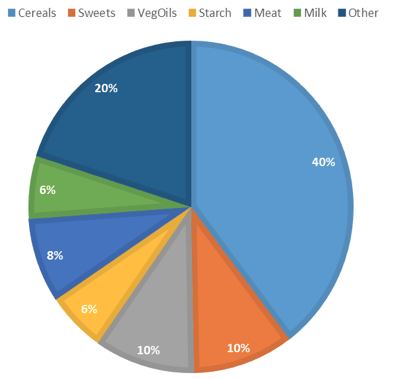
Figure 1 shows that total daily caloric intake has increased globally by about 20% over the past five decades, from 2,352 kcals in 1961 to 2,828 kcals in 2011, driven by an increase in both vegetal and animal-based food products. This overall increase masks different increases across different food groups. It is driven by an increase in the consumption of vegetable oils (a 96% increase between 1961 and 2011), meat (55%), and sugars and sweeteners (41%). Figure 2 breaks down the sources of calories consumed globally. In 2011, the largest share could be attributed to cereal (40%), followed by sugar and sweeteners (10%), vegetable oils (10%), meat (8%), milk (6%), and starch (6%). There are differences among countries too: for the US, cereal accounted for only 22% of total calories consumed while sugar accounted for almost 16%.
Figure 2 Average caloric intake by category, 2011
High-income and upper-middle-income countries have significantly higher caloric intake than low-income countries, and also a higher intake of animal-based products. The US, Western and Eastern Europe, and Central Asia also derive a greater share of their caloric intake from animal-based products. Sub-Saharan Africa consumes significantly fewer calories from animal-based products, both in terms of levels and share. The Middle East & North Africa has a significantly higher intake of vegetal-based products and a significantly lower intake of animal-based products, reflective of the Mediterranean diet (Díaz-Méndez and Gómez-Benito 2010).
There was strong growth in the consumption of eggs (71%), vegetables (67%), fish (59%), and oil crops (57%), though the relative contribution of these foods to overall caloric intake remain low; in 2011, vegetables and eggs accounted for only about 2% and 1% of total caloric intake, respectively.
Across levels of economic development, caloric intake in lower-middle-income countries grew at the highest rate (26%). Regionally, the Middle East & North Africa grew fastest (42%). Only Eastern Europe & Central Asia did not have significant growth in caloric intake (only 0.4%). Total caloric intake in this region actually dropped during 1990-92, visible in Figure 1, and likely associated with economic contraction in the transition from centrally planned to market economies for most of the economies in Eastern Europe and Central Asia. The region also experienced increased emigration. The reduced caloric consumption may also therefore reflect a shift in the composition of a country’s population, as the average caloric intake of the stayers may be very different than the average caloric intake of the migrants.
World cereal consumption increased by 8% during this period, with sub-Saharan Africa, Middle East and North Africa, and the US leading this trend with growth rates between 24 and 26% (although, as noted above, the US also has one of the lowest levels of cereal consumption). In comparison, Eastern Europe and Central Asia region consumed 28% less cereals over this period, again likely associated with economic contraction and transition. World consumption of starch and pulses has been almost flat, but there are significant variation across regions: increases in the Middle East & North Africa region, declines in Western Europe.
The 41% rise in sugar/sweetener consumption was not uniform across countries either. Growth was high in the sub-Saharan African (75%) and South/East Asia and Pacific (67%) regions, and among low-income countries (73%). Among high-income countries, sugar intake increased only 11%, but in terms of both absolute caloric intake and the share of intake from sugar and sweeteners, the US continues to lead the world (569 kcals comprising about 16% of total calories in 2011). Some of the increase in caloric intake through sweeteners has been linked to agricultural policies in the US, such as subsidies to corn farmers (Beghin and Jensen 2008; Rashad 2007). A significant portion of the increase in sugar consumption in the US can be attributed to soda and other sugar-sweetened beverages, which has prompted some cities and municipalities to propose interventions that limit the consumption of these beverages such as taxes and availability restrictions. It should be noted that sugar consumption in this context includes sweeteners such as high fructose corn syrup.
What is driving these changes?
Higher GDP per capita is associated with higher caloric intake of all food groups, with the exception of cereals and starch. Thus, trends which have led to an increase in overall obesity have also led to changes in how we eat. Labour force participation and healthcare measures in a nation also partly explain the increase in caloric intake.
These trends have important implications for population health. Based on panel data models, both total caloric intake and disaggregated caloric intake (animal versus vegetal-based) are positively associated with glucose and cholesterol, potentially conflating a direct effect (on the health markers) and an indirect effect (through body mass index, BMI, and obesity). Interestingly, when we control for BMI, caloric intake does not appear to have an effect on glucose (with the exception of animal-based products for females), but has a significant effect on cholesterol. Animal-based products are significantly associated with higher cholesterol while vegetable-based products are significantly associated with lower cholesterol, which underlies the trends in cholesterol and glucose over this time period and across countries (Doytch et al. 2016).
Individuals maximise health subject to a health production function, an idea originally put forth by Michael Grossman in his seminal work on the demand for health (Grossman 1972). Much of the literature has focused on BMI, obesity, and aggregate caloric intake, though the discussion above underscores that nutrient intake and the composition of foods consumed are important inputs that can have effects on health independent of BMI and calories. Aggregate caloric intake clearly exceeds recommended amounts, and this increase can at least partly account for the rise in obesity (Doytch et al. 2016). Analysing individual food groups can help shed light on issues related to whether the increase in obesity is simply due to a scale effect (an increase in the aggregate consumption of calories) or whether individuals have substituted away from 'healthier' food options toward 'unhealthier' options, as is arguably the case during recessions (Dave and Kelly 2012).
Concluding remarks
Our work suggests that high-income and upper-middle income countries have particularly high intakes of animal-based products and a prevalence of diseases of affluence. This may serve as a cautionary note to governments like the US, which encourages the intake of these food products through programmes such as “Beef: It’s What’s for Dinner” and “Pork: The Other White Meat” (Wilde 2007).
Some of the issues apply with equal importance to the flipside of the energy balance equation: how many calories we burn in physical activity. Future work should consider the role of these as well, which can contribute to a fuller understanding of how health and obesity have evolved over the past decades and across countries. A better understanding of how we consume and burn calories can aid in guiding effective policy change towards better population health.
Authors’ note: Portions reprinted from Dave et al. (2016) with permission from Elsevier.
References
Averett, S.L. and Wang, Y. (2015) ‘The double burden of malnutrition’, in Komlos, J. and Kelly, I.R. (eds.) The Oxford Handbook of Economics and Human Biology. Oxford University Press, .
Beghin, J.C. and Jensen, H.H. (2008) ‘Farm policies and added sugars in US diets’, Food Policy, 33(6), pp. 480–488.
Dave, D.M. and Kelly, I.R. (2012) ‘How does the business cycle affect eating habits?’, Social Science & Medicine, 74(2), pp. 254–262.
Dave, D., N. Doytch and I. Kelly (2016), ‘Nutrient intake: A cross-national analysis of trends and economic correlates”, Social Science and Medicine 158, pp. 158-167.
Doytch, N., Dave, D.M. and Kelly, I.R. (2014) ‘Global evidence on obesity and related outcomes: An overview of prevalence, trends, and determinants’, Eastern Economic Journal, 42(1), pp. 7–28.
Díaz-Méndez, C. and Gómez-Benito, C. (2010) ‘Nutrition and the Mediterranean diet. A historical and sociological analysis of the concept of a “healthy diet” in Spanish society’, Food Policy, 35(5), pp. 437–447.
Grossman, M. (1972) ‘On the concept of health capital and the demand for health’, Journal of Political Economy, 80(2), pp. 223–255.
Rashad, I. (2007) ‘Obesity and diabetes: The roles that prices and policies play’, Advances in Health Economics and Health Services Research, (17), pp. 113–128.
Wilde, P.E. (2007) ‘Federal Communication about Obesity in the Dietary Guidelines and Checkoff Programs’, in Acs, Z.J. and Lyles, A. (eds.) Obesity, business, and public policy. Cheltenham, UK: Elgar, Edward Publishing, .
World Health Organization (2011) Global status report on noncommunicable diseases 2010.


